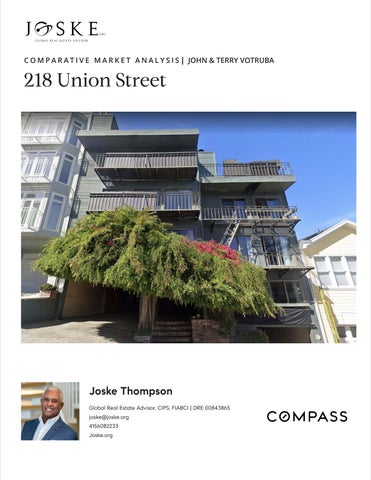
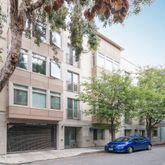
R K E T A N A L Y S I S | JOHN & TERRY VOTRUBA 218 Union Street Joske Thompson Global Real Estate Advisor, CIPS, FIABCI | DRE 00843865 joske@joske.org 4156082233 Joske.org
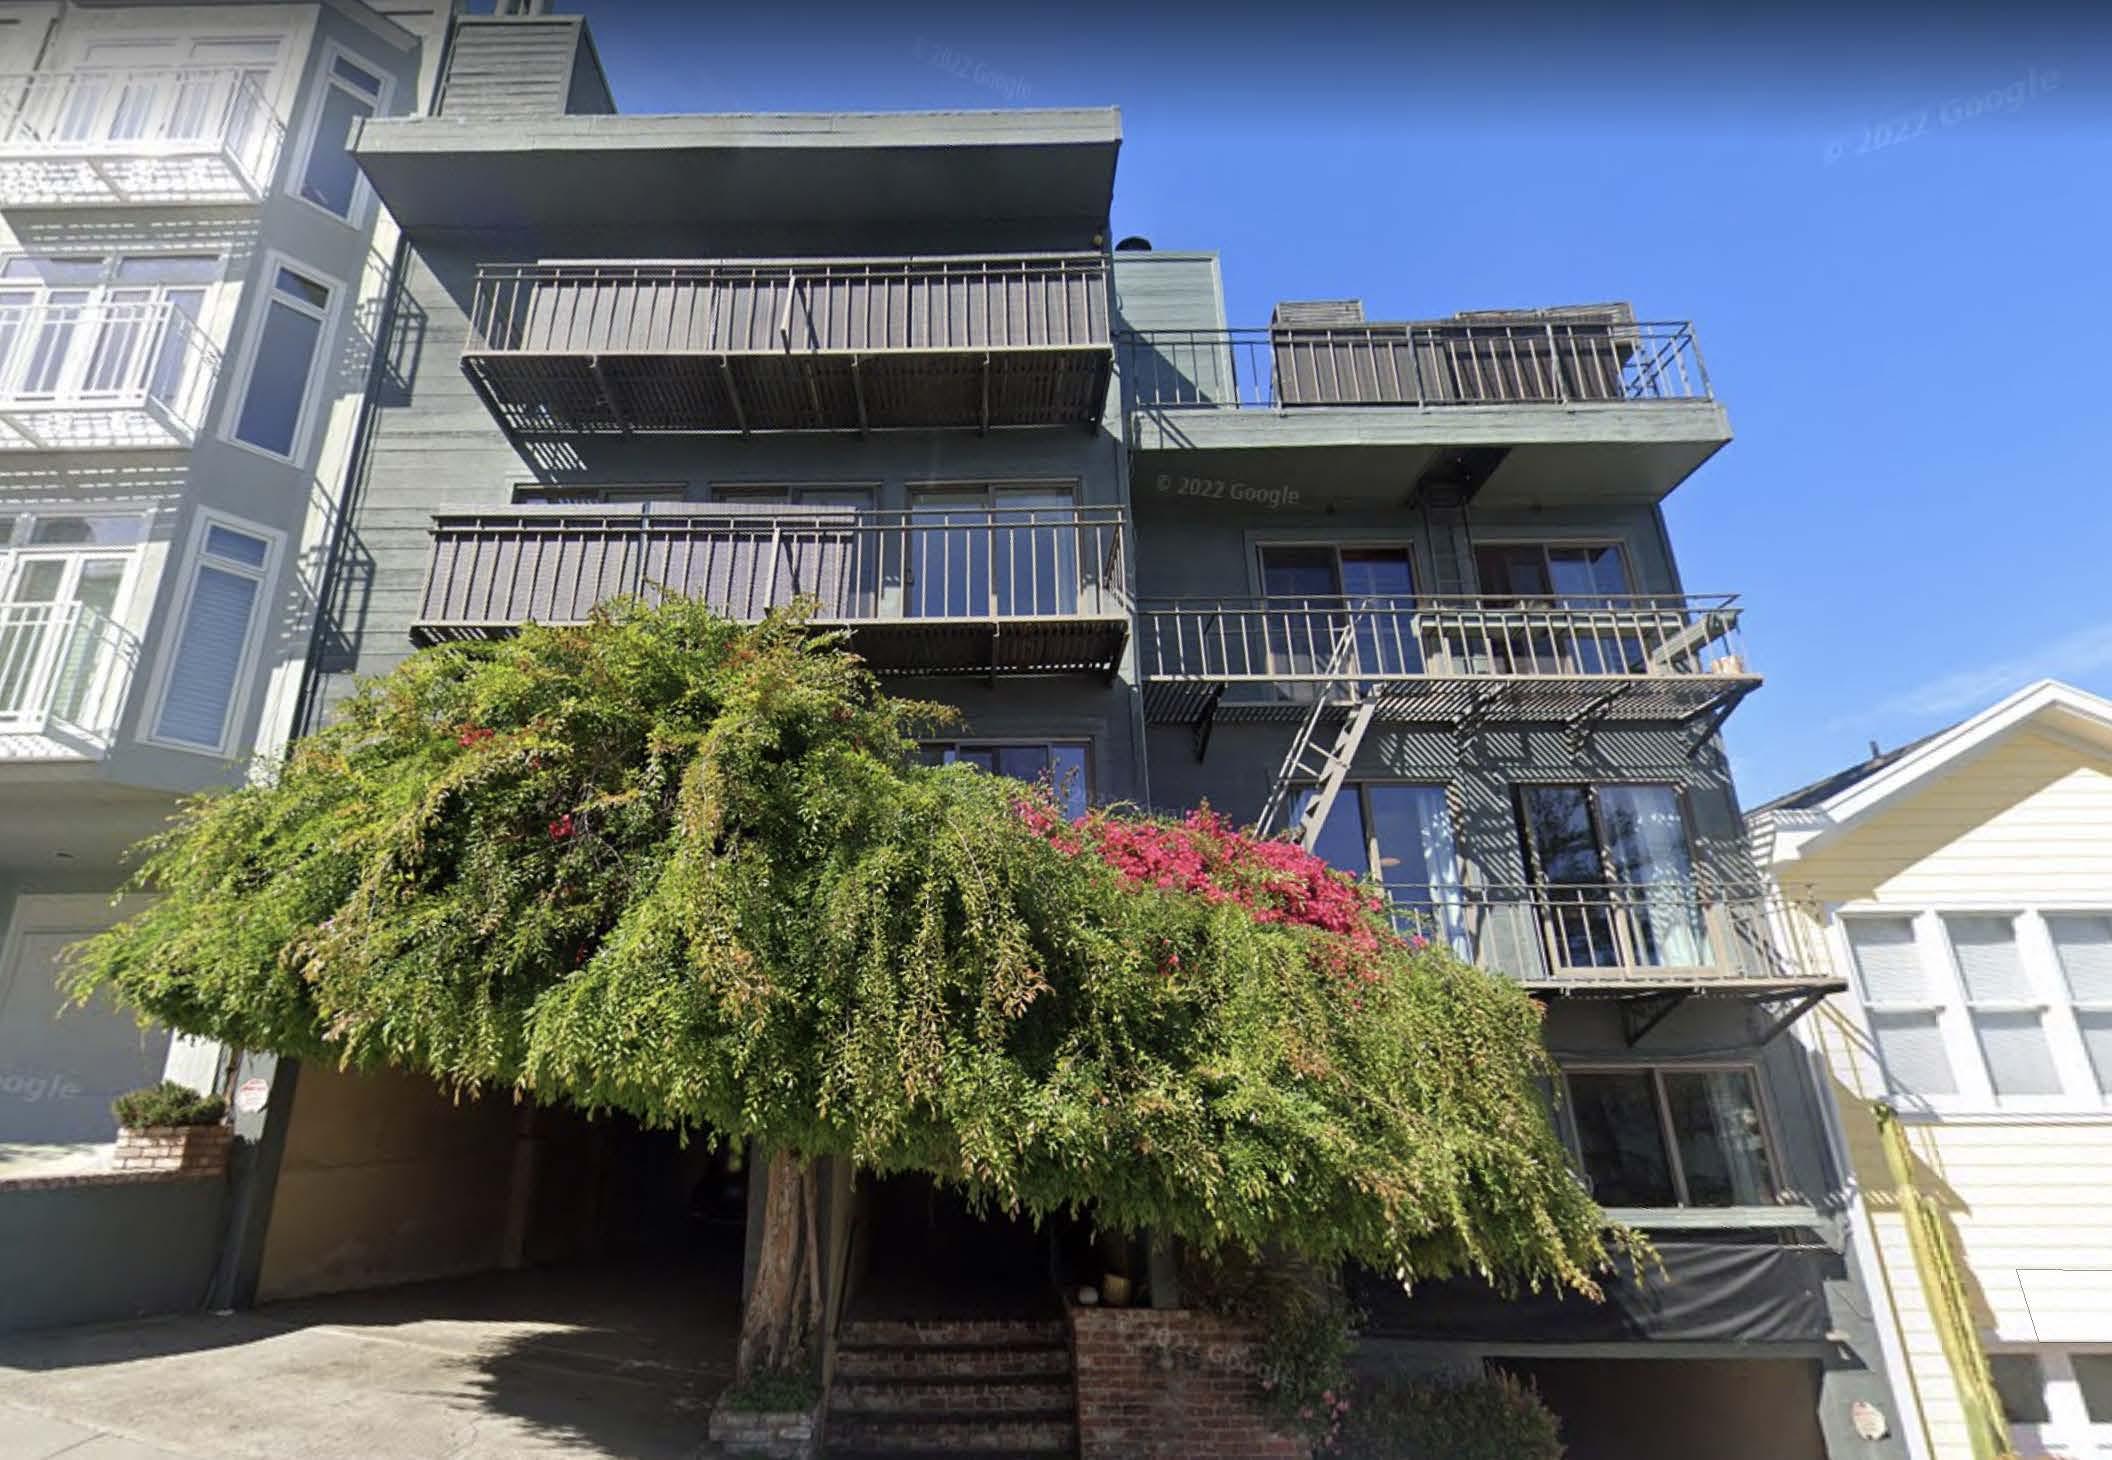
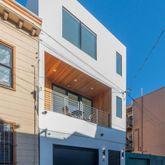
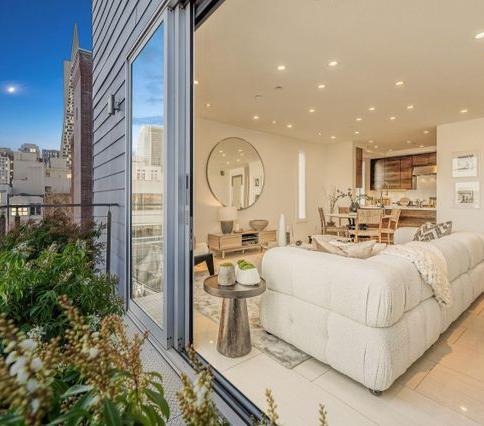
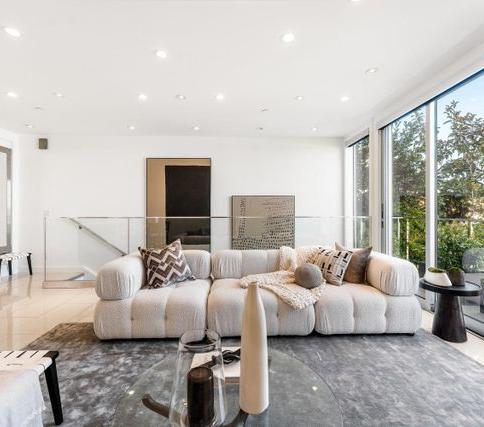
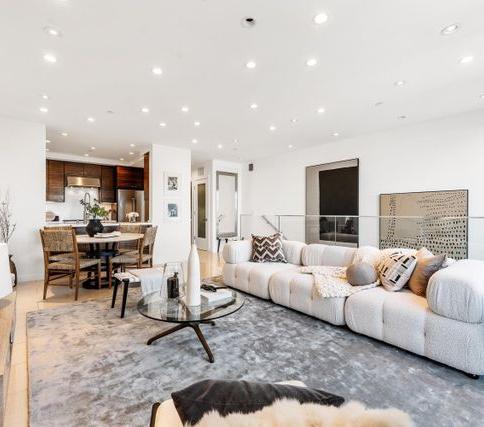
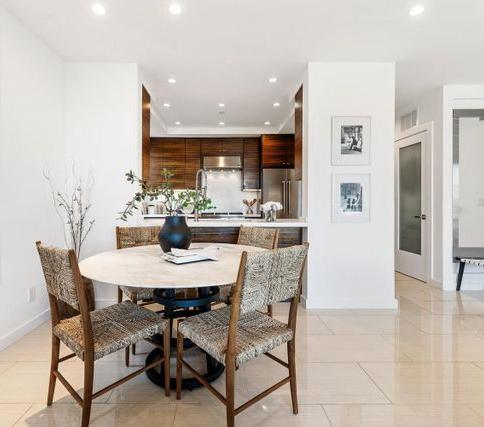
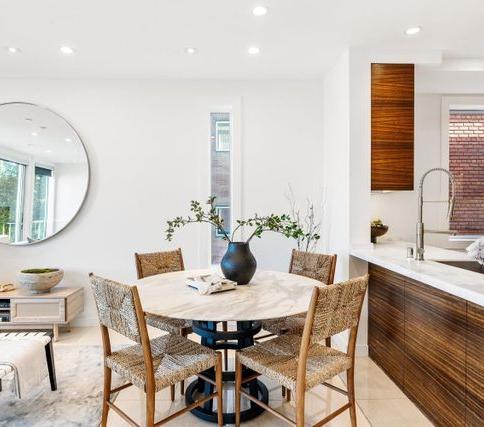
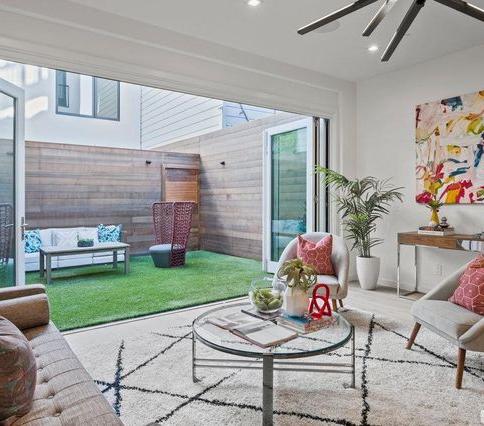
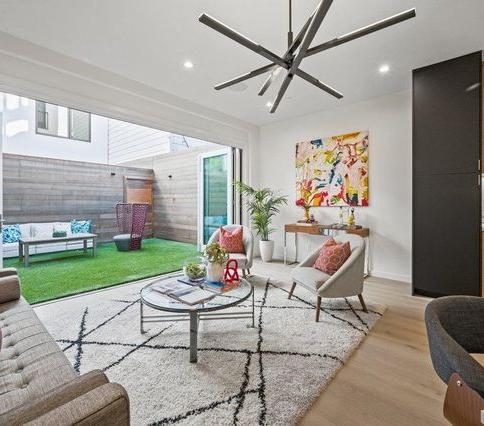
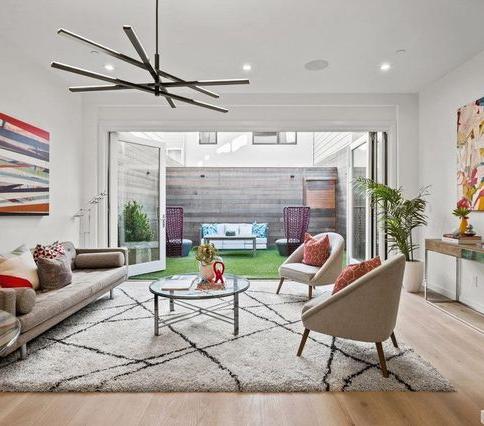
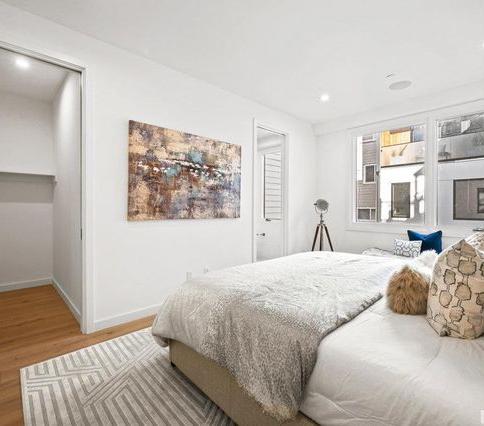
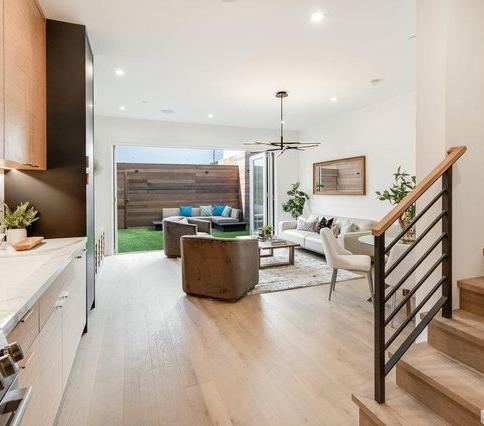
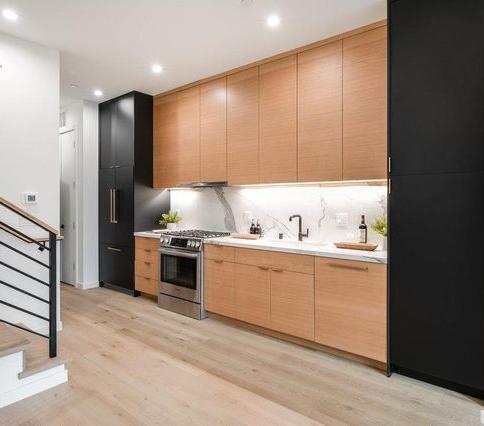
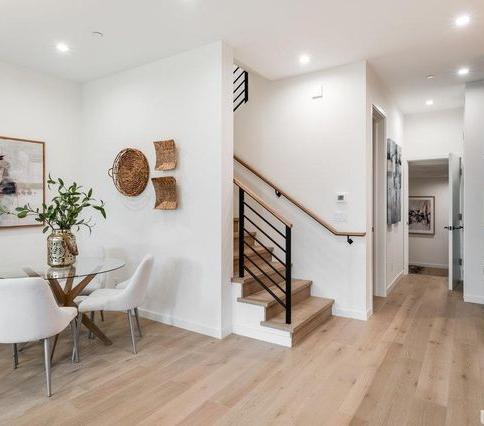
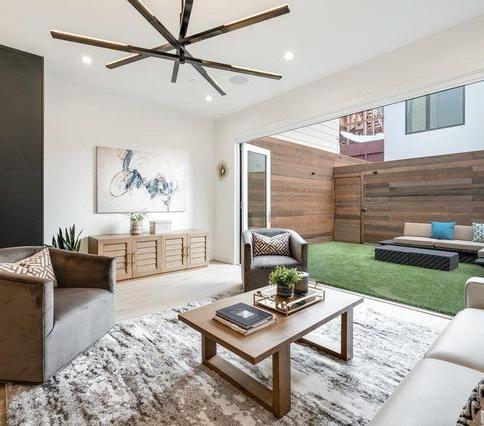
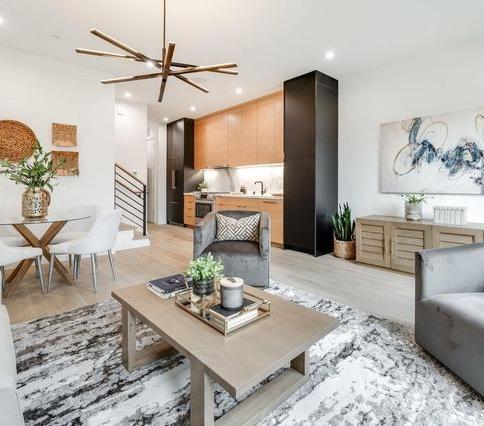
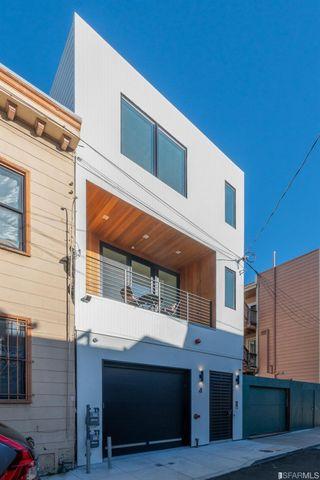
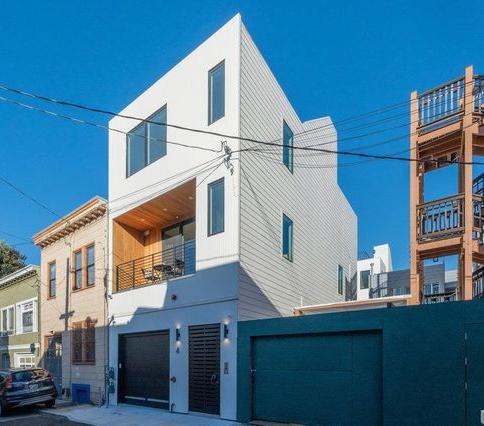
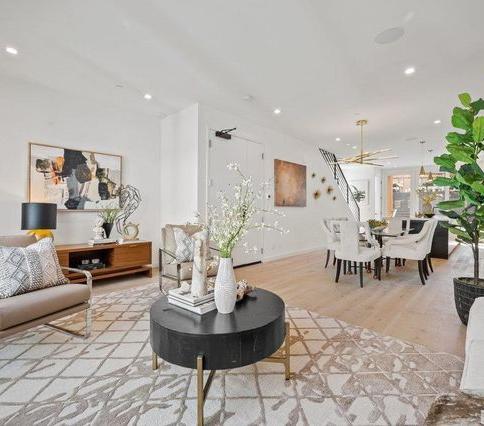
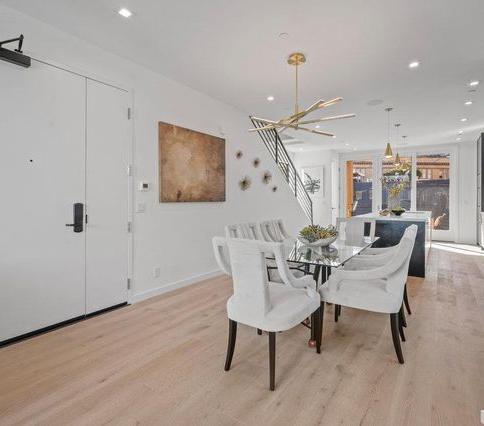
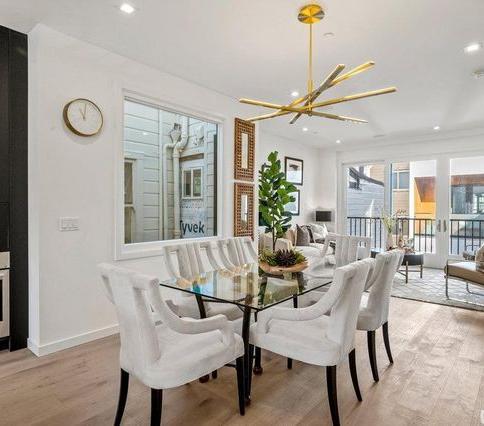
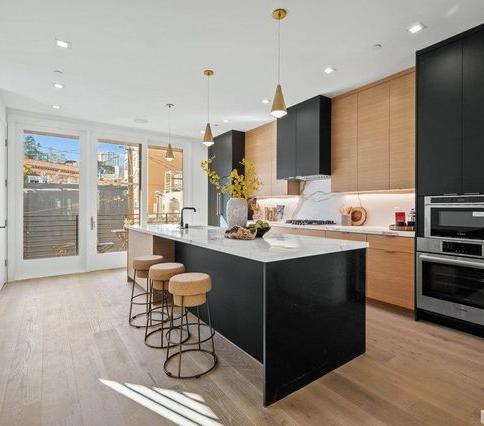
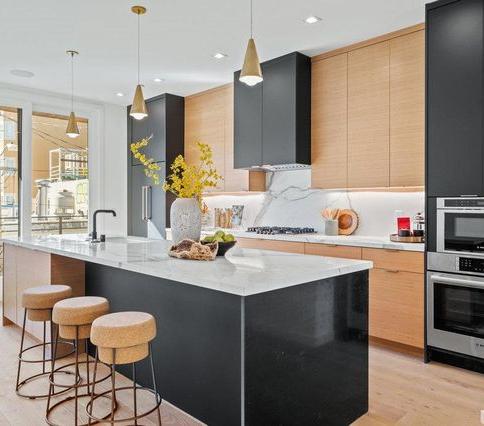
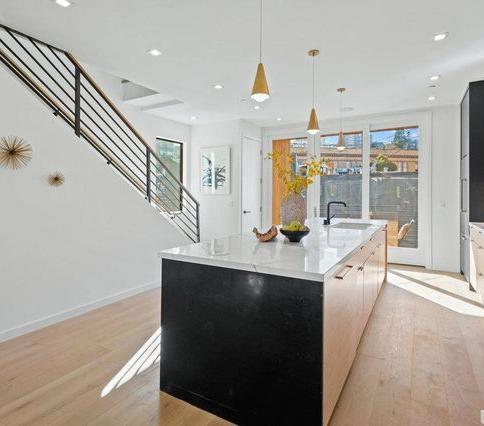
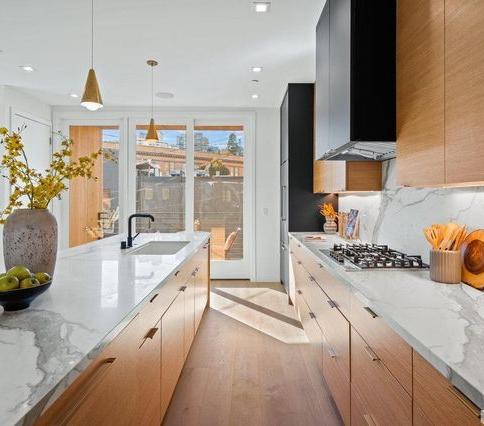
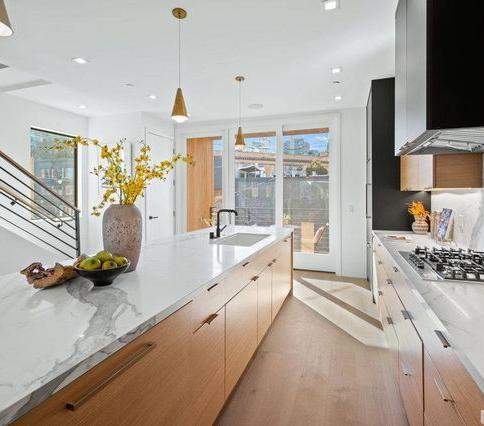
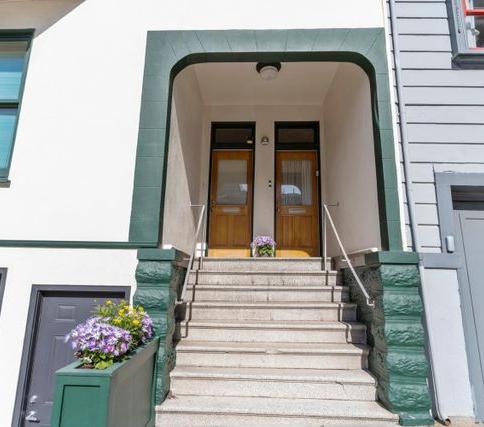
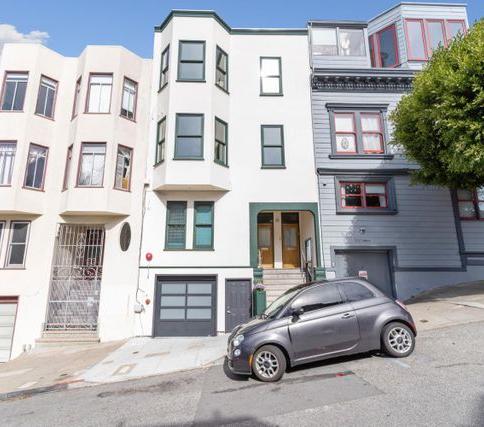
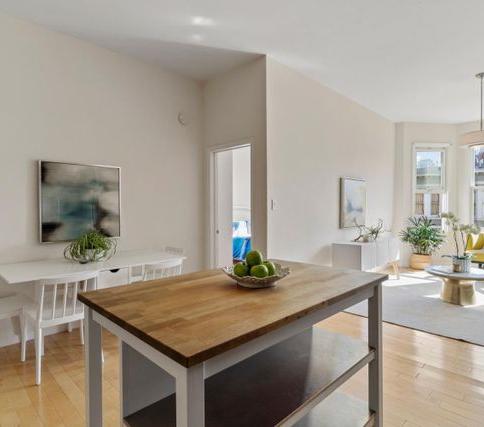
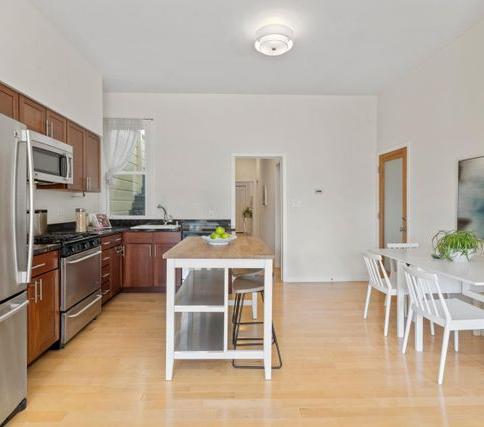
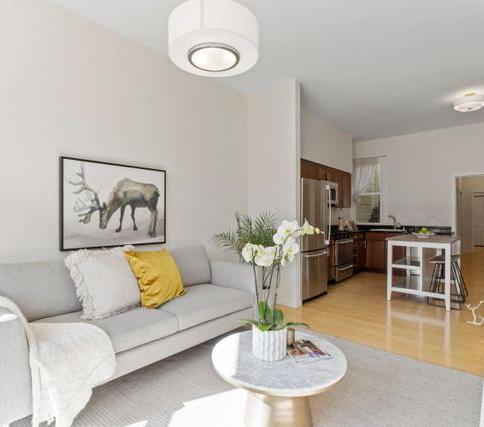
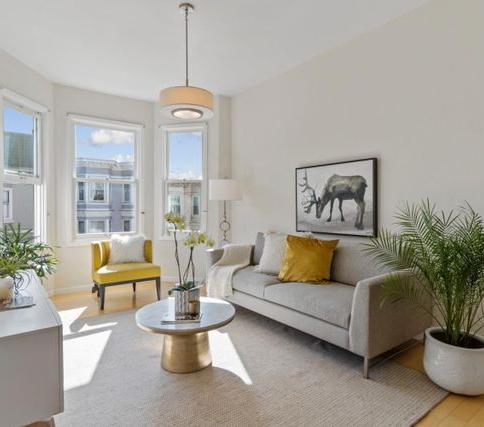
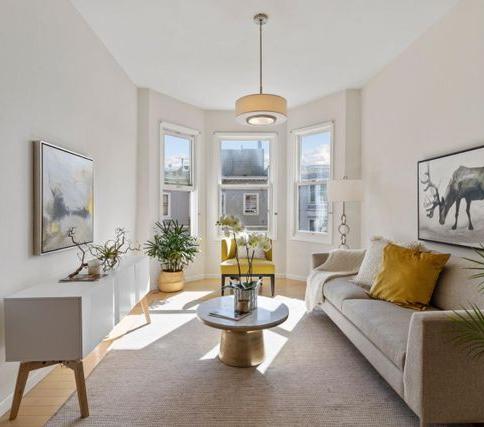
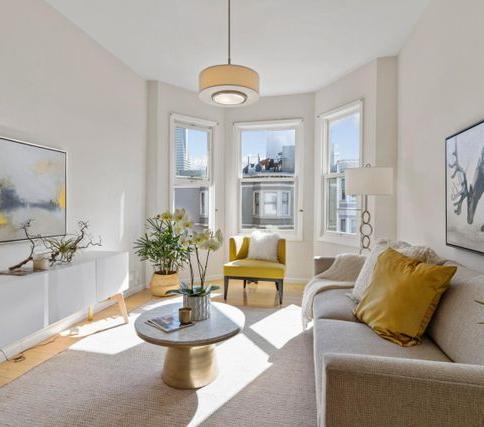
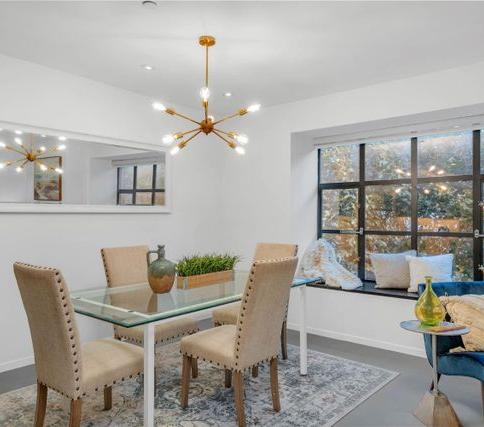
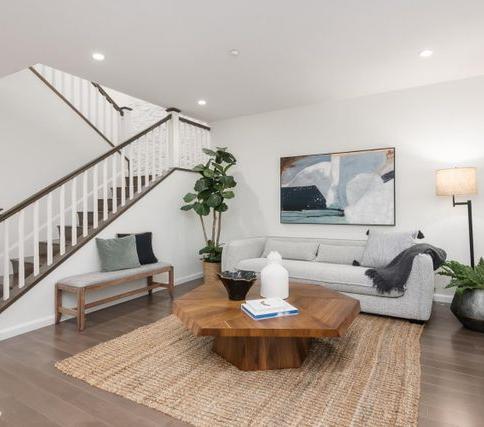
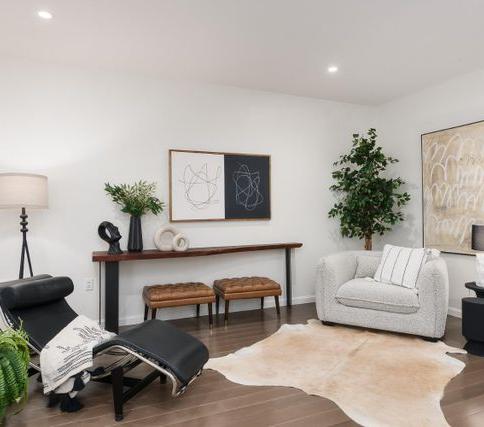
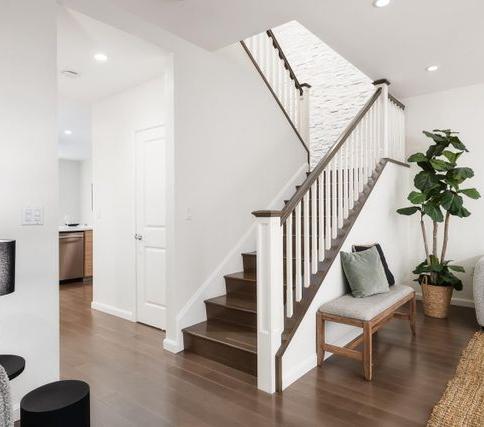
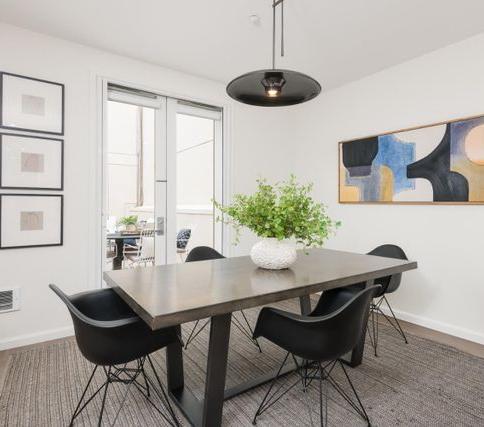
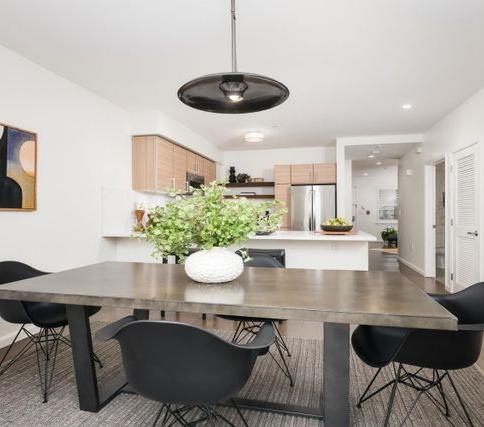
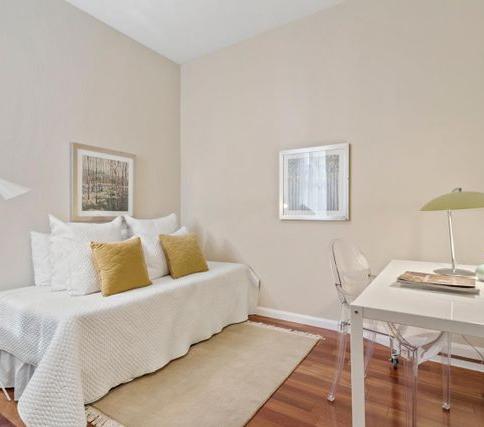
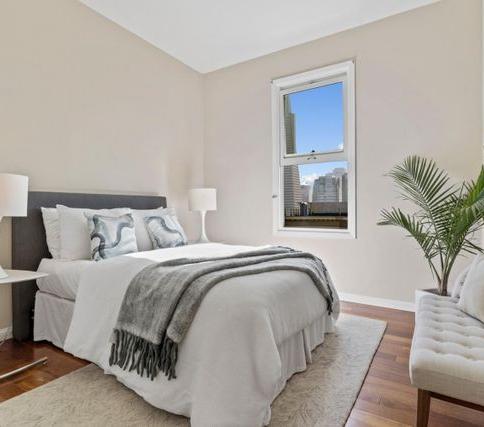
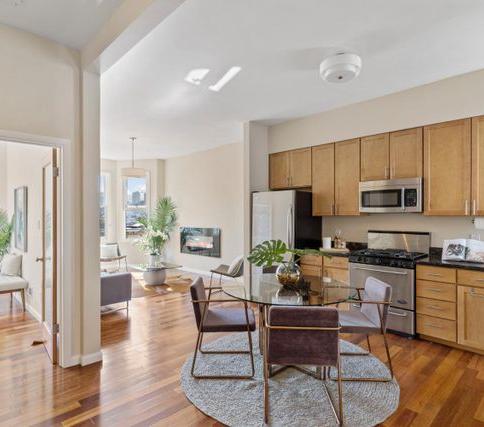
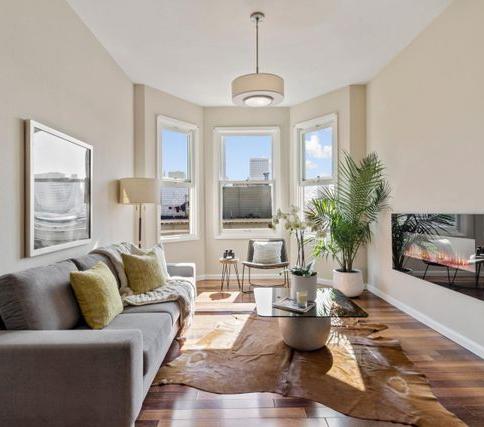
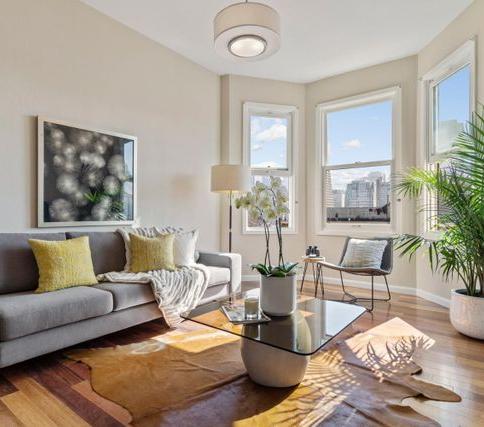
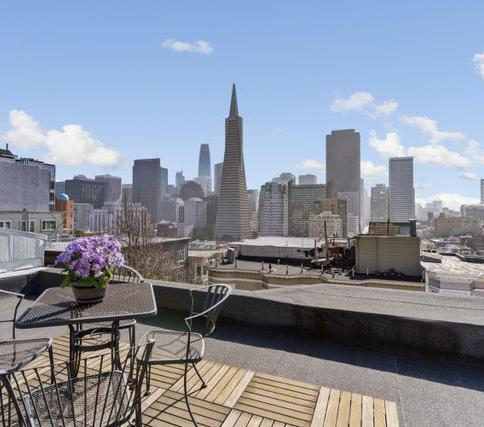
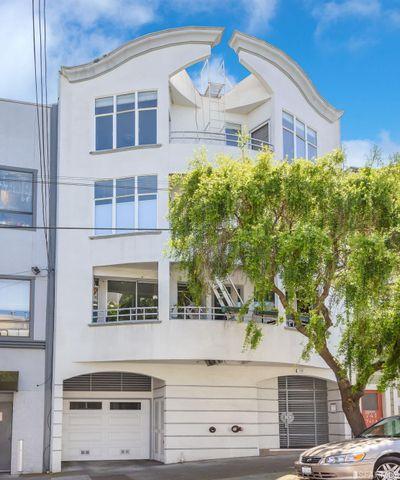
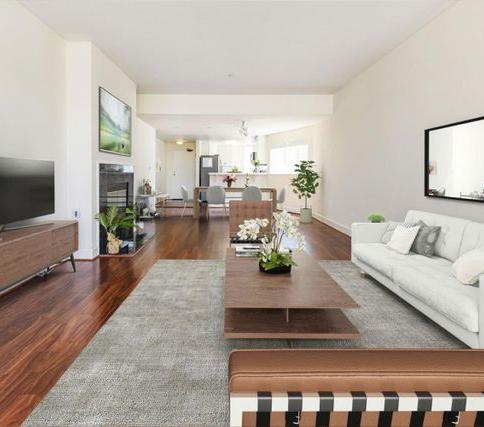
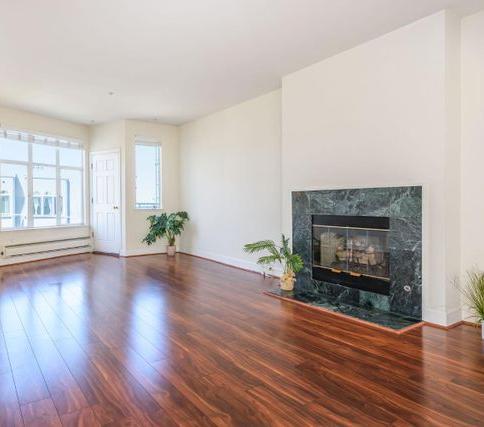
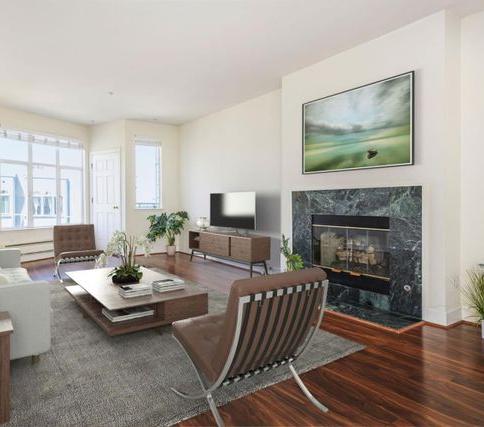
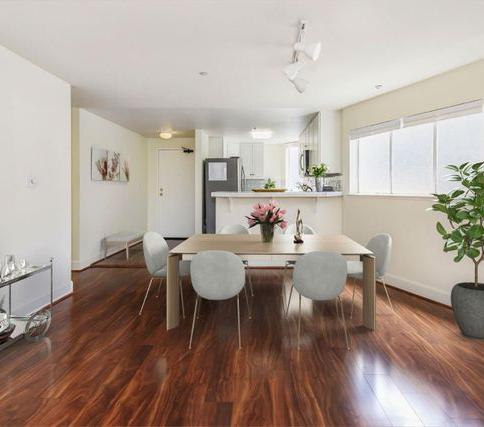
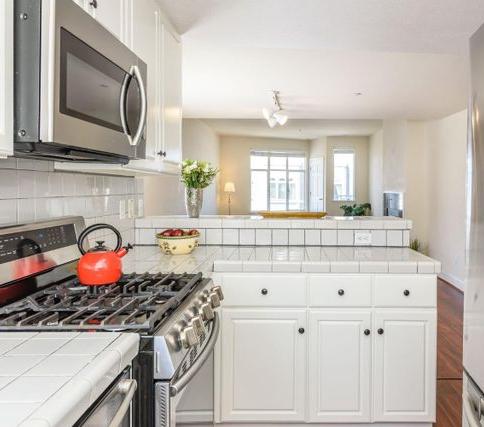
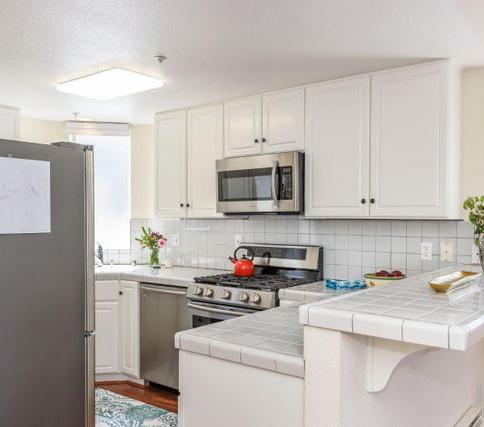
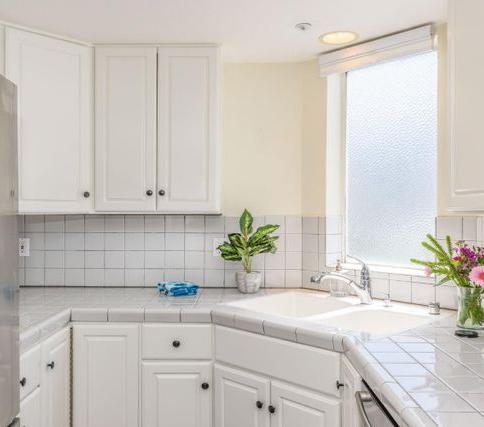
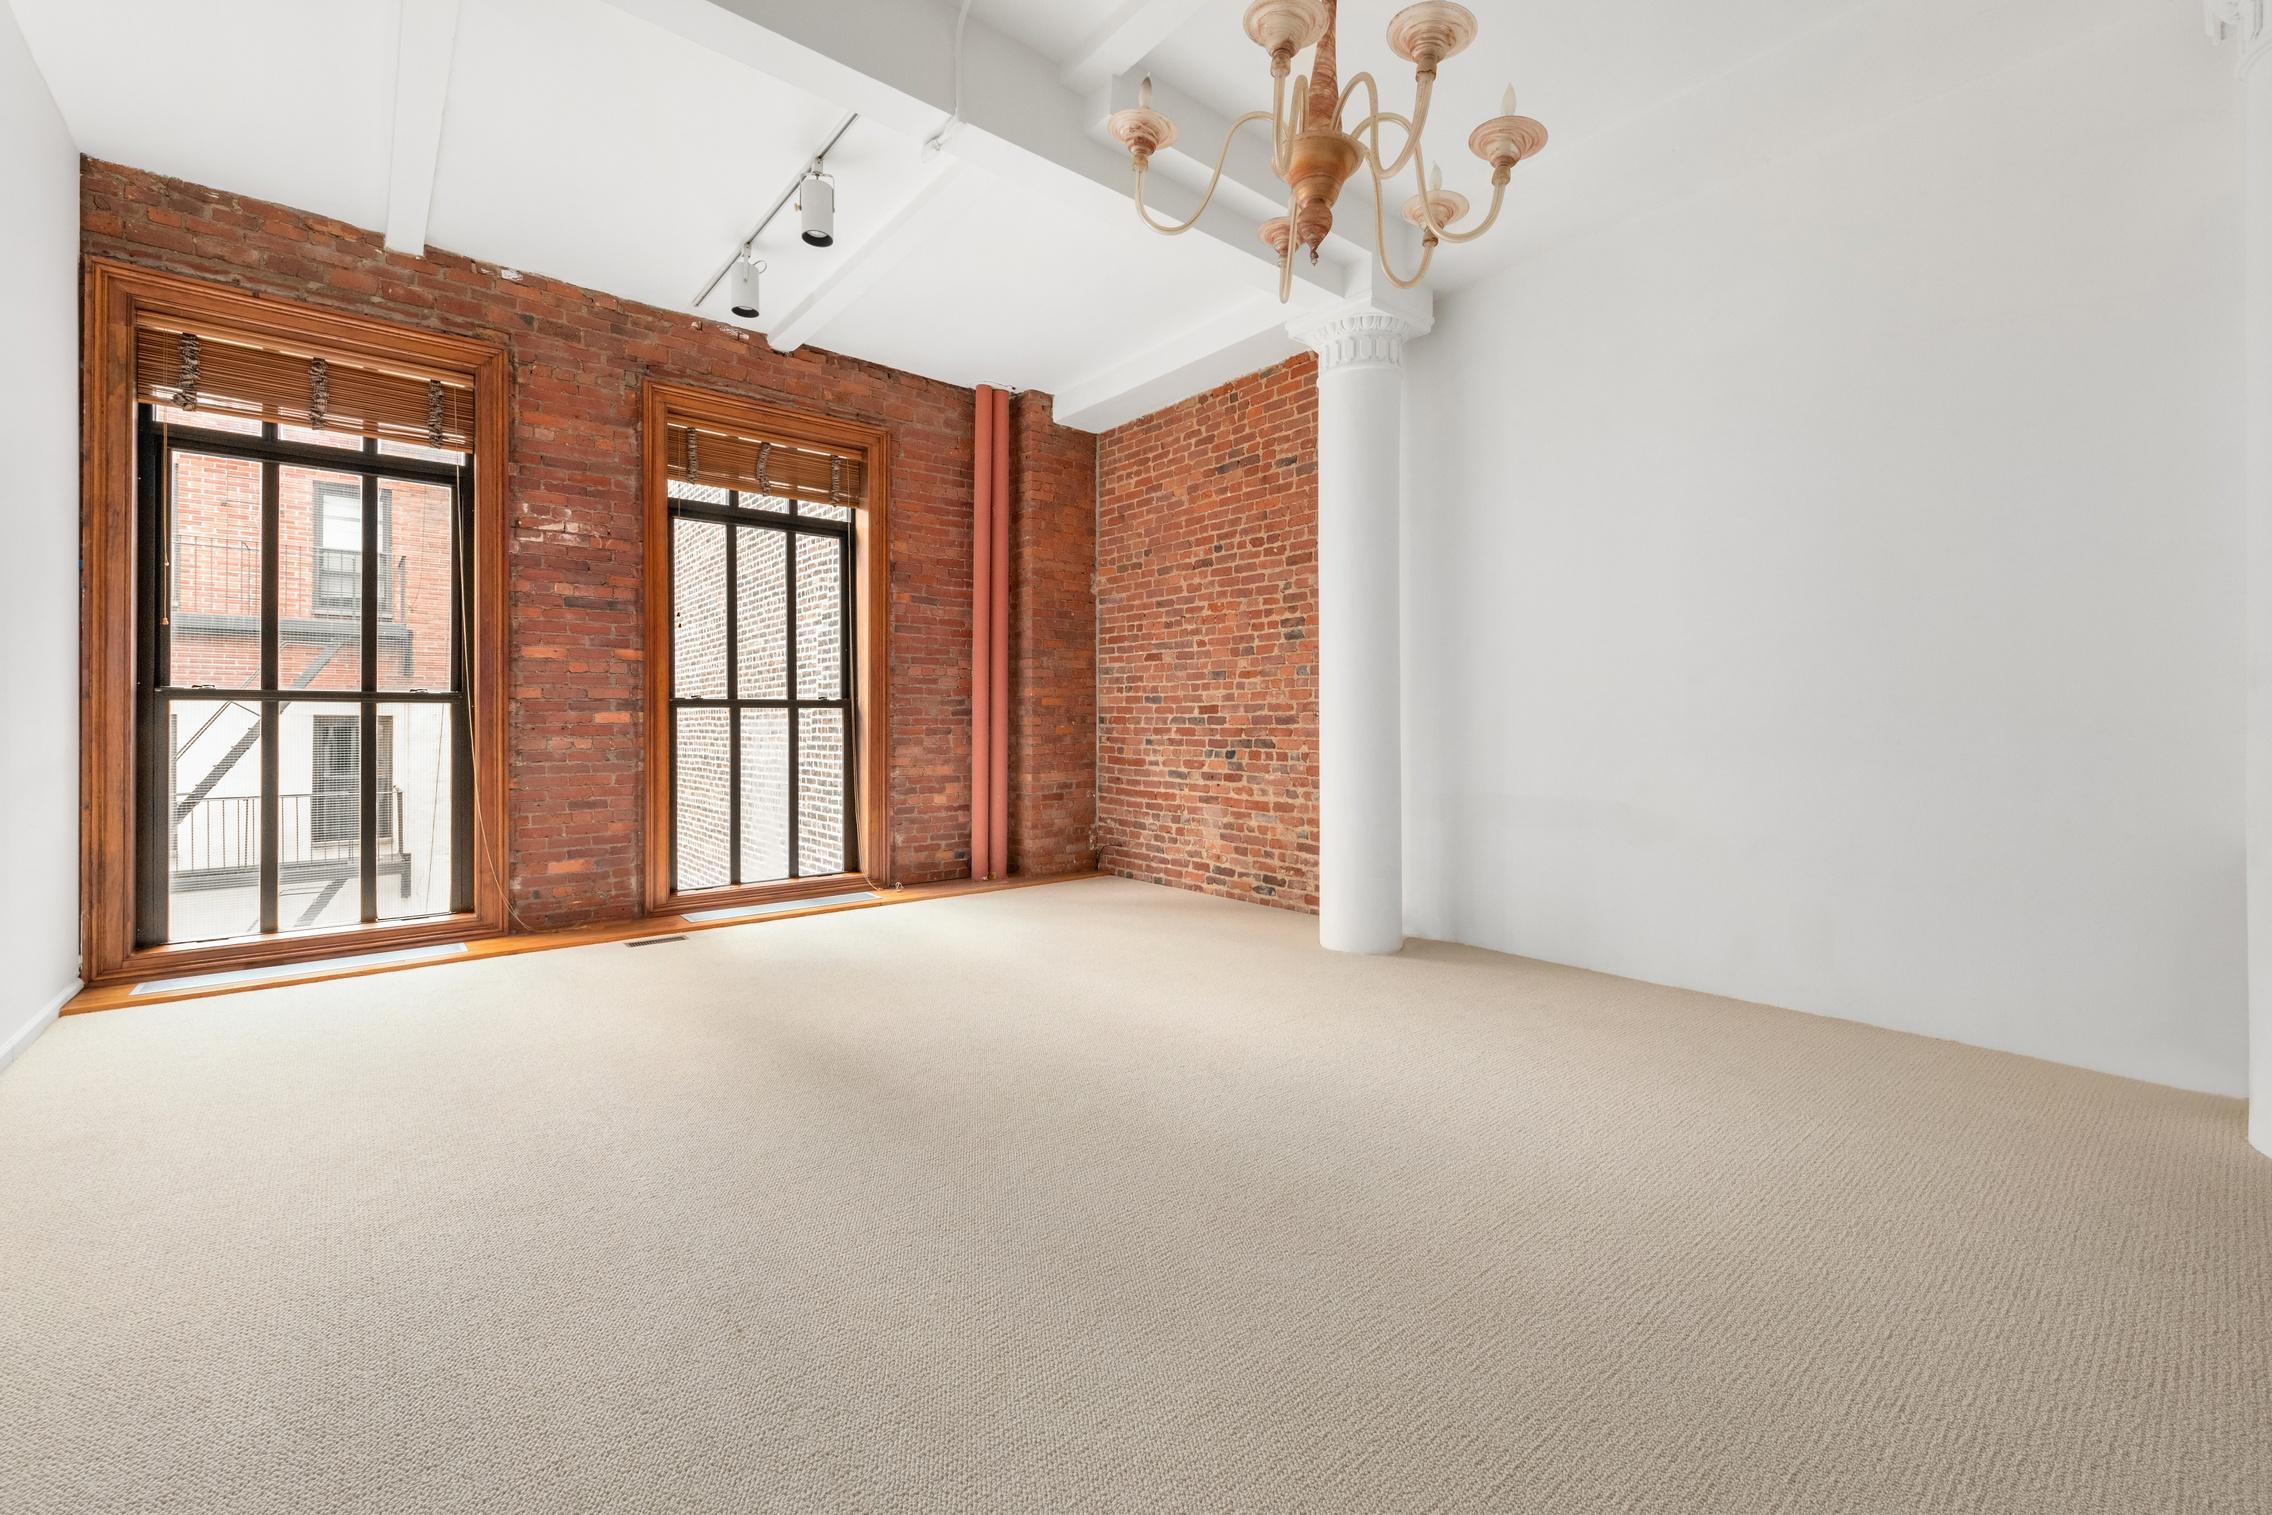
Subject
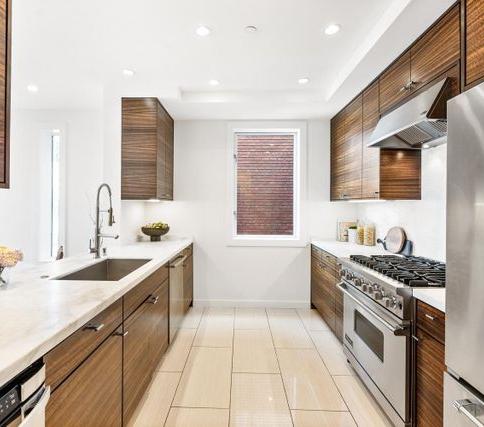
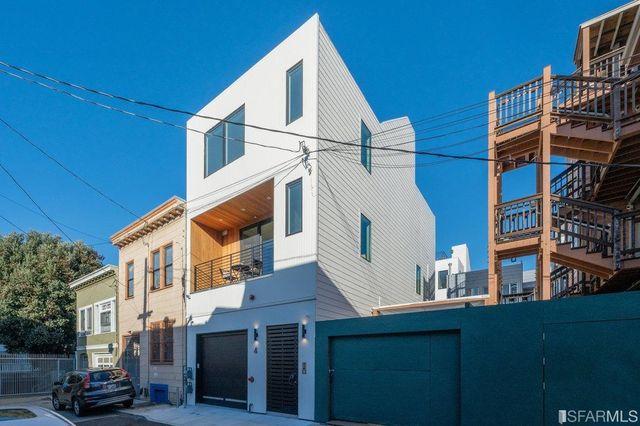
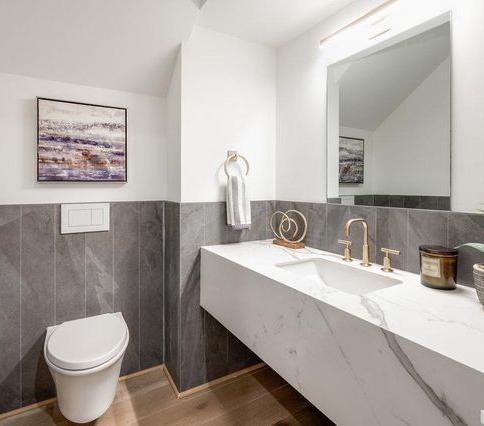
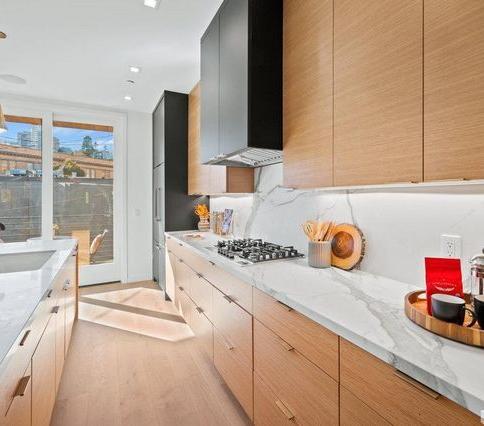
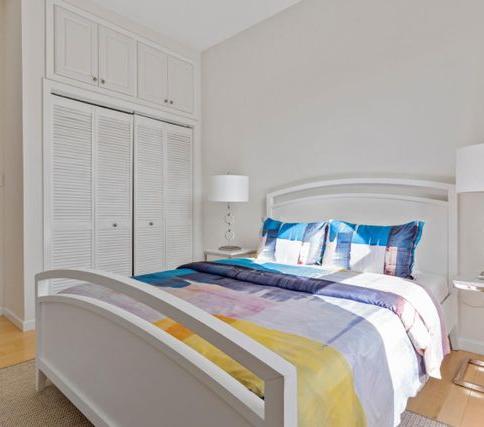
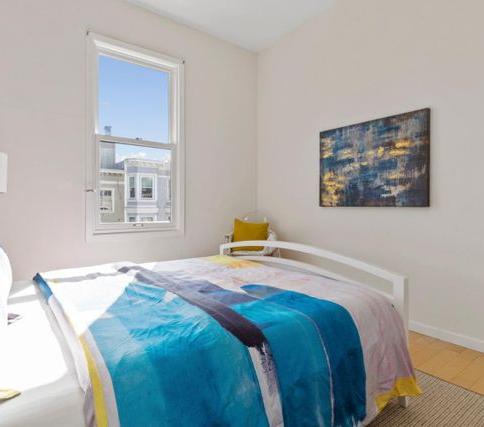
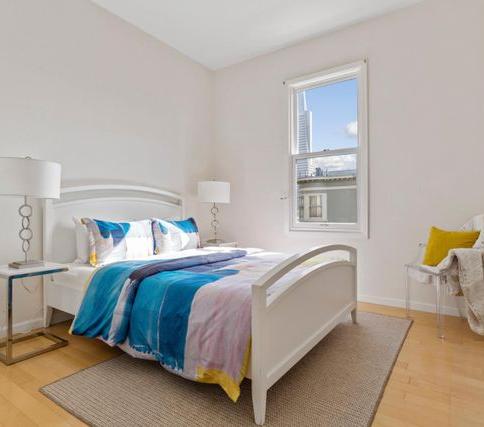
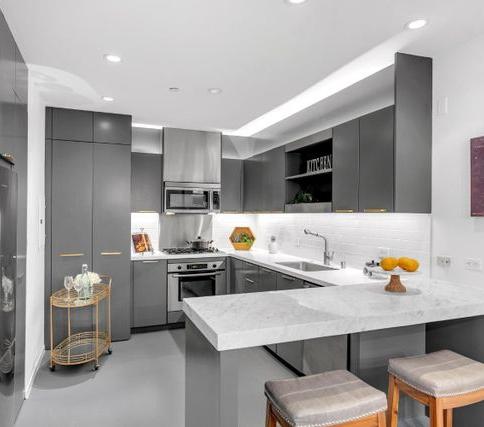
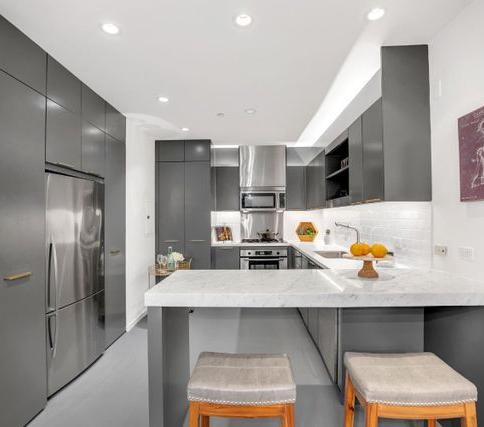
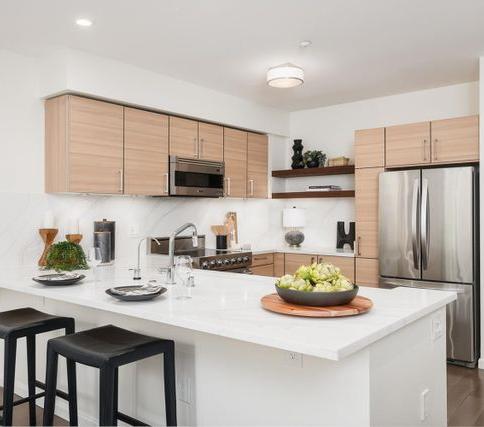
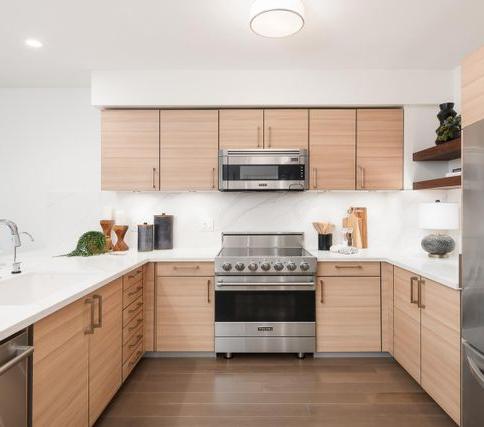
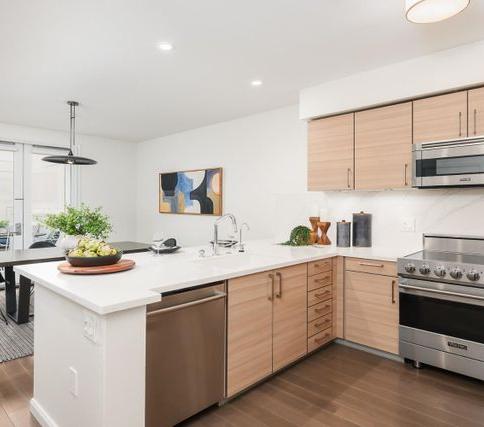
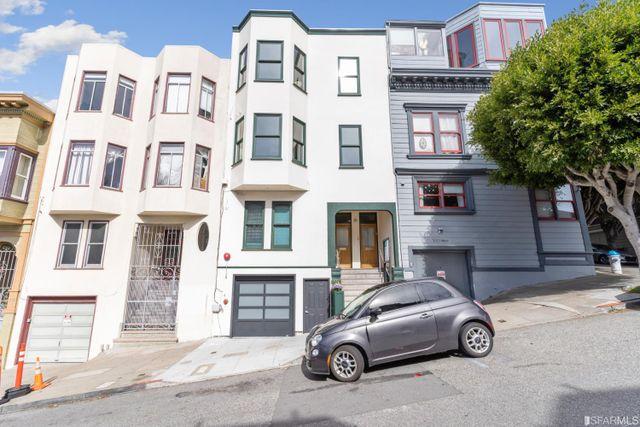
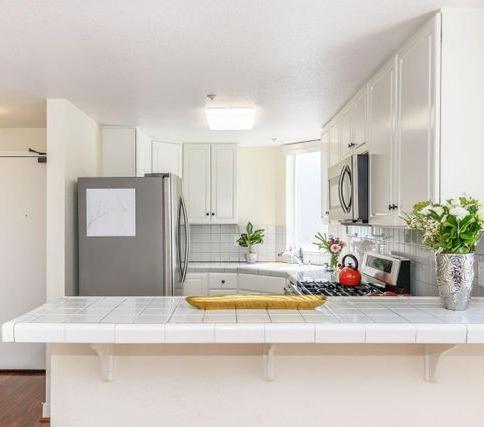
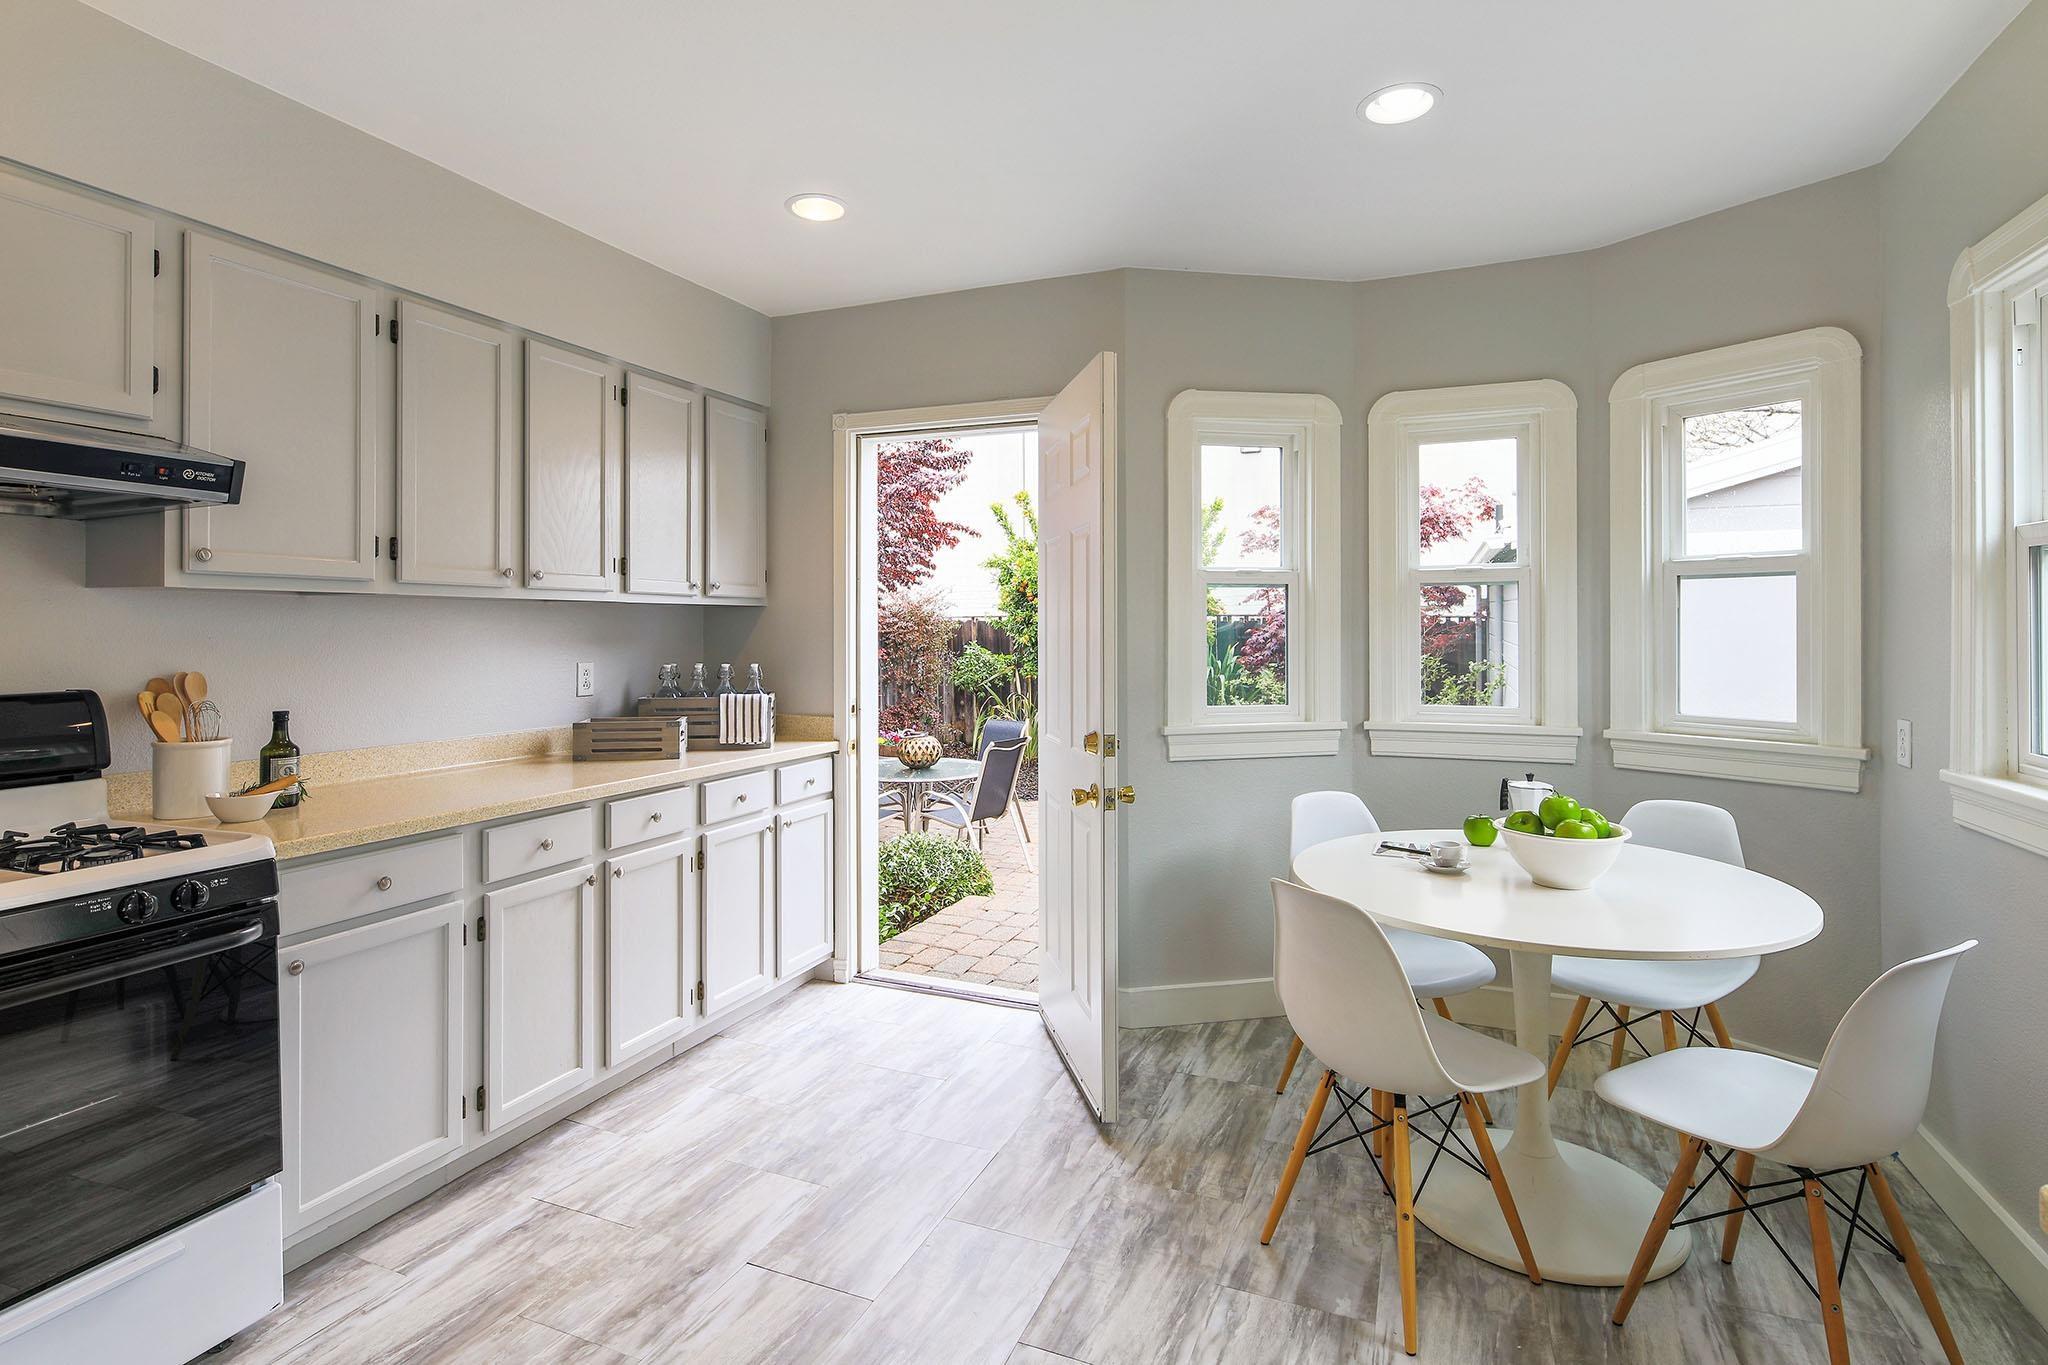
San Francisco, CA 94133 218 Union St Bedrooms 2 Baths 2 Square Feet 1,350 HOA FeesYear Built 1963 LISTING DESCRIPTION TRANSACTION INFORMATION Original Listing PriceLast Asking PriceClosing PricePPSFListed DateContract DateSold Date / DOM - Days on MarketSOLD ±
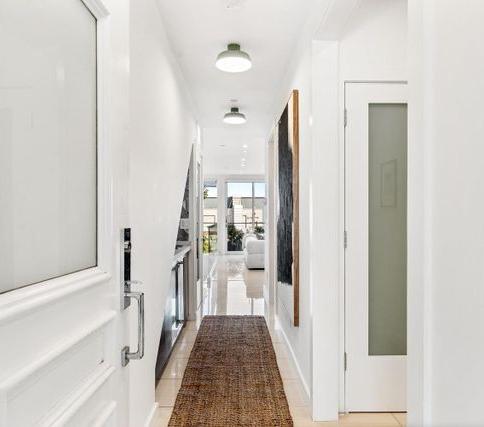
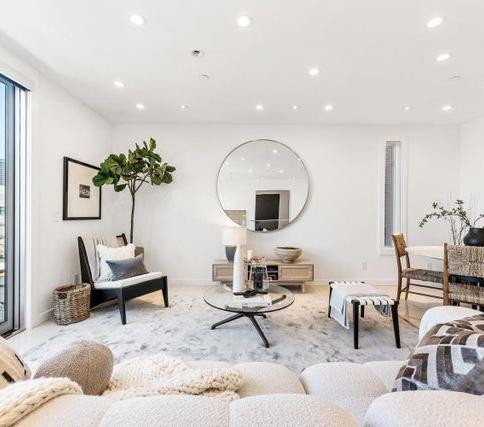
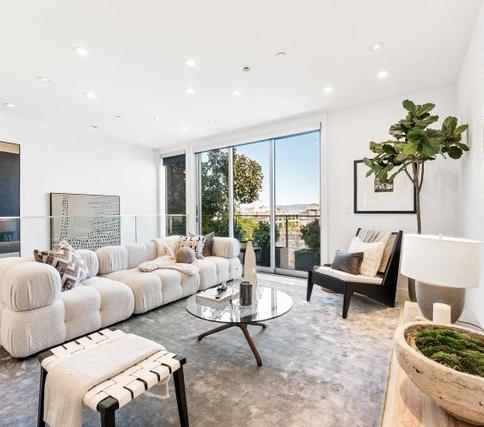
property
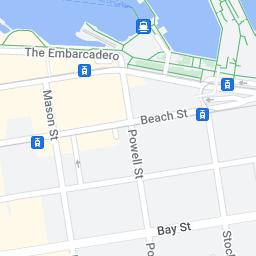
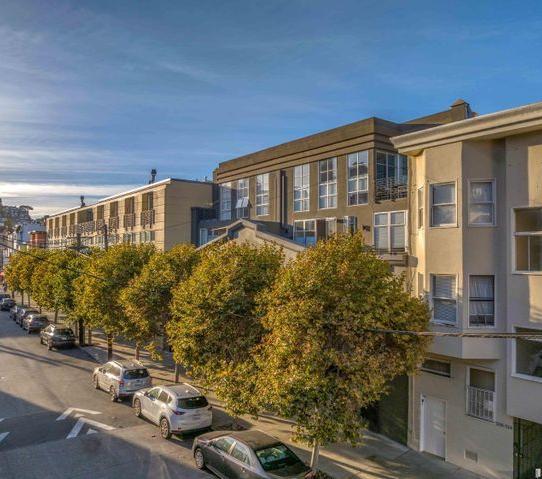
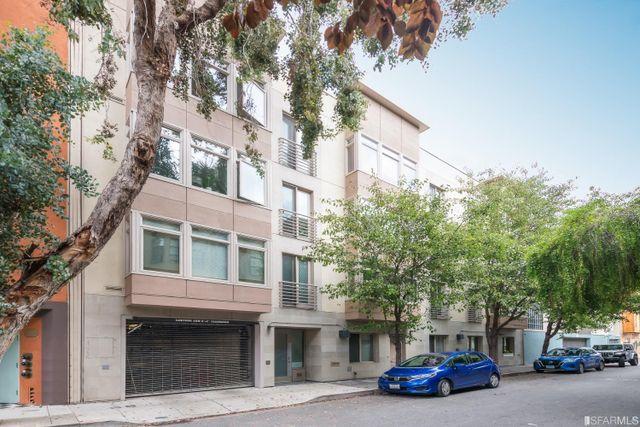
Location of comparables
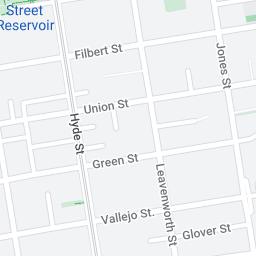
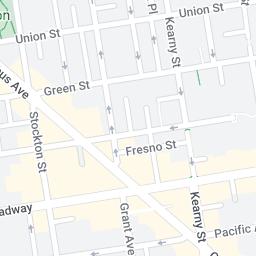
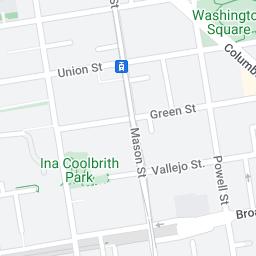
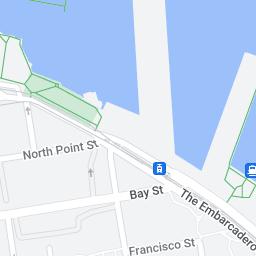
ADDRESS PRICE 1 32 Prescott Court ACTIVE 2 2 $1,349,000 77 2 4 Newell Street, Unit A ACTIVE 1 1.5 1171 $1,396,000 $1,192 69 3 2121 Mason Street, Unit A ACTIVE 1 1.5 1171 $1,450,000 $1,238 86 4 4 Newell Street ACTIVE 3 2.5 1523 $1,815,000 $1,192 69 5 508 Vallejo Street SOLD 3 2 $1,075,000 37 6 520 Chestnut Street, Unit 201 SOLD 2 2 1343 $1,250,000 $931 33 7 18 Vandewater Street SOLD 3 3 1860 $1,475,000 $793 137 8 506 Vallejo Street PENDING 3 2 $1,099,000 93 1 23 4 5 6 7 8 9 Map data ©2023 Google Report a map error
May 19, 2023 ADDRESS STATUS BEDS BATHS SQFT PRICE $/SQFT DOM 9 733 Filbert Street, Unit 6 PENDING 2 2 1208 $1,149,000 $951 13
Location of comparables


Side-by-Side Comparison May 19, 2023 ADDRESS SUBJECT 218 Union St, San Francisco, CA 94133 COMP #1 32 Prescott Ct, San Francisco, CA 94133 COMP #2 4 Newell St, Unit A, San Francisco, CA 94133 COMP #3 2121 Mason St, Unit A, San Francisco, CA 94133 STATUS - ACTIVE ACTIVE ACTIVE BEDROOMS 2 2 1 1 BATHS 2 2 1.5 1.5 SQUARE FEET 1,350 - 1,171 1,171 PPSF - - $1,192 $1,238 ORIGINAL LISTING PRICE - $1,349,000 $1,396,000 $1,450,000 LAST ASKING PRICE - $1,349,000 $1,396,000 $1,450,000 CLOSING PRICE - - -HOA FEES - $423 / Mo -CONDO/CO-OP FEES - - -TAXES - - -LISTED DATE - Mar 03, 2023 Feb 21, 2023 Feb 04, 2023 ±
Side-by-Side Comparison May 19, 2023 ADDRESS SUBJECT 218 Union St, San Francisco, CA 94133 COMP #1 32 Prescott Ct, San Francisco, CA 94133 COMP #2 4 Newell St, Unit A, San Francisco, CA 94133 COMP #3 2121 Mason St, Unit A, San Francisco, CA 94133 CONTRACT DATE - - -SOLD DATE - - -DOM - DAYS ON MARKET - 77 69 86 LOT SIZE - - -PROPERTY TYPE Condo Condo Condo Condo YEAR BUILT 1963 - 1918 1918


Side-by-Side Comparison May 19, 2023 ADDRESS SUBJECT 218 Union St, San Francisco, CA 94133 COMP #4 4 Newell St, San Francisco, CA 94133 COMP #5 508 Vallejo St, San Francisco, CA 94133 COMP #6 520 Chestnut St, Unit 201, San Francisco, CA 94133 STATUS - ACTIVE CLOSED CLOSED BEDROOMS 2 3 3 2 BATHS 2 2.5 2 2 SQUARE FEET 1,350 1,523 - 1,343 PPSF - $1,192 - $931 ORIGINAL LISTING PRICE - $1,815,000 $1,099,000 $1,250,000 LAST ASKING PRICE - $1,815,000 $1,099,000 $1,268,000 CLOSING PRICE - - $1,075,000 $1,250,000 HOA FEES - - $250 / Mo $899 / Mo CONDO/CO-OP FEES - - -TAXES - - -LISTED DATE - Feb 21, 2023 Feb 17, 2023 Jan 20, 2023 ±
Comparison May 19, 2023 ADDRESS SUBJECT 218 Union St, San Francisco, CA 94133 COMP #4 4 Newell St, San Francisco, CA 94133 COMP #5 508 Vallejo St, San Francisco, CA 94133 COMP #6 520 Chestnut St, Unit 201, San Francisco, CA 94133 CONTRACT DATE - - Mar 26, 2023 Feb 22, 2023 SOLD DATE / - Mar 27, 2023 Mar 22, 2023 DOM - DAYS ON MARKET - 69 37 33 LOT SIZE - - -PROPERTY TYPE Condo Condo Co-op Condo YEAR BUILT 1963 1918 - 2007
Side-by-Side
Side-by-Side Comparison May 19, 2023 ADDRESS SUBJECT 218 Union St, San Francisco, CA 94133 COMP #7 18 Vandewater St, San Francisco, CA 94133 COMP #8 506 Vallejo St, San Francisco, CA 94133 COMP #9 733 Filbert St, Unit 6, San Francisco, CA 94133 STATUS - CLOSED CONTINGENT - NO SH ... [1] CONTINGENT - NO SH ... [2] BEDROOMS 2 3 3 2 BATHS 2 3 2 2 SQUARE FEET 1,350 1,860 - 1,208 PPSF - $793 - $951 ORIGINAL LISTING PRICE - $1,448,000 $1,195,000 $1,149,000 LAST ASKING PRICE - $1,448,000 $1,099,000 $1,149,000 CLOSING PRICE - $1,475,000 -HOA FEES - $875 / Mo $250 / Mo $800 / Mo CONDO/CO-OP FEES - - -TAXES - - -LISTED DATE - Sep 22, 2022 Feb 14, 2023 Apr 26, 2023 [1] Contingent - No Show [2] Contingent - No Show ±
Side-by-Side Comparison May 19, 2023 ADDRESS SUBJECT 218 Union St, San Francisco, CA 94133 COMP #7 18 Vandewater St, San Francisco, CA 94133 COMP #8 506 Vallejo St, San Francisco, CA 94133 COMP #9 733 Filbert St, Unit 6, San Francisco, CA 94133 CONTRACT DATE - Feb 06, 2023 May 17, 2023 May 05, 2023 SOLD DATE - Mar 06, 2023 -DOM - DAYS ON MARKET - 137 93 13 LOT SIZE - - -PROPERTY TYPE Condo Condo Co-op Condo YEAR BUILT 1963 2007 - 1993
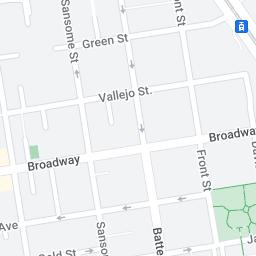
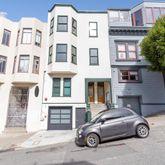
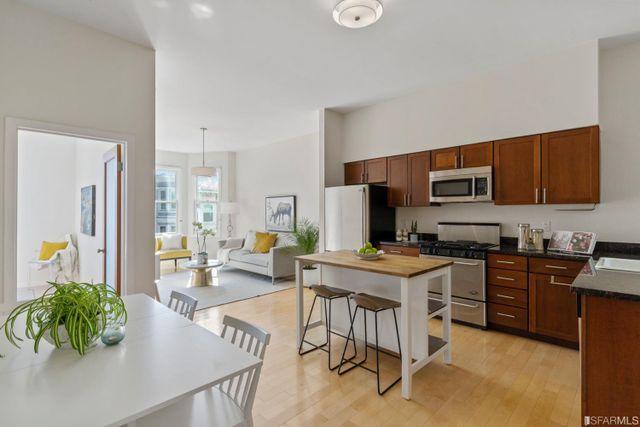
Comparable property #1
San Francisco, CA 94133
32 Prescott Ct
TRANSACTION INFORMATION
Original Listing Price $1,349,000
Last Asking Price $1,349,000
Closing Price -
PPSF -
Listed Date Mar 03, 2023
Contract
Bedrooms 2 Baths 2 Square FeetHOA Fees $423 / Mo Year Built -
Days on
77
DateSold DateDOM -
Market
ACTIVE

Comparable property #1 32 Prescott Ct
Comparable property #2
TRANSACTION INFORMATION
Original Listing Price $1,396,000
Last Asking Price $1,396,000
Closing PricePPSF $1,192
Listed Date Feb 21, 2023
Contract DateSold DateDOM -
Newell St, Unit A Bedrooms 1 Baths 1 5 Square Feet 1,171 HOA FeesYear Built 1918
San Francisco, CA 94133 4
on
69 ACTIVE
Days
Market
Comparable property #2

4 Newell St, Unit A
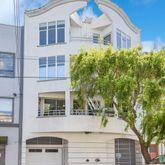
Comparable property #3
San Francisco, CA 94133
2121 Mason St, Unit A
TRANSACTION INFORMATION
Bedrooms 1 Baths 1 5 Square Feet 1,171 HOA FeesYear Built 1918
$1,450,000
Original Listing Price
$1,450,000
PPSF $1,238
Last Asking Price
Closing Price -
Listed Date Feb 04, 2023
-
Days on Market 86 ACTIVE
Contract DateSold Date
DOM -
Comparable property #3
 2121 Mason St, Unit A
Comparable property #4
TRANSACTION INFORMATION
Original Listing Price $1,815,000
Last Asking Price $1,815,000
Closing PricePPSF $1,192
Listed Date Feb 21, 2023
Contract DateSold Date -
Newell St Bedrooms 3 Baths 2.5 Square Feet 1,523 HOA FeesYear Built 1918
San Francisco, CA 94133 4
DOM - Days on Market 69 ACTIVE
4 Newell St
Comparable property #4
Comparable property #5
San Francisco, CA 94133
508 Vallejo St
TRANSACTION INFORMATION
Original Listing Price
$1,099,000
Last Asking Price $1,099,000
Closing Price $1,075,000
PPSF -
Listed Date Feb 17, 2023
Contract Date Mar 26, 2023
Sold Date Mar 27, 2023
DOM - Days on Market 37
Bedrooms 3 Baths 2 Square FeetHOA Fees $250 / Mo Year Built -
SOLD
Comparable property #5

Vallejo St
508
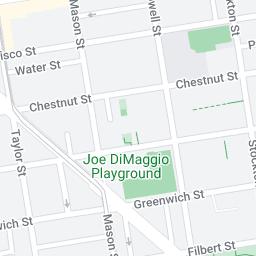
Comparable property #6
San Francisco, CA 94133
520 Chestnut St, Unit 201
TRANSACTION INFORMATION
Original Listing Price $1,250,000
Last Asking Price $1,268,000
Closing Price $1,250,000
PPSF $931
Listed Date Jan 20, 2023
Contract Date Feb 22, 2023
Sold Date Mar 22, 2023
DOM - Days on Market 33
Bedrooms 2 Baths 2 Square Feet 1,343 HOA Fees $899 / Mo Year Built 2007
SOLD
Comparable property #6


 520 Chestnut St, Unit 201
Comparable property #7
San Francisco, CA 94133
TRANSACTION INFORMATION
Original Listing Price
Last
PPSF $793
Listed Date Sep 22, 2022
Contract Date Feb 06, 2023
Sold Date Mar 06, 2023
DOM - Days on Market 137
Bedrooms 3 Baths 3 Square Feet 1,860 HOA Fees $875 / Mo Year Built 2007
18 Vandewater St
$1,448,000
Asking Price $1,448,000 Closing Price $1,475,000
SOLD
18 Vandewater St
Comparable property #7
Comparable property #8
San Francisco, CA 94133
506 Vallejo St
TRANSACTION INFORMATION
Original Listing Price
$1,195,000
Last Asking Price
$1,099,000
Closing Price -
PPSF -
Listed Date Feb 14, 2023
Contract Date May 17, 2023
Sold Date -
DOM - Days on Market 93
Bedrooms 3 Baths 2 Square FeetHOA Fees $250 / Mo Year Built -
CONTINGENT - NO SHOW
Comparable property #8


506 Vallejo St
Comparable property #9
San Francisco, CA 94133
733 Filbert St, Unit 6
TRANSACTION INFORMATION
Original Listing Price $1,149,000
Last Asking Price $1,149,000
Closing PricePPSF $951
Listed Date Apr 26, 2023
Contract Date May 05, 2023
Sold Date -
DOM - Days on Market 13
Bedrooms 2 Baths 2 Square Feet 1,208 HOA Fees $800 / Mo Year Built 1993
- NO SHOW
CONTINGENT
Comparable property #9
 733 Filbert St, Unit 6
Status
comparison May 19, 2023
Active listings
Pending listings
Sold listings
ADDRESS BEDS BATHS SQFT LOT ORIGINAL LISTING LAST ASKING CLOSING PPSF HOA FEES LISTED CONTRACT SOLD DOM 32 Prescott Court 2 2 - - $1,349,000 $1,349,000 - - $423 / Mo Mar 03, 2023 - - 77 4 Newell Street, Unit A 1 1 5 1,171 - $1,396,000 $1,396,000 - $1,192 - Feb 21, 2023 - - 69 2121 Mason Street, Unit A 1 1.5 1,171 - $1,450,000 $1,450,000 - $1,238 - Feb 04, 2023 - - 86 4 Newell Street 3 2.5 1,523 - $1,815,000 $1,815,000 - $1,192 - Feb 21, 2023 - - 69
ADDRESS BEDS BATHS SQFT LOT ORIGINAL LISTING LAST ASKING CLOSING PPSF HOA FEES LISTED CONTRACT SOLD DOM 506 Vallejo Street 3 2 - - $1,195,000 $1,099,000 - - $250 / Mo Feb 14, 2023 May 17, 2023 - 93 733 Filbert Street, Unit 6 2 2 1,208 - $1,149,000 $1,149,000 - $951 $800 / Mo Apr 26, 2023 May 05, 2023 - 13
ADDRESS BEDS BATHS SQFT LOT ORIGINAL LISTING LAST ASKING CLOSING PPSF HOA FEES LISTED CONTRACT SOLD DOM
Status comparison May 19, 2023
508 Vallejo Street 3 2 - - $1,099,000 $1,099,000 $1,075,000 - $250 / Mo Feb 17, 2023 Mar 26, 2023 Mar 27, 2023 37 520 Chestnut Street, Unit 201 2 2 1,343 - $1,250,000 $1,268,000 $1,250,000 $931 $899 / Mo Jan 20, 2023 Feb 22, 2023 Mar 22, 2023 33 18 Vandewater Street 3 3 1,860 - $1,448,000 $1,448,000 $1,475,000 $793 $875 / Mo Sep 22, 2022 Feb 06, 2023 Mar 06, 2023 137
Price
size May 19, 2023 ADDRESS STATUS BEDS BATHS SQFT PRICE $/SQFT DOM 2 4 Newell Street, Unit A ACTIVE 1 1 5 1171 $1,396,000 $1,192 69 3 2121 Mason Street, Unit A ACTIVE 1 1.5 1171 $1,450,000 $1,238 86 4 4 Newell Street ACTIVE 3 2.5 1523 $1,815,000 $1,192 69 6 520 Chestnut Street, Unit 201 SOLD 2 2 1343 $1,250,000 $931 33 7 18 Vandewater Street SOLD 3 3 1860 $1,475,000 $793 137 9 733 Filbert Street, Unit 6 PENDING 2 2 1208 $1,149,000 $951 13 2 3 4 6 7 9 1,092 1,263 1,434 1,605 1,776 1,947
Feet $1 08M $1.24M $1.4M $1.57M $173M $1.89M P r i c e
&
Square
May 19, 2023 ADDRESS STATUS BEDS BATHS SQFT PRICE $/SQFT DOM 1 32 Prescott Court ACTIVE 2 2 $1,349,000 77 2 4 Newell Street, Unit A ACTIVE 1 1.5 1171 $1,396,000 $1,192 69 3 2121 Mason Street, Unit A ACTIVE 1 1.5 1171 $1,450,000 $1,238 86 4 4 Newell Street ACTIVE 3 2.5 1523 $1,815,000 $1,192 69 5 508 Vallejo Street SOLD 3 2 $1,075,000 37 6 520 Chestnut Street, Unit 201 SOLD 2 2 1343 $1,250,000 $931 33 7 18 Vandewater Street SOLD 3 3 1860 $1,475,000 $793 137 8 506 Vallejo Street PENDING 3 2 $1,099,000 93 1 2 3 4 5 6 7 8 9 0 32 64 96 129 161 Days on Market $1M $1.18M $1.36M $1.54M $172M $1.9M P r i c e
Price & days on market
Price & days on market May 19, 2023 ADDRESS STATUS BEDS BATHS SQFT PRICE $/SQFT DOM 9 733 Filbert Street, Unit 6 PENDING 2 2 1208 $1,149,000 $951 13
Listing averages May 19, 2023 Bed 2.222 Bath 2.056 SqFt 1,379 Lot Size 0 SqFt Price $1,339,778 DOM 68 $/SqFt $1,050 Lowest $1,075,000 Average $1,339,778 Highest $1,815,000 ADDRESS STATUS BEDS BATHS SQFT PRICE $/SQFT DOM 1 32 Prescott Court ACTIVE 2 2 $1,349,000 77 2 4 Newell Street, Unit A ACTIVE 1 1.5 1171 $1,396,000 $1,192 69 3 2121 Mason Street, Unit A ACTIVE 1 1 5 1171 $1,450,000 $1,238 86 4 4 Newell Street ACTIVE 3 2.5 1523 $1,815,000 $1,192 69 5 508 Vallejo Street SOLD 3 2 $1,075,000 37 6 520 Chestnut Street, Unit 201 SOLD 2 2 1343 $1,250,000 $931 33 7 18 Vandewater Street SOLD 3 3 1860 $1,475,000 $793 137 8 506 Vallejo Street PENDING 3 2 $1,099,000 93 5 8 9 6 Median: $1,349,000 1 2 3 7 4
Listing averages May 19, 2023 ADDRESS STATUS BEDS BATHS SQFT PRICE $/SQFT DOM 9 733 Filbert Street, Unit 6 PENDING 2 2 1208 $1,149,000 $951 13
Price estimate for 218 Union Street $1,450,000 - $1,495,000
Sold listing average (3) $1,266,667 $1,186 Per Sq Ft 69 Days on Market
Pending listing average (2) $1,124,000 $1,861 Per Sq Ft 53 Days on Market
Active listing average (3) $1,553,667 $1,206 Per Sq Ft 75 Days on Market
* This represents an estimated sale price for this property It's not the same as opinion of value in appraisal developed by a licensed appraiser under the Uniform Standards of Professional Appraisal practice The information contained herein is derived from the local MLS and does not purport to be complete nor, necessarily, accurate and should be independently verified; nor does it represent or constitute a legal analysis or financial advice Changes in price, condition, sale, or withdrawal may be made without notice All measurements and square footage are approximate Equal Housing Opportunity Compass and its agents disclaim any and all liability for representations and warranties, express or implied, contained in, or for omissions from, the information contained herein or any other written or oral communication transmitted or made available to the recipient This is not intended to solicit property already listed Compass is a real estate broker licensed by the State of California operating under multiple entities License Numbers
May 19, 2023
Suggested listing price
01991628, 1527235,
1356742, 1443761,
1935359, 1961027, 1842987, 1869607, 1866771, 1527205, 1079009, 1272467
1527365,
1997075,
Strength in our numbers
Global exposure and recognition.
Our rapid growth has made Compass, “a household brand name for both home buyers and sellers.”² This recognition translates directly to your home, whether buying or selling.
Global reach and network.
As one of the only residential brokerages in the Fortune 500®, our unparalleled network of the nation’s top agents gives you the most valuable referral network in the industry.
Strength and stability.
You can be confident that you are supported by a brokerage with the collective insight of 28K agents, the scale of the #1 brokerage by sales volume, and the merit of the Fortune 500®.
*#1 2022 closed sales volume, T. Velt, “eXp Realty, Compass earn No. 1 spots in RealTrends 500 brokerage rankings,” RealTrends, Online, HW Media, 3/09/2023, https://www.realtrends.com/articles/realtrends-500-exp-realty-jumps-to-no-1-sides-compass-no-1-volume/
RANKED REALTRENDS
FORTUNE RESIDENTIAL BROKERAGE IN THE U.S¹ LISTED ON THE FORTUNE 500® 500
“What is stunning about this is that... Compass wasn’t even in business a decade ago.”
#1

A network of top real estate agents ready to bring you your buyer. $230B 2022GrossTransactionValue* 28K+ Agents** *Gross Transaction Value is the sum of all closing sale prices for homes transacted by agents on the Compass platform. We include the value of a single transaction twice when our agents serve both the home buyer and home seller in the transaction. This metric excludes rental transactions. **Agents are defined as all licensed agents on the Compass platform as of 6/2022. 71 Markets
Annual unique international users on compass.com** Everyone gets a first impression... Compass gets billions. 250M+ 1.4M+ 150B+ Annual website and social media impressions* 2021 PR Impressions*** Our digital footprint attracts potential buyers to your listing. Our website drives international buyers to homes like yours through curated presentation and artificial intelligence. Our in-house media team works with top publications to share compelling narratives about your home with target buyers.
Reach
Reach
Reach *Sourced via Sprout Social and Google Analytics, 1.1.2020–12.31.2020. **Sourced via Google Analytics, 1.1.2020–12.31.2020. ***Sourced via Meltwater, 1.1.2021–12.31.2021.
Digital
International
Media
Placing your property where your buyers are searching.
Once your home is listed, it will automatically be syndicated to some of the top real estate platforms domestically and in 60+ countries globally. This will allow us to get maximum exposure for your home.
Top Domestic Syndication Platforms, Including
Zillow The Wall Street Journal Mansion Global Nextdoor
Trulia San Francisco Chronicle Realtor.com Juwai.com
International Syndication*
Argentina
Australia
Belgium
Bulgaria
Cambodia
Canada
Chile
China
Colombia
Czechia
Denmark
Estonia
Fiji
France
French Polynesia
Germany
Greece
Hong Kong
India
Indonesia
Ireland
Italy
Japan
Kazakhstan
Laos
Latvia
Luxembourg
Macau
Malaysia
Mexico
Monaco
Morocco
Myanmar
Netherlands
New Caledonia
Panama
Papua New Guinea
Peru
Philippines
Poland
Portugal
Qatar
Romania
Senegal
Serbia
Singapore
Slovakia
South Africa
Spain
Switzerland
Tanzania
Thailand
Tunisia
Turkey
United Arab Emirates
United Kingdom
United States
Uruguay
Venezuela
Vietnam
*ListGlobally opt-in required. Data based on the reach of ListGlobally’s network.
Sharing Your Home Globally
Instantaneously reach millions of potential international buyers on a vast network of trusted sites.
307M+ Annual international buyers reached*
50+ 96+
Countries your home syndicates to*
International portals your home syndicates to*
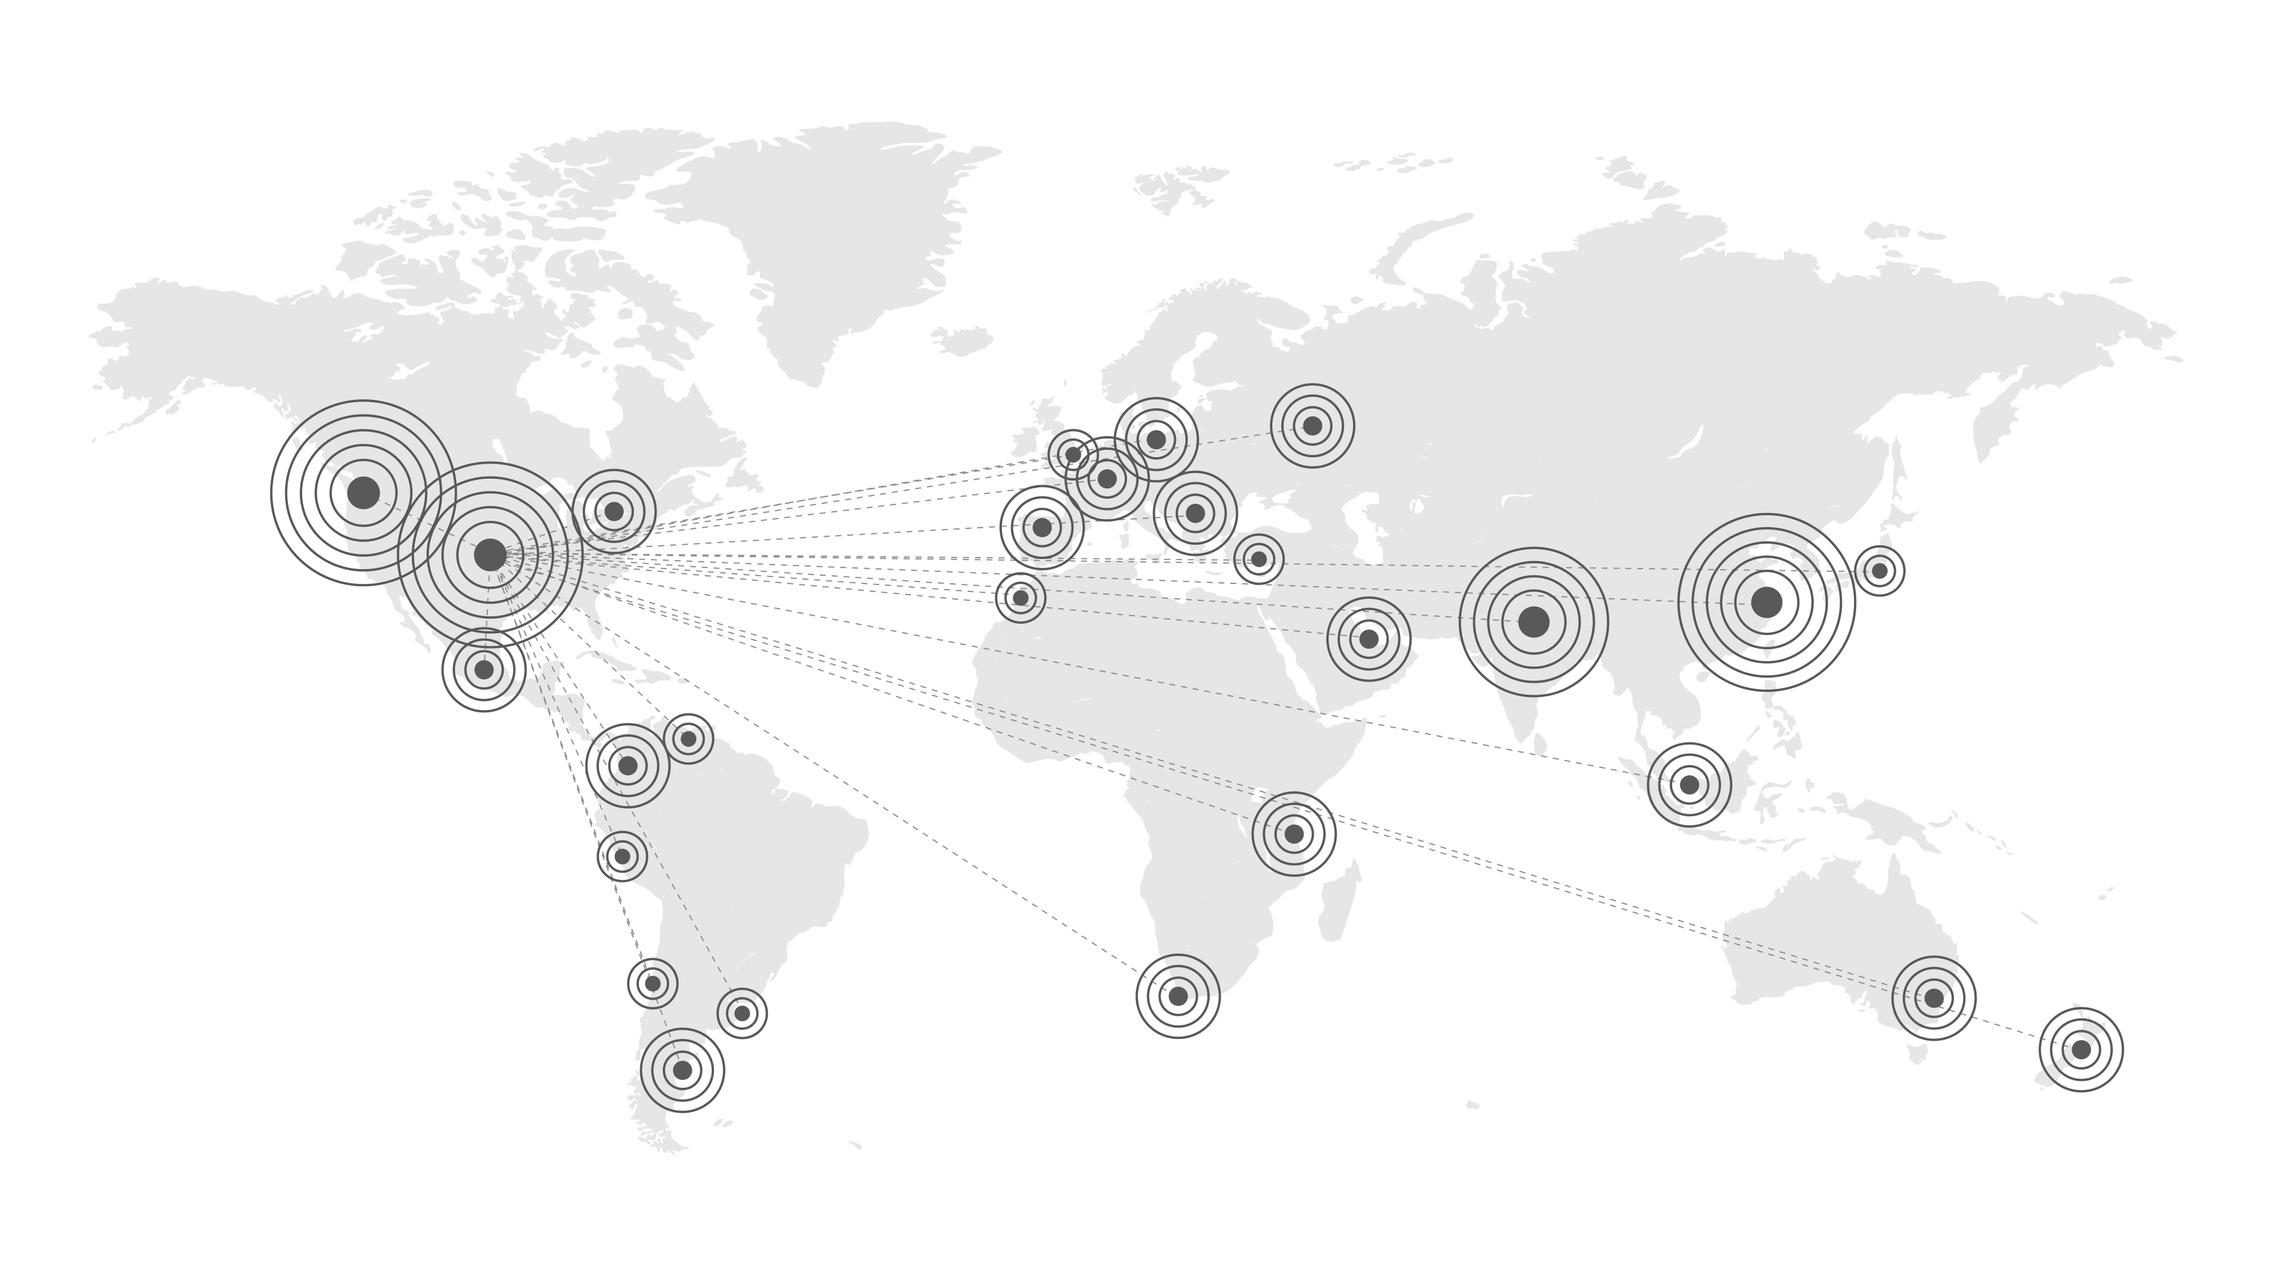
*ListGlobally opt-in required. Data based on the reach of ListGlobally’s international and luxury networks.
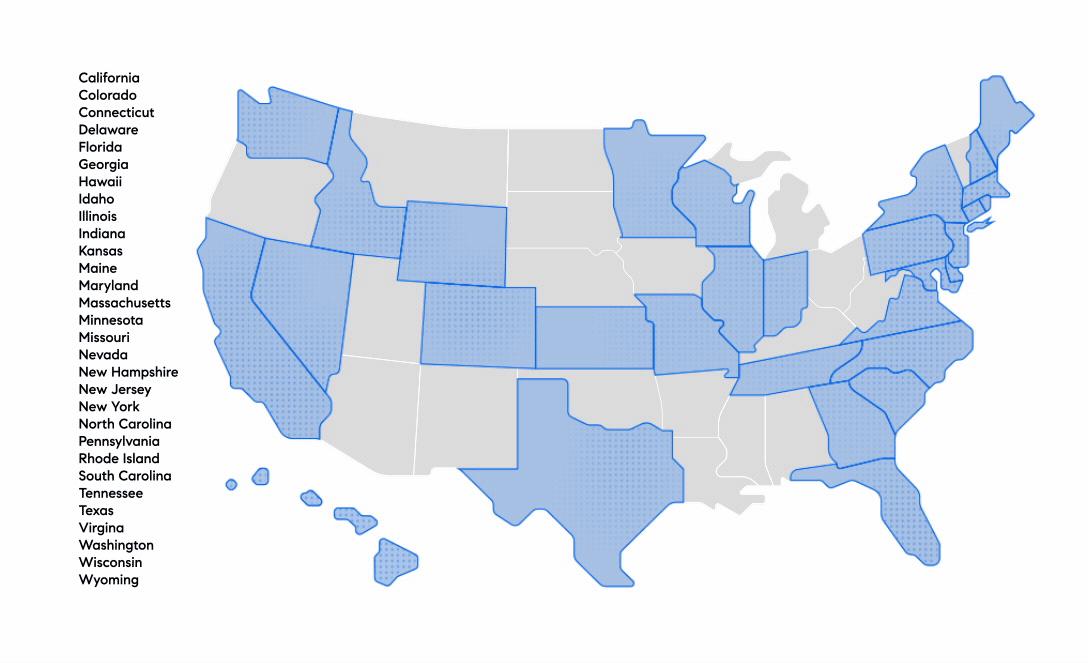
Captivating California
Within 5 years of our arrival in the Golden State, Compass has become one of the top brokerages in the region.
Markets We Excel In
Lake Tahoe
Wine Country
San Francisco Bay Area
Silicon Valley

Carmel/Monterey
Central Coast
Santa Barbara/Montecito
Los Angeles
Orange County
Palm Springs
San Diego
#1 $43.4B+ Sales volume since inception
Brokerage in LA and SF by Sales Volume
6.6K+ 140+
Offices with over 500 employees
Number of agents LA Business Journal, Ranked #1 By 2019 Sales Volume. | SF Business Times, Ranked #1 By 2019 Sales Volume.
sales volume in the Bay Area in 2022. Sotheby’s* 4.7% Keller Williams* 6.7% Coldwell Banker* 9.4% Compass* 19.9% 2022 Top 4 Brokerages Percentage Market Share *2022 transaction-side residential sales reported to Bay Area MLS Associations by 12/15/22, per Broker Metrics. Based on top 1000 ranked offices/brokerages. Analysis made in good faith with the data available. Not all sales are reported to MLS. Rounded to the nearest tenth of a percent.
Outperforming the competition in the Bay Area. $35B+
2022 Top 4 Brokerages Percentage Market Share | San Francisco
*2022 transaction-side, dollar-volume residential and 2-4 unit sales reported to NorCal MLS Alliance by 12/15/22, per Broker Metrics. Analysis made in good faith. Not all sales are reported to MLS. By brokerage/brand Compass* 36.5%
Outperforming the competition in San Francisco.
11.7% DeLeon** 7.4% Sotheby’s** 11.8% Side, Inc.**
Discover the pinnacle of luxury real estate.
Prestigious. Exclusive. Emboldened.
Our clients continue to choose Compass as the market leader for luxury homes in Northern California.
+95.3% National sales volume since the pandemic*
$215.2M Total $10M+ San Francisco sales volume, 2022*
15
$10M+ Sales in San Francisco in 2022*
**2022 transaction-side, dollar-volume residential property sales reported to Bay Area MLS Association by 12/15/22, per Broker Metrics. Analysis made in good faith with data available. Not all sales are reported to MLS. Rounded to the nearest tenth of a percentage. By brokerage/brand.
Percentage
($5M+ Homes) Compass** 10.3% Intero** 3.5% Coldwell Banker** 13.4% Sotheby’s** 30.9%
2022 Top 4 Brokerages
Luxury Market Share
No one knows luxury better than Compass.
Elevate all aspects of your elite property through enhanced aesthetics, emboldened exposure, and an unparalleled network of top brokers.
luxuryatcompass.com
Stay on top of the market and keep your clients informed with monthly dedicated emails and quartlery reports highlighting key properties and trends.
Wealth Mapping
Identify and plan strategic outreach through our partnership with Wealth-X.
Curated Magazine
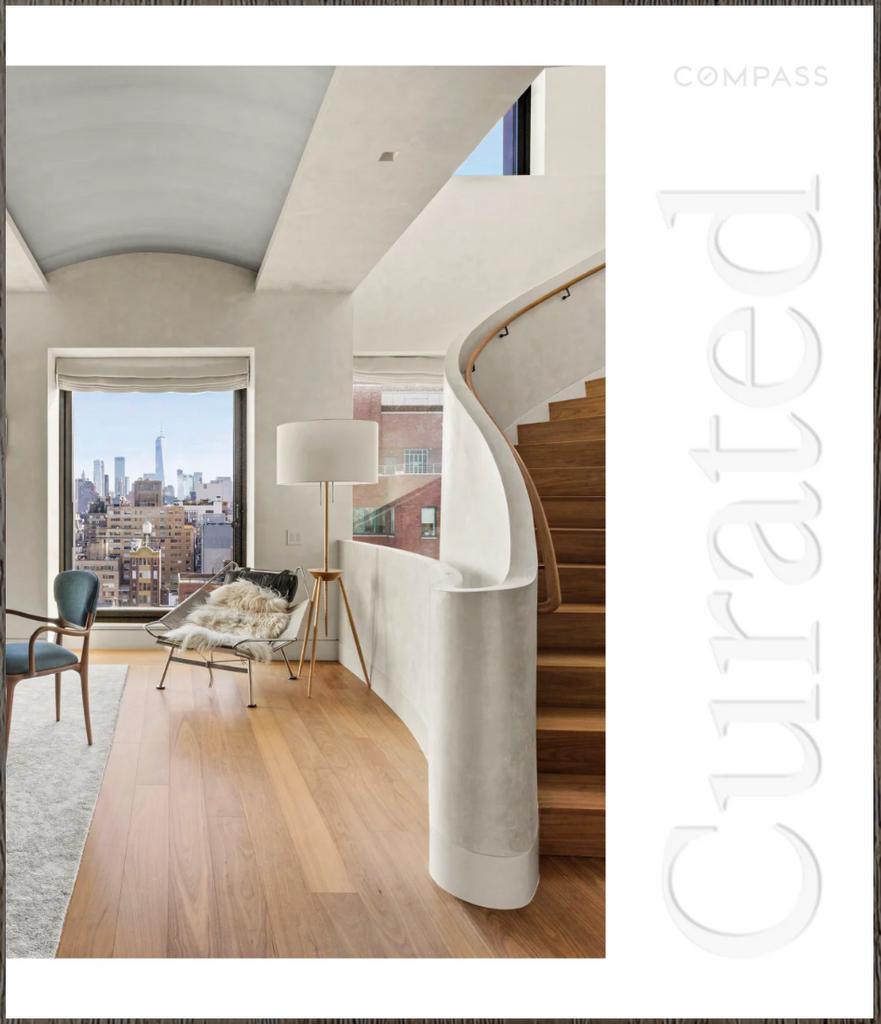

Distributed globally, this specialized periodical is the essence of Compass
Luxury and features our most prestigious properties throughout the country.

Our Success in the Bay Area.

Amazing partners *2022 transaction-side residential sales reported to Bay Area MLS Associations by 12/15/22, per Broker Metrics.
compass.com/diversity-inclusion

LET'S TAKE A LOOK AT OUR PLAN TO SELL YOUR HOME

Pre-Market
Home Preparation
Photography
Pricing
Pre-List Marketing
Leveraging Our Exclusive Agent Network

On-Market
Media Plan
Open Houses
Assessing Our Strategy and Monitoring the Market
Our Step-by-Step Plan
What to Expect
As your trusted advisor, I’ll be there to guide you throughout the home selling process to ensure that your experience is as seamless and stress-free as possible.
1 Complete listing paperwork
2 Prepare your property for market
3 Pre-market and promote your property to Compass agents*
4
Develop and execute our marketing strategy and media plan
5 6 7 8 List property online Show property and follow-up with leads
Monitor the market, provide updates and assess strategy
Review offers and negotiate the optimal contract
Close on the property and assist with post-closing questions
9 10 Schedule closing and work through contract terms PRE-MARKET ON-MARKET CLOSING *Pre-marketing strategies are independently determined by clients at their direction.
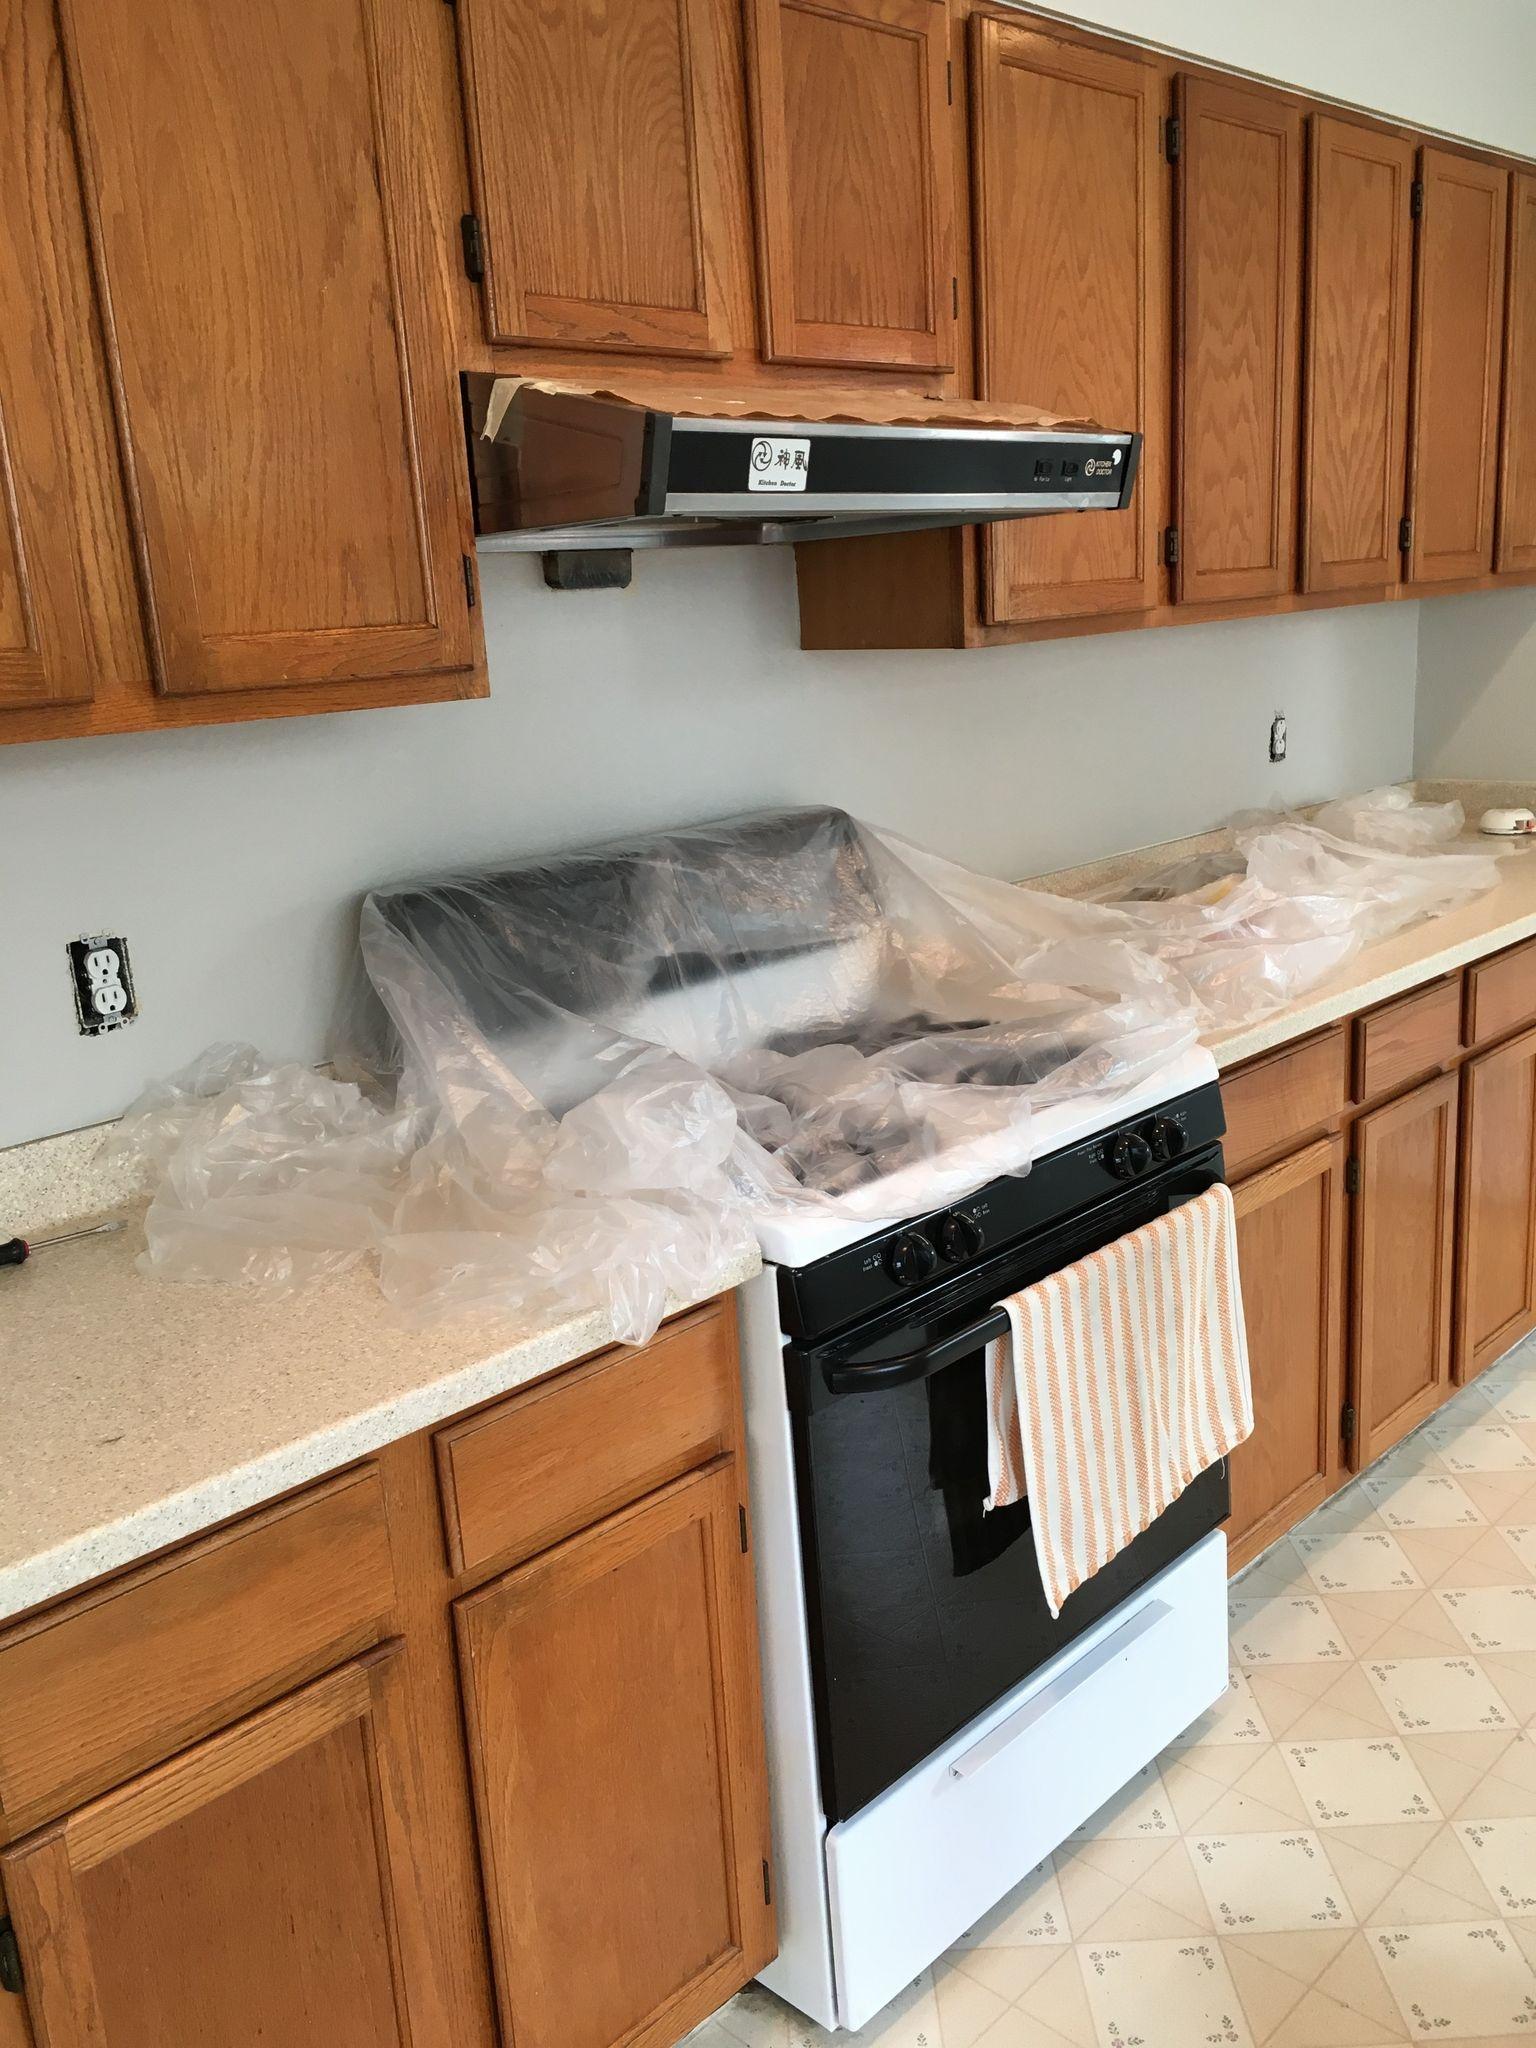
Getting Your Home Ready to Sell

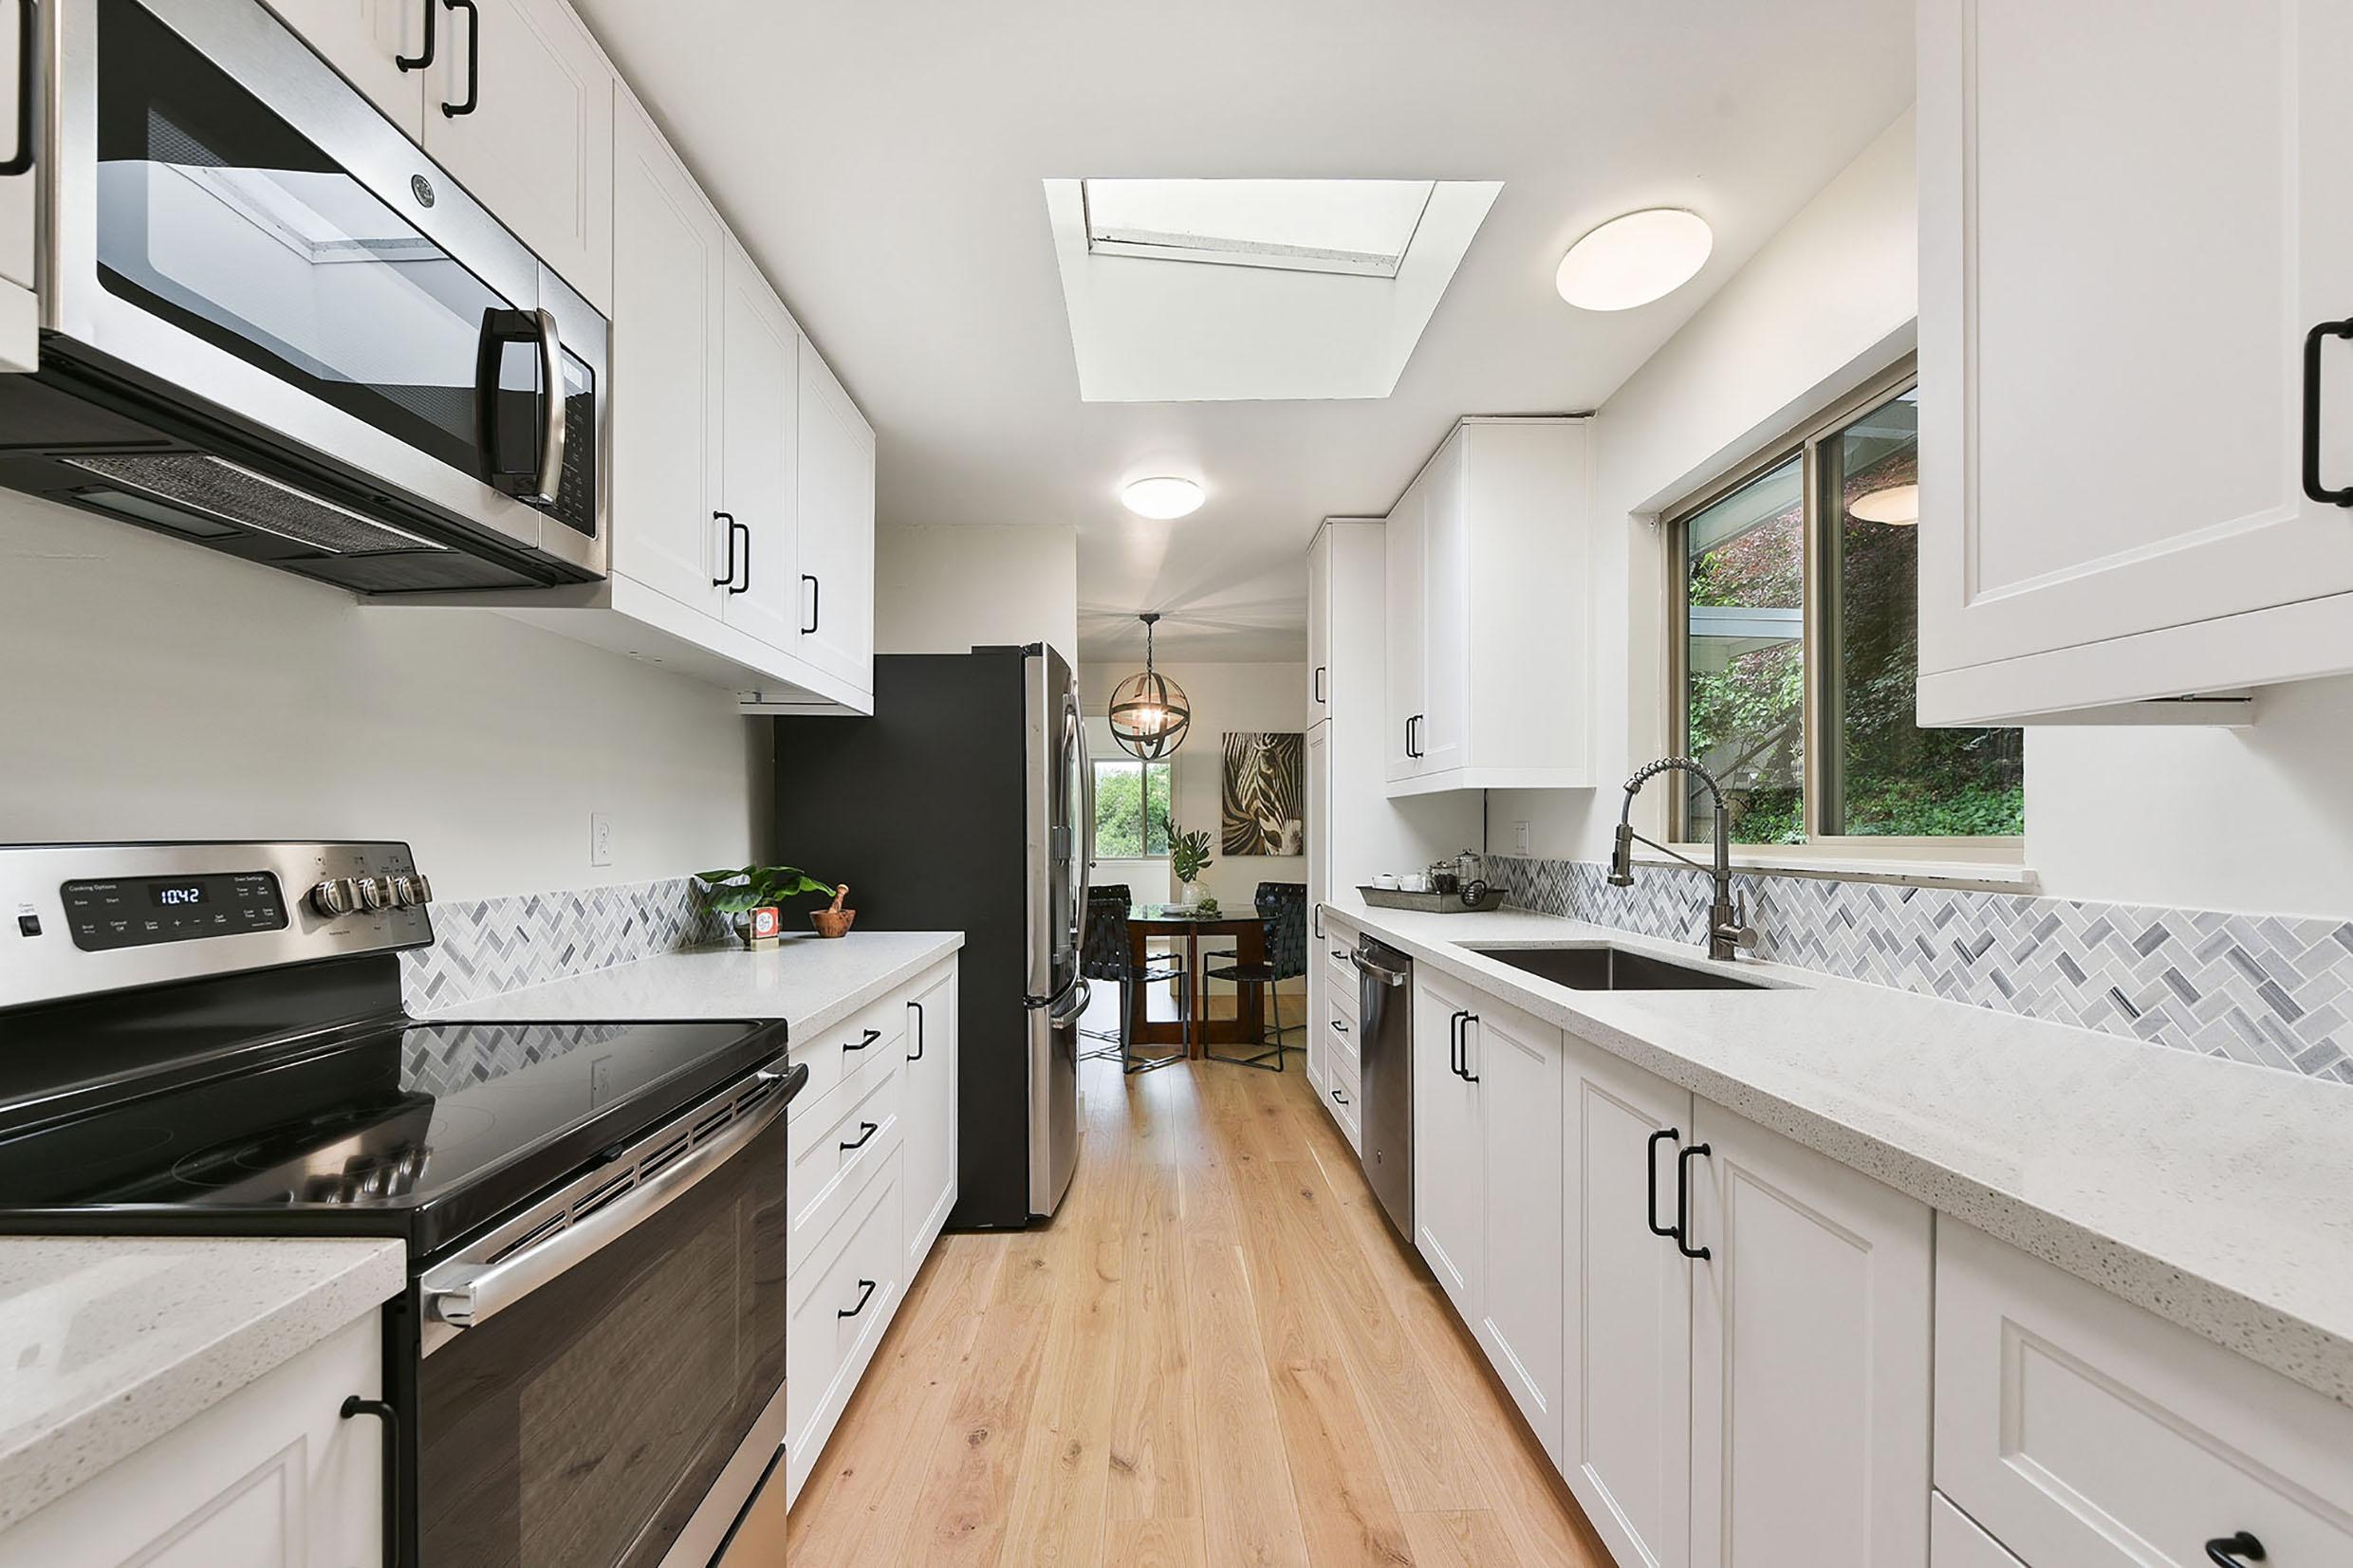
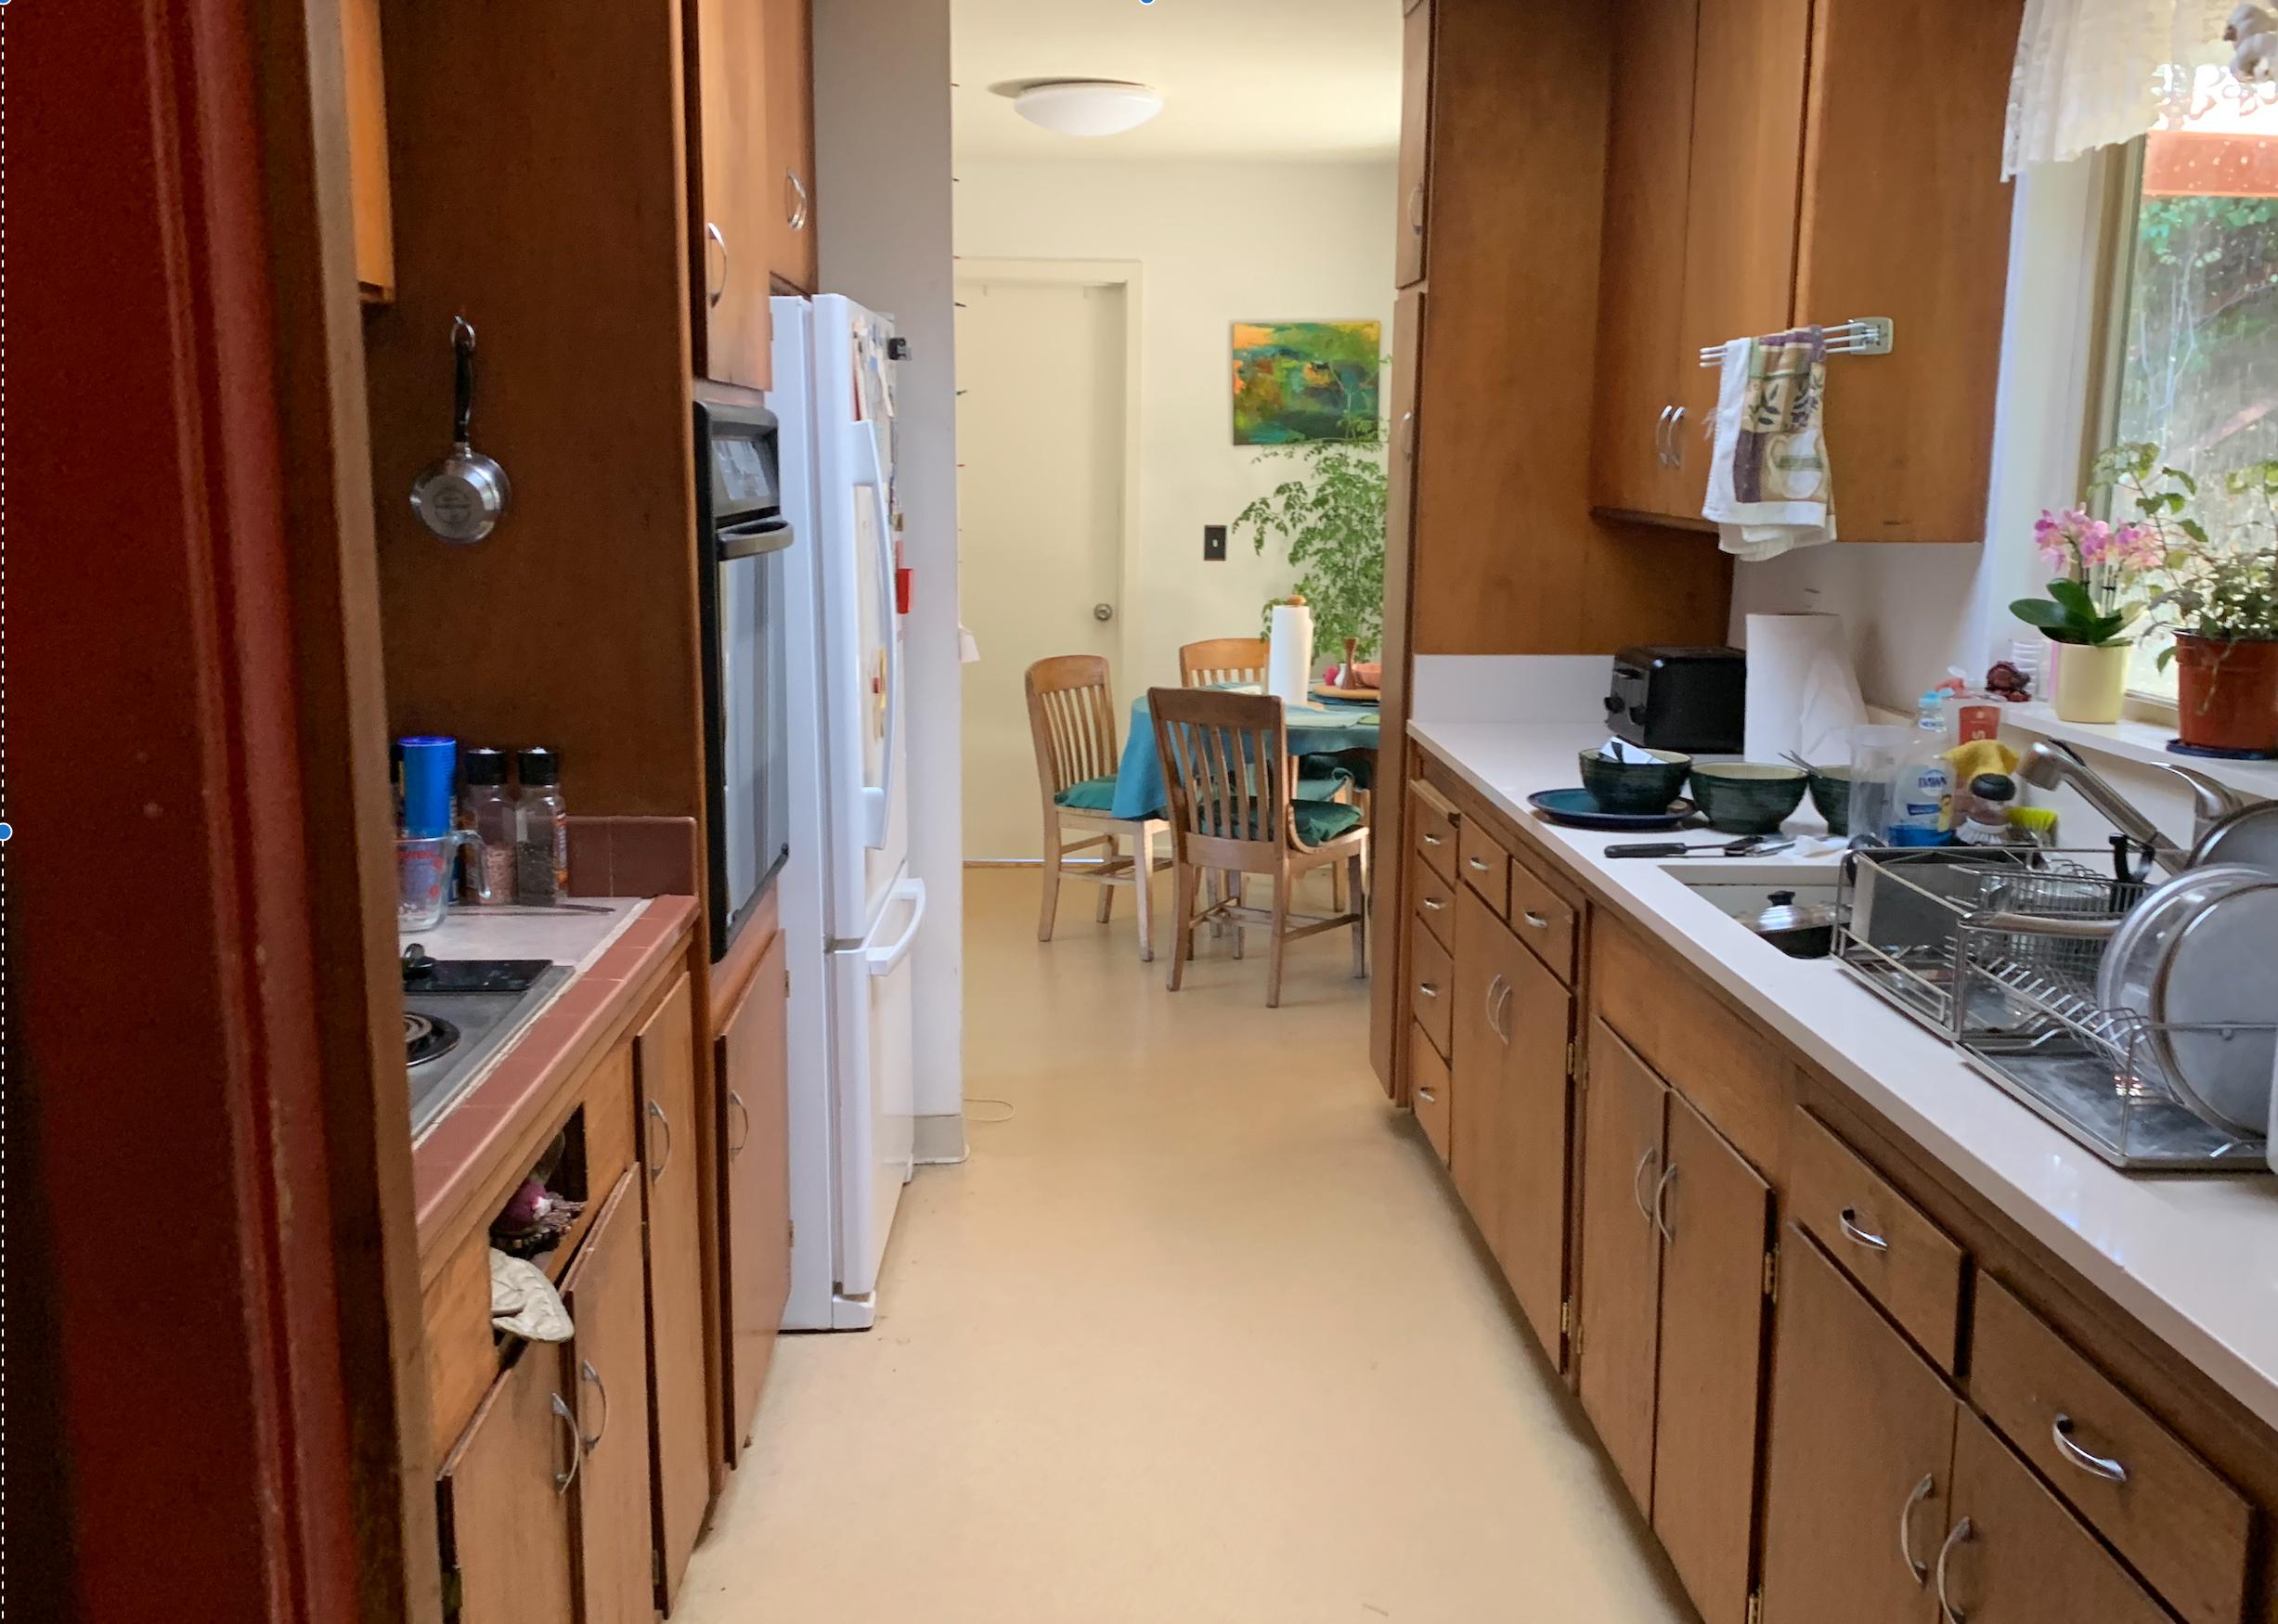
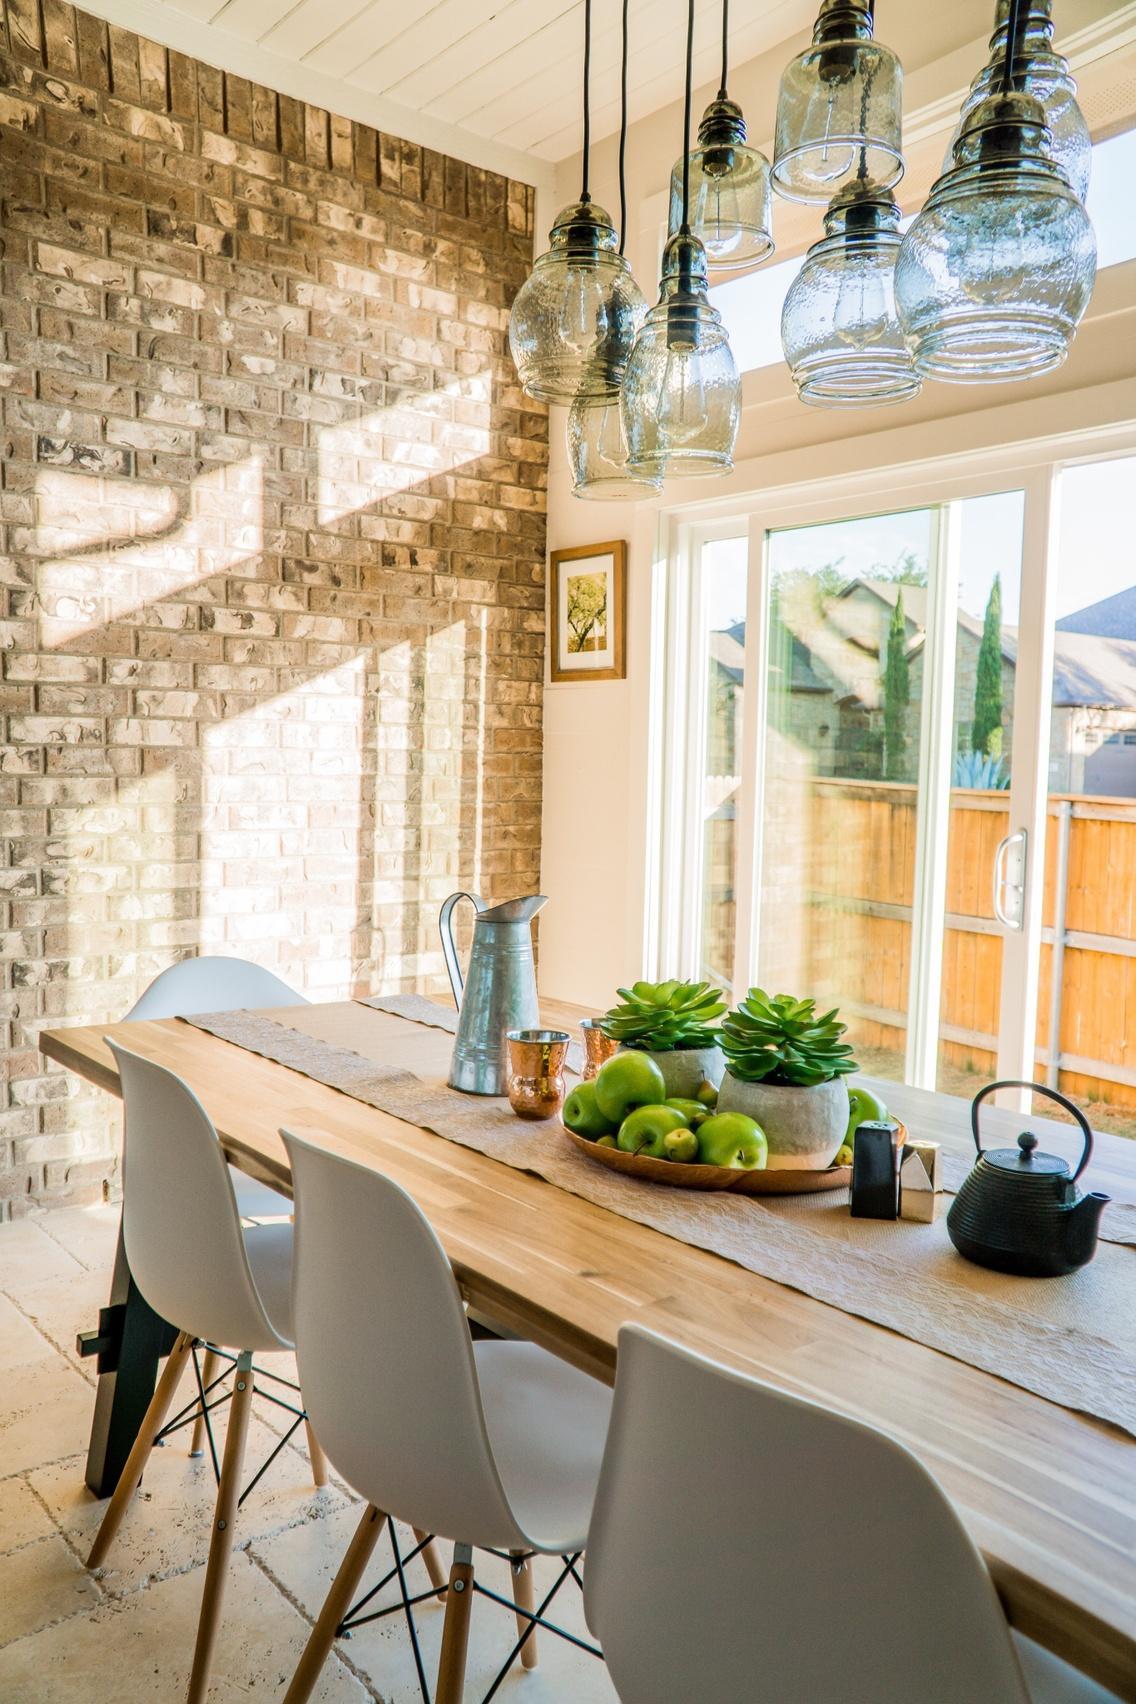
Your home only has one chance to make a great first impression and we are here to guide you every step of the way. Together, we can focus on identifying and making improvements that will enhance the marketability of your home and stage it to appeal to potential buyers. Data from the latest Cost vs. Value report from Remodeling magazine and the National Association of Realtors® estimates a: 71% 118% Return on investment for minor kitchen upgrades* Return on investment for new wood floors** BEFORE BEFORE AFTER | NEW WOOD FLOORING *2022 Cost vs. Value Report, Remodeling Magazine (remodeling.hw.net/cost-vs-value/2022) **2022 Modeling Impact Report, National Association of Realtors (cdn.nar.realtor/sites/default/files/documents/2022-remodeling-impact-report-04-19-2022.pdf)
Compass Concierge is the hassle-free way to help sell your home faster and for a higher price.

From staging to renovation, we can leverage our exclusive Concierge program to prepare your home for the market with zero upfront costs or interest. By investing in your home’s potential, we aim to provide a swifter, more profitable sale.
How it Works
1. Determine a budget and updates together, then apply for Concierge funds
2. Immediately receive your Concierge Card or request cash
3. Work with trusted vendors to complete homes improvements
Sellers who use Compass Concierge are nearly twice as likely to sell their home in 60 days (compared to the average MLS listing in Compass markets)**
2x Apply at concierge.notablefi.com/apply/start
4. Repay at closing, delisting, or 12 months after approval.* Rules & Exclusions apply. Compass offers no guarantee or warranty of results. Subject to additional terms and conditions. Concierge Capital loans are provided by Notable Finance, LLC, NMLS# 1824748 and are made or arranged pursuant to a California Finance Lenders Law license. Loan eligibility is not guaranteed and all loans are subject to credit approval and underwriting by Notable. Compass is not a lender and is not providing loans as part of the Compass Concierge program. *Homes up to $5M may be eligible in certain areas via Concierge Classic. **Data is sourced from certain regional MLSs and has been aggregated to create an approximated national data set for purposes of providing estimates set forth above.
Compass Concierge at Work
A Concierge Case Study
14 4x Day on market Return on $40K Concierge funds
"The Concierge program is a game changer! It was the support we needed to move forward with our decision to sell our home and not take on any upfront costs."
BEFORE
AFTER
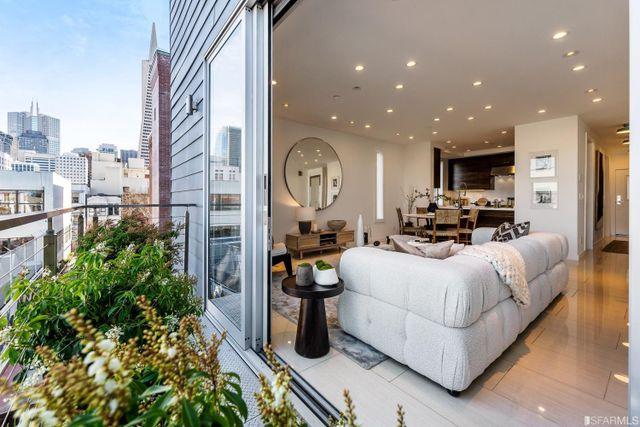
The Power of Photography
Beautiful photography is one of the most powerful tools for selling your home. Compass uses bestin-class photographers to show your home in its best light, make a positive first impression, and attract more buyers.
Pricing Your Property to Maximize Buyer Activity
Timing of Buyer Activity

A property receives the most traffic within the first few weeks of hitting the market. It is important to get the price right in order to gain the attention of interested buyers and maximize your home's position in the market.
Attracting Buyers Using Competitive Pricing
Using competitive analysis, market research, and Compass’ suite of AI-powered tools, we recommend a price for your property to generate the most activity and offers early on before buyers move on to newer listings.
If the asking price is too high, then the property appeals to fewer buyers.
0 1 2 3 4 5 6 7 Number of Weeks Activity PeakActivity
5% 10% 15% 20% 30%
0%
50% 95% Percentage Over Market Value Percentage of Buyers
Graphics are for informational purposes only. Compass does not guarantee or warrant similar results.
Our Exclusive Pre-Marketing Advantage
Private Exclusive Coming Soon
A Private Exclusive listing is an off-market home that can be shared by a Compass agent with their Compass colleagues directly. Property details aren’t disseminated and won’t appear on public home search websites. Listing your home as a Private Exclusive allows you to control what information is shared while still getting exposure to top agents at Compass.

Compass Coming Soon gives us valuable
to
—
accruing days on market. 2-3x 7% ~19% More
and
Fewer days on market vs.
that
to active** More traffic at an open house*** Data refers to a comparison between MLS and Compass Coming Soon listings vs. listings that go straight to active. *Viewership sourced via Compass.com 1/2020–8/2020. **Days on market sourced via Compass.com 1/2020–7/2020. ***Open house traffic sourced via Compass.com 1/2020–9/2020. Compass Coming Soon and Private Exclusives are subject to local MLS restrictions and not available in all markets. Local policy definitions may restrict how Private Exclusive listings can be shared between agents, even within the same brokerage. Where the programs are available, pre-marketing and listing strategies are independently determined by the client. Compass does not recommend one particular strategy or guarantee results. compass.com/coming-soon compass.com/private-exclusives
opportunities
market your property while building anticipation among potential buyers and pressure-testing our pricing strategy
all without
views by consumers
agents*
listings
go straight
Reach more prospective buyers with intelligent digital advertising.
By leveraging Compass’ digital advertising tools and partnerships across social media and advertising throughout your listing process, we can generate demand to sell your home faster, and we meet potential buyers where they are, online.
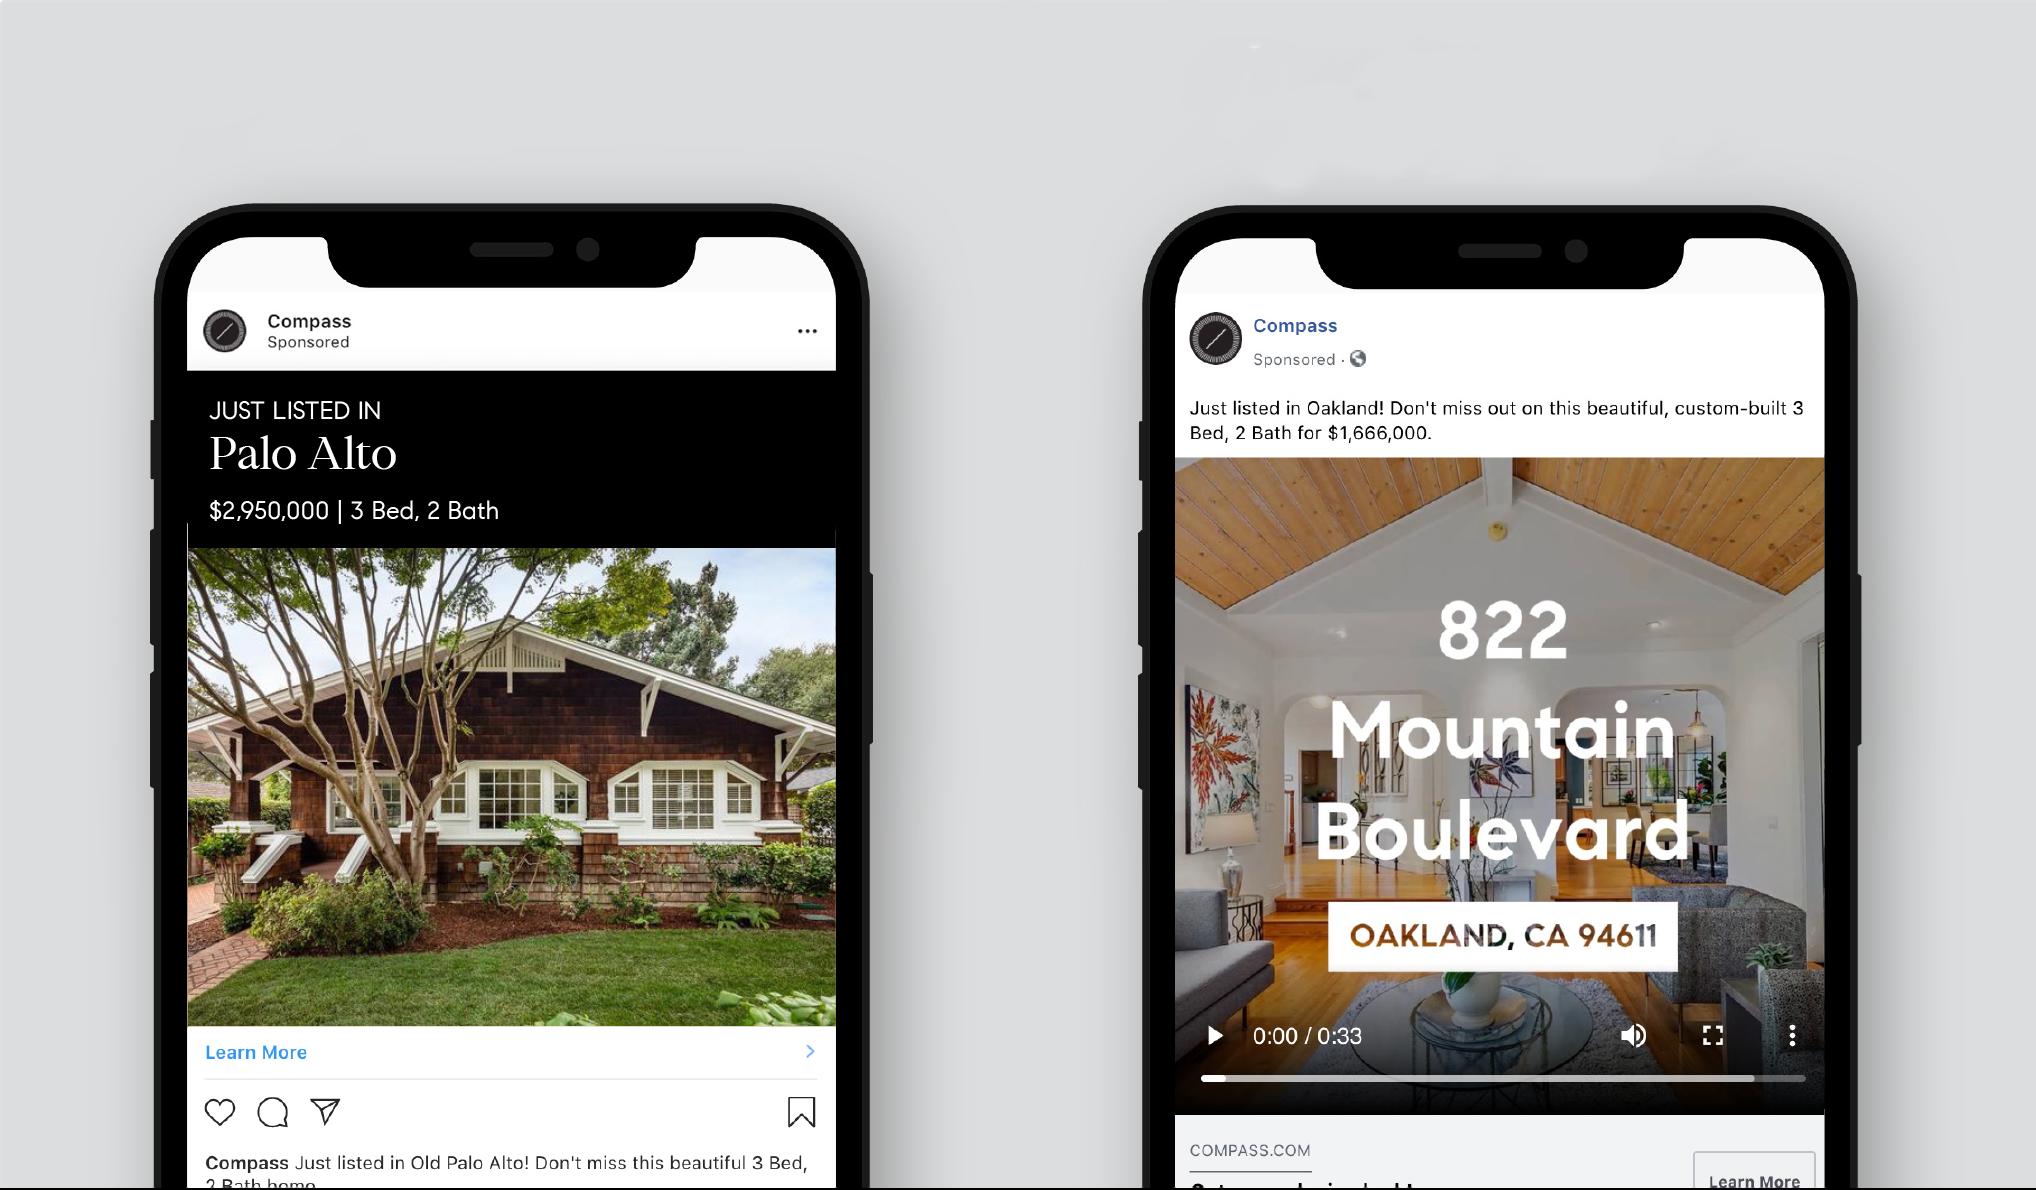
Proprietary Targeting Optimized Performance
Compass helps generate buyer interest by using proprietary data to serve ads to Facebook and Instagram users.
Compass tracks and measures the results of every campaign which allows for continued optimization.
INSTAGRAM IMAGE AD
FACEBOOK VIDEO AD

Our Powerful Voice in the Press #1 National media coverage compared to top brokerages** 2021 PR impressions* 15B+ *Sourced via Meltwater, 1.1.2021–12.31.2021. **Sourced via Meltwater, 1.1.2021–12.31.2021, compared to Coldwell Banker, Keller Williams and Douglas Elliman.


homebuyers attend an open house while searching for a
open houses have been virtual since the launch of our virtual open house tool** *Zillow Group Consumer Housing Trends Report, 2022 survey data **Compass Livestream: Virtual Open House vs In-Person Open House. 6.1.2020–8.31.2020.
Of
Of
No one does virtual marketing like us.
We have unparalleled technology to market the sale of your home virtually through evolving times. Using dynamic, guided video, we showcase the key features of your property to our target clientele, wherever they are.
Private Interactive

Home Tour
We’ll take buyers on a virtual journey through your home to highlight the unique features. Our interested buyers can easily provide direct feedback through live video or text.

Virtual Neighborhood Tour
Our buyers and their loved ones can explore all that the surrounding community has to offer with snapshots of key attributes of the neighborhood.
Digital Listing Brochure
Pages will turn, videos will play, and home features will come to life with interactive brochures to create an immersive experience for even the most discerning of buyers.
Video Mail


More opens lead to more closings. We embed live video into our email marketing to engage clients in a modern and compelling way.
Live Postcard
We utilize animated emails to showcase the most attractive elements of your property. This helps grab the attention of buyers at every stage of their home search.
Digital Marketing & Insights

We’ll run and actively optimize Facebook and Instagram ad campaigns to promote your property to high intent buyers.
Enhanced 3D Staging

We’ve partnered with the nation’s leading virtual staging firm to provide touch-free staging in order to show your home in its best light virtually.
YOUR HEALTH AND SAFETY IS OUR #1 PRIORITY.
Virtual Open House
Assessing Our Strategy and Monitoring the Market
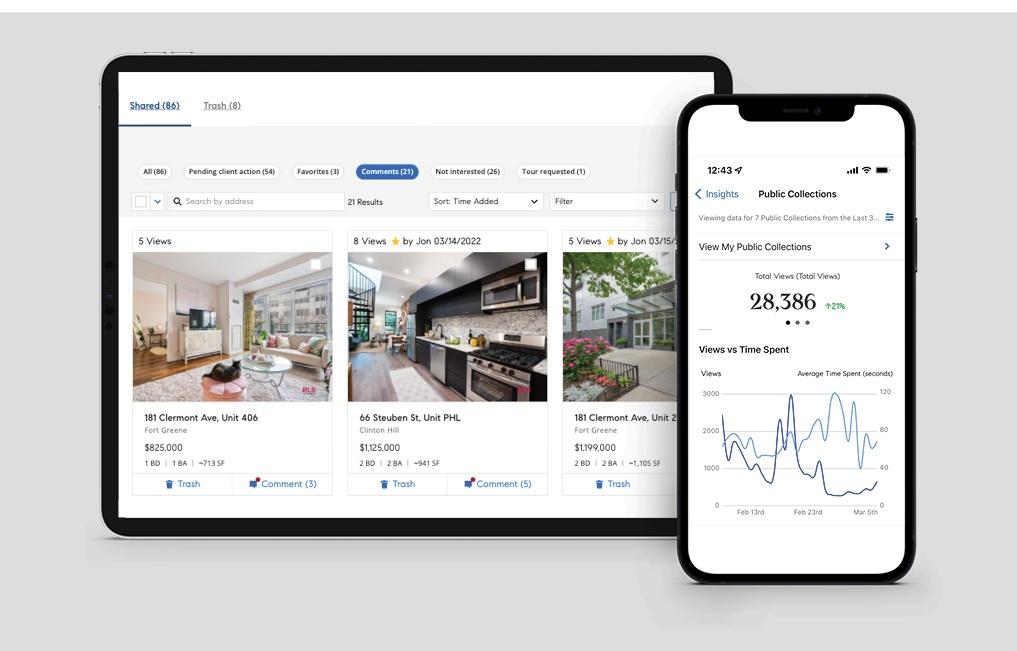
Using proprietary tools such as Collections and Insights, we keep you informed of market conditions and traffic to your property.
COLLECTIONS INSIGHTS
Insights Collections
Collections allows us to have a collaborative conversation on your home selling process with instant updates on comparable listings and access to insider knowledge previously only available to the agent community.
Insights is a detailed, custom dashboard that allows us to assess the impact of our online marketing campaigns in real time. By capturing this data, we are able to further target our ads to buyers most interested in your home.
Your Buyer Follows Compass #1 Real estate website in 2019 + 2020, Webby Awards People’s Voice Winner* Monthly Website Visitors 420K 481K 1.2M 5.0M 16.3M The Agency* Engel & Volkers** Corcoran** Coldwell Banker** Keller Williams** *The Webby Awards 2019 (winners.webbyawards.com/2019/websites/general-websites/real-estate/81277/compass). 2020 (winners.webbyawards.com/2020/websites/general-websites/real-estate/81277/compass). **Website traffic sourced via SimilarWeb, 02.1.2023–02.28.2023. 4.8M Compass** 5.5M Sotheby’s**
A Custom Marketing Plan For
Your Home.
We’ll craft a marketing plan with strategies and tactics specific to your home, designed to garner maximum exposure.
1 2 3
Targeted buyer audience analysis and marketing tactics.
Content Strategy that pairs custom narrative storytelling with impactful visuals. A multi-phased launch plan that markets your home like a blockbuster movie.
4 5
Exclusive Compass programs and offerings that will optimize your sale experience.
An outline of key milestones you can expect as we bring your home to market.

Joske Thompson Global Real Estate Advisor, CIPS, FIABCI | DRE 00843865 joske@joske.org 4156082233 Joske.org