
30 APRIL 2022 0 Low Carbon ServicesBuilding Jolie Bassem Fekry Farid STUDENT ID : 19006111 MODULE CODE: UBLMN7 30 3 YEAR MODULE RUN : 2021 2022 COMPONENT B- ENERGY SYSTEMSREPORT
Energy
Systems Report : Section A .....................................................................................................2
Energy
Modelling Report Section A ..................................................................................................14 Energy Modelling Report Section B ..................................................................................................18 References ......................................................................................................................................27
Table of Contents
30 APRIL 2022 PAGE 1
Systems Report: Section B ....................................................................................................11
Energy
30 APRIL 2022 PAGE 2
Section A: Energy Systems Report
A 1) Low Carbon Heating System
M Shed is predominantly heated using a biomass boiler. They operate, using wooden pellets, which are stored in the hopper, then fed into a combustion chamber and burnt using fuel. When combustion takes place, automated grate movement occurs, ensuring fuel is evenly spread maximizing reaction efficiency. The automated grate movement removes the ash residue into an ash box. Any resulting flue gases are released into the atmosphere (CIBSE,2013). Hot air and gas, produced during the reaction are passed through a heat exchanger and heats the water. Any surplus heat produced is, stored in an accumulator, for later usage (The Renewable Energy Hub, 2018). Low loss header ensures the flow rate of hot water is constant into the building is constant, finally the hot water is circulated throughout the building. In case biomass boilers are faulty, gas boilers also located in the plant room are there for backup.
Air source heat pump, another heating system used in M Shed and installed on the roof. Air to air and air to water are two types of heat pumps, both operate differently.
illustrated in Figure 2, operate using an outdoor unit that extracts heat from external air and transfers it into a coolant. A compressor then increases the
Air to air source heat pumps, illustrated in Figure 1, the outdoor unit absorbs heat from external air and passes over a heat exchanger coil. Heat then turns to cold coolant slightly changing its state into a warm vapour which passes through a compressor converting it into a denser vapour by increasing its temperature. Finally, the hot coolant vapour produced is passed over an indoor unit, to heat the building, via internal pipework. After heat is transferred, the coolant changes its state turning back into liquid. An expansion valve ensures all the heat is extracted from the coolant turning into a liquid vapour. Finally passed the outdoor unit to be Areheated.(Greenmatch,2021a).irtowatersourceheatpump,
temperature of the coolant which heats the accumulator through a heat exchanger, finally, hot cool the
Figure 2 Air to Water Heat Pump and Heating System @ M Shed


30 APRIL 2022 PAGE 3
Figure 1 Air to Air Heat Pump and Heating System @ M Shed
Figure 4 Air to Water Heat Pump working mechanism

Legend:
5 Plant
30 APRIL 2022 PAGE 4 Biomass Boiler Chip PanelMechanicalPumpsGasSparePulpressBufferAccumulatorSchematicsStoreVesselUnitGasBoilerBoilersControl
Figure Room Layout


There are a few operational challenges associated with equipment in the plant room. As mentioned previously, biomass boilers solely depend on wooden pellets, staff have to be physically on site to supply more wooden pellets into the chip store In addition to this, moisture present in wooden pellets, impact the biomass boilers, causing a slower response in producing hot water. Furthermore, the biomass boilers generate hot water all day, although no occupants, which reduces the biomass boilers efficiency. A few environmental challenges, biomass boilers undergo combustion to burn the wooden pellets, during this process, a mixture of harmful gases are produced and are collectively known as NOx stated Palmer et al. (2014), which impacts the environment negatively. Furthermore, wooden pellets need to be procured considerately, to ensure the process is sustainable. Finally whilst delivering wooden pellets to M Shed, there are CO2 emissions released.
The Estate Team have undertaken measures to ensure good system efficiencies and plant longevity. A measure taken is, valve jackets around valves, these act as an insulating material to prevent heat loss. The valves differ in shape and diameter, inducing heat loss. If the valves weren’t insulated the boilers will have to work harder to ensure hot water is at the right temperature before getting into the building. The pumps are in sets of two, in case a pump goes faulty, the “backup” pump will ensure there is no delay in the overall process, which increases system efficiency. Furthermore, a mechanical control panel located in the plant room controls the building’s mechanical equipment. BMS improves efficiency by monitoring equipment and ensures they are working at their optimal rate (GOS Heating, 2022). In case any equipment requires maintenance, this can be done through the BMS system.
Figure 3 Air to Air Heat Pump Mechanism
30 APRIL 2022 PAGE 5
The plant room is accessible from, back of the building; therefore implies, the ease of supplying materials such as wooden pellets and heavy equipment. It is located on a quiet road, which suggests, if a vehicle is unloading heavy equipment it does not block traffic. Furthermore, it can also be accessed via large double doors (illustrated in figure 5), allowing staff to move equipment easily in and out the plant room The space is an open plan; thus, moving the equipment around the plant room can be done easily.
A 2) Solar PV System
Legend1.River2.Road3.Terrace4.SolarPV5.AirSource Heat Pumps 6. PV mechanical equipment 7. Plant Room Figure 6
Below in figure 6, are the components that make up the PV array, which is located on M Shed’s roof. The smallest component, a cell connected in series making a module A group of modules make up a panel, a series of panels connected via a string make up the solar PV array. Electricity runs around the system and passes through a direct current isolator. The inverter converts direct current into alternating current, the purpose of this conversion is to allow it to be used by the building (Holden, 2014). Alternating current is passed through an alternating current isolator located on either side of the generation meter, subsequently into a consumer unit, which allows the electricity to be used throughout the building. Finally, a utility meter keeps track of how much electricity is consumed, and how much electricity is going back to the grid (Jeddere Fisher,2021) I am assuming the solar PV panels, don’t have batteries since M Shed requires more energy than what is produced by the array. Kilowatt peak (kWp) is a common unit used, representing the maximum output of electricity, a solar panel can produce (Holden, 2014). Solar PV System on Site
30 APRIL 2022 PAGE 6

9.
Figure 7 How Solar PV’s work

30 APRIL 2022 PAGE 7
• HVAC cooling, heating systems (most of these are in the plant String 2 Direct Current Isolator Inverter Alternating Current Isolator Generation Meter Alternating Current Isolator Consumer Unit Utility Meter
room) • Lifts • Equipment to provide hot and cold water (water pumps) • Lighting • Small Power electricity equipment plugged into sockets and permanently connected to sockets 1.LegendString 1 2.
and
3.
system ventilation,
5.
Electricity in M Shed is inputted by both solar PV array systems and the grid. The proportion we get from solar PV’s differs depending on multiple factors. The solar PV system is dependent on the weather forecast, and season. In addition, for example, during winter there is a higher electrical load for lighting due to shorter hours of daylight compared to summer. Useful electricity is distributed throughout the building as follows:
4.
6.
8.
7.
Lighting load percentage 63600/ 209360=17%
As stated on the brief, solar PV array produces 50kWp, converting that to kWh:
Lifts: 5% (CIBSE, 2012)
Heating Pump Load: 2.5��/��2 ×5300��2 =13250��
Lighting: 12W/m2 (Hawkins, 2011) and M Shed Area: 5300m2 (Archdaily, 2011)
Security Systems – 10/ 209360=0.00002%
HVAC Systems: 40% 50% (CIBSE,2005), but for M Shed a load percentage of 40% (minimum value from given range) as M Shed is heated using biomass boilers, and not electrically heated
Total Watts for Lighting, Small Power, Pump, and Security Systems = 63600+132500+13250+10=209360��
Small Power: 25W/m2 (Hawkins, 2011) and M Shed Area: 5300m2 (Archdaily, 2011)
Lighting Load: 12��/��2 ×5300��2 =63600��
Small Power Load: 25��/��^2 ×5300��^2=132500��
Security (CCTV Systems) 10W (The home hacks DIY, no date)
Pump (Heating) 13250/209360=3%
Side Note Lighting, small power, pump, and security system load percentages have been proportionally split adding up to 55% using data provided above
• Security Systems (CCTV/ access controls/ BMS/ fire pumps/ alarm systems)
30 APRIL 2022 PAGE 8
Percentage estimates for each category are as follows:
Small Power load percentage 132500/ 209360=35%
Heating Pump Load : 2.5W/m2 ( CIBSE, 2012) and M Shed Area: 5300m2( Archdaily, 2011)
��������������������������������ℎ=������������������ (MCS, 2012)
Kk= 972 (table for zone 5E @ Bristol) , I assumed the solar panels, are angled at maximum pitch to gain as much light as possible
30 APRIL 2022 PAGE 9
Using the PV generation charts, I will be commenting on the system performance in relation to the seasonal weather condition and the system rated output. Data given on the graph, are in kWh/half hour, I will be doubling these values to obtain kWh.
M Shed Electrical Demand: 57 kWh/m2 (CIBSE, 2012) 57����/m2x 5300��2= 302100 ����ℎ
Shading Factor= 1, no tall buildings surrounding M Shed shading on PV Panels
According to data taken during June 2017, the peak energy generated was 38kWh at 13:30pm on 18 June, and the lowest energy generated was at 10:30am with only 4Wh, on 18 June despite being daytime and during summer. In addition, there is a system disparity on 23rd June,
Figure 8 Sankey Diagram

���������������������������� (����ℎ)= 48600
���������������������������� (����ℎ)=50 �� 972 (������, 2012) �� 1
Percentage of energy generated by solar panels
48600/302100=0.161 �� 100=16%
In conclusion, solar panels are not reliable, as they are affected by external factors, impacting the system’s performance such as air pollution especially M shed is in Bristol’s city center where pollution rates are higher (Jeddere Fisher,2021). Another factor, the PV cells within the array are less efficient during high temperatures, hence there were data inconsistencies during summer (CIBSE, 2000) Finally, in the United Kingdom, daylight hours throughout day are short, and solar PV’s depend on daylight to generate.
30 APRIL 2022 PAGE 10
with a maximum of only 12kWh, caused by an overcast day. There is a substantial difference between energy generated on 18 June and 23 June both at 13:00 with 38kWh and 12kWh respectively. The solar panels start to generate electricity at 6:00am.
On the contrary, during November 2017 the highest energy generated were on both 2nd November at 13:00 and 5th November at 14:00 producing 18kWh, and on 7th November at 15:30 was the least energy generated by the PV arrays because winter months have shorter daytimes The graph exemplifies a discrepancy in solar PV system during 7th November This is evident because during the same time on a different day energy produced was 18kWh whereas on 7 November it was only 2kWh. Due to lack of sunshine, solar panels start to generate electricity only after 8:30am.
Bristol City council declared a climate emergency in 2018 and undertook a decision, making Bristol carbon neutral by 2030. Current data shows, heating buildings and supplying hot water, is around 45% of Bristol’s carbon emissions. 90% of current heating systems in the city run on either gas or oil. Bristol has 160,000 boilers that operate using fossil fuels. To overcome this, Bristol City Council, decided to add water source heat pumps, to the existing heat networks to heat the buildings and supply hot water to local businesses and residents (Centre for Sustainable Energy, 2019).
This system is also beneficial to consumers as it lowers energy costs, which reduces prevalence of fuel poverty (Energy Service Bristol, 2018). According to Wiltshire R., Williams J., Woods P., (2014), district heating introduces flexibility in changing between different technologies. According to Energy Service Bristol (2018), lowering system’s flow and return temperature, leading to a highly efficient system. A few of the disadvantages associated with the system, for pipes to run hot water throughout the district network, must have a large diameter with metal as an insulating material, and there will be heat losses to the ground. During summer, heat generated from the system is wasted, and cannot cool buildings (ICAX, no date)
Water source heat pumps have numerous of opportunities, such as they are energy efficient, because when 1 unit of electricity is inputted, and 3 4 units of electricity is produced (Bristol City Council, 2019). In some cases WSHP can work in reverse and cool rather than heat, during summer (Renewables first, 2015). They do not require regular maintenance and are cheaper to
30 APRIL 2022 PAGE 11
Section B: Essay Question
District heating a cost efficient method in minimising carbon emissions. This system will benefit developers and building owners and operators, by having lower operational and capital costs associated than when installing a traditional gas boiler, in addition, heat substations will have a smaller footprint thus increasing available floor area for developments. The heating systems don’t need to be oversized to meet high demands, as they can adjust temperatures and volume of heat, unlike gas boilers. Heating networks, also have a minimal contribution to air pollution.
30 APRIL 2022 PAGE 12
run, unlike gas boilers. In general terms, water’s heat transfer rate is much higher than for instance air, making them more efficient (District heating Scotland) . On the contrary, WSHP refrigerant gases need to be carefully controlled to elude leakage of greenhouse gases (Centre for Sustainable Energy, 2019), and WSHP need to be located near a source of water to Togenerate.conclude, from the advantages listed above Bristol City Council has taken a suitable decision to decarbonize the grid, over the progress of the upcoming years. The use of water source heat pumps in district heating immensely reduces CO2 emissions. Low carbon heating design does meet requirements to heat and produce hot water and is more effective than other heating systems which run on gas for example. Throughout upcoming years, the demand for heating and hot water will increase, therefore low carbon systems will also be efficient to be used in the future. 0
30 APRIL 2022 PAGE 13 Low Carbon ServicesBuilding Jolie Bassem Fekry Farid STUDENT ID : 19006111 MODULE CODE: UBLMN7 30 3 YEAR MODULE RUN : 2021 2022 COMPONENT B- ENERGY MODELLING REPORT
Figure 9 Proposed Development 3D View (Northacre London, 2022)


Portland House and Westminster Hall are buildings that surround the site with 27 and 20 storeys respectively (Squire and Partners, 2015) Studies were conducted and concluded a connection to an existing heat network such as Whitehall District and Pimlico District Heating is not feasible in such a short time frame due to exceeding the recommended distance connection to heat networks. However, a future connection to White Hall Scheme is in currently being considered The proposal follows the energy hierarchy of Be Lean, Be Clean and Be Green to reduce carbon emissions by 35% against Part L2A (Building Regulations Part L2A, 2013) building regulations.
30 APRIL 2022 PAGE 14
Figure 10 Site and Context (Squire and Partners, 2015).
Section A: Reviewing an Energy Statement
A proposed development, 10 Broadway located in Westminster, London. The site’s shape is triangular, and comprises of three inter related blocks; 9 storeys along Victoria Street, and 7 storeys facing centre of site, including a 21 storey building between Broadway and Dacre Street (AECOM ,2015) The proposed scheme is mixed use, and consists of offices, retail, and residential. It has a GIA of 56,000 sqm and GEA of 93,610 sqm.
Building Assigned: 10 Broadway Introduction
1 The London Plan. Spatial Development Strategy for London, March 2015
The team implemented a few assumptions, these include being energy efficient in both fabric and building services design. According to (AECOM,2015) , the proposal’s fabric U Values are lower than recommended values in Part L2A Guide as illustrated in figures 12 and 13, which will improve energy efficiency and a reduce energy emissions. Additionally, the proposal has met Criterion 1 of Building Regulations of Part L2A through energy emissions only (AECOM,2015), According to AECOM (2015) and U Values of proposal, were provided in a range rather than a single value, thus creating uncertainty and

30 APRIL 2022 PAGE 15
Figure 11 Section through Site and Context (Squire and Partners, 2015)
5 London Policies 5.2 5.7
Key Modelling Inputs and Assumptions
4 Sustainable Design and Construction Supplementary Planning Guidance, April 2014
3 GLA Guidance, Preparing energy statement, April 2015
2 London Mayor of Air Quality and Construction, December 2010
The non domestic sector of the proposed development was modelled on IESVE version 7.0.2, to work out the Building Emission Rate (BER) and the target emission rate (TER) in parallel. The proposal’s TER complies with Part L Building Regulations. In contrast, the proposed domestic developments were modelled through NHER Plan Assessor Version 6.1.0. The adopted methodology for domestic developments is SAP 9.92 and National Compliance Methodology (NCM) for non domestic developments. Moreover, the proposed development aims to conform to the following policies:
There are several design strategies implemented to ensure that building demand is reduced. According to AECOM (2015) the building is designed and oriented in a manner, where towers overshade each other and based on factors such as time, this diminishes solar gains infiltrating through the flats. The proposal also has balconies which allow the living rooms to be shaded. Unfortunately, the process of minimising glazing dimensions, and lowering their G values, solely doesn’t reduce the risk of overheating, and therefore does not fulfil the TM52 compliance; thus, not meeting the “Be Lean” criterion. This might be because of curtain wall U values, which are high.
The domestic segment has an air permeability of 3.0m3/hr.m2 and a notional building value of, 5.0m3/hr.m2 at 50Pa; this is a great improvement in contrast to building regulations. The energy statement states the proposal will have energy efficient lighting control systems. The TM52 guidance was used to assess overheating, and encompass a passive strategy which follows cooling hierarchy measures, these include:

it is not clear whether they had met any of the regulations. (NCM, 2013) mentions, if proposal’s values are higher than recommended, the team must provide justification why standards weren’t met Since, the proposal is in central London, it is not clear whether they are using appropriate data weather sets to ensure overheating risk models effect of Urban Heat Island.
Figure 13 U Values provided in Part L2A (Building Regulations Part L2A, 2013)

Reducing Building Demand ( Be Lean)
30 APRIL 2022 PAGE 16
Figure 12 U Values provided in Energy Statement (AECOM, 2015)
1 reducing the internal heat gain through energy efficient design,
The weather tape used declares overheating assessment, follows the GLA guidance and implemented through IESVE version 2007. According to AECOM (2015) the base case values were taken across 1976, 1989, and 2003. The GLA guidance suggest data for overheating assessment should be taken throughout 1976, 1989 and 2004. This follows good practice because the climate was not stable and kept fluctuating every year.
The opportunities of this technology include, electricity is generated which can either be used throughout the building or sent back to the grid, for later use, doesn’t require regular maintenance, and maintenance at low costs (AECOM ,2015). Moreover, it decreases electricity bills of proposed development since the building’s required energy is met through energy generation of PV’s. Moreover, they don’t have high maintenance cost since they don’t need regular maintenance (Greenmatch,2021).
2 minimize the amount of summer heat penetrating into the building
30 APRIL 2022 PAGE 17
5 Use of mechanical ventilation, which will be used partially since the size of the proposal is limited.
The only energy modelling results presented in the energy statement only include cooling demands. Active cooling during hot days will reduce the chance of overheating, such that high efficiency chillers will be used attaining an SSER of 7.3. Variables such as low specific fan power of 0.23 W/l/s were executed into the model. Annual cooling demand data was extricated from IES (VE), on the other hand, the domestic segment was modelled through EDSL TAS version 9.3.1. The BRUKL report was not attached to the proposal’s energy statement, which should have been included, to provide further information on heating, cooling, and lighting.
Using Low or Zero Carbon Technologies ( Be Clean, Be Green)
On the contrary, since the proposed development is in Central London United Kingdom, solar panels are solely dependent on weather conditions. Especially the UK doesn’t get as much sunlight throughout the year, then not much energy will be outputted from them during those days. Surprisingly, they are renewable sources but contribute to air pollution during transportation and installation and therefore contribute to greenhouse gases and will affect the environment negatively. Finally, in case there is any cleaning or maintenance required, it should be easily accessible (Greenmatch,2021).
4 Utilise the use of natural ventilation, but fatefully limited due to the proposal’s location, in central London
Since the proposal, plans to have a CHP installed in the future, some of the renewable technologies considered, don’t operate well with CHP, but installation of PV will not have that issue. It is planned to be installed on a 200m2 roof (AECOM ,2015)
3 Manage to reduce heat in the building through the implementation of high ceilings, and expose the internal mass
• Improving air tightness of building reduces heating loads by approximately 30 percent (between least airtight which follows Part L2A recommended values and Passive House airtightness values)
Introduction to the Building
Figure 14 Limiting Fabric Parameters (Building Regulations Part L2A, 2013 )
• Design Parameter investigates air tightness of office building, allowing this building to be passive house, will increase energy efficiency
A five storey office building, consists of ground and four typical floors illustrated in figure 16 located in Beckenham Place Park, Southend, a low density area in London, United Kingdom The building is oriented 40° from North, all the facades are almost fully glazed, and is not overshadowed by any surrounding buildings. The building split into zones, these comprise of open plan offices, circulation spaces, WCs, and plant areas. The building’s gross internal area is approximately 10,260sqm. It is modelled through IESVE version 2021.2.0.0. The model uses London Southend EPW weather database provided by ASHRAE. In this report, I will be investigating how to reduce building’s cooling load by 10 percent, additionally assessing the influence of air tightness on heating plant load The building’s fabric in the model follows U Values of Part L2A (2013) of the building regulations illustrated in figure 14
Executive Summary:
• Adding vertical shading on northeast, and southwestern facades reduces cooling loads of building by 10 percent
• Horizontal shading doesn’t massively reduce cooling loads
Section B: Building a Model
30 APRIL 2022 PAGE 18
Figure 15 Site Location (Highlighted in
FigureRed)17
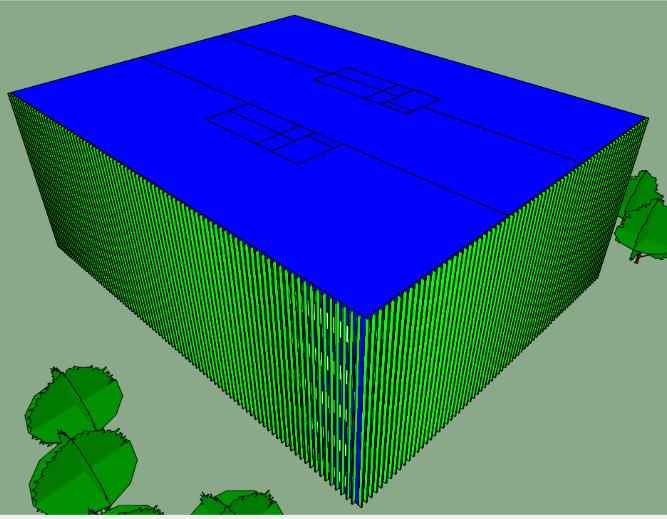
Figure 18 Axonometric View


Site Location

Figure 16 South View of Model
30 APRIL 2022 PAGE 19
The site is located such that trees and vegetation could provide shading

Figure 20 Sun Path Diagram @ 12pm

Plan of Office Building
Figure 21 Sun Path Diagram @ 5pm
Figure 19 Sun Path Diagram @ 6am

Figure 22 Effect of solar shading on solar gains

16 , and previously mentioned, the fully exposed facades will initiate to an increase in solar gains, therefore increasing cooling load. Adding solar shading to south, east and west facades is a strategy that can be implemented to reduce cooling load. The parameter of solar gains was assessed as it directly affects the cooling load required in a building.
According to Grynning S., Time B., and Matusiak B., (2014) studies were conducted, and it is concluded, adding solar shading to North facades, will instead increase and not decrease cooling loads during summer. My first approach was adding horizontal shading to the northeast and southwest facades, this did not massively reduce, solar gains. This could potentially due to summer sun’s altitude higher how far the horizontal shading covers. The next iteration was switching to vertical shading across the whole façade, as illustrated in figure 28 From the results illustrated below, the solar gains did not reduce as intended, and therefore altered the fins alignment and are deeper than across the façade. Decreasing spaces between one fin and another, might be more effective so that it can block the high angle sun which is at 59 degrees during midday summertime as shown in figure 31 The results demonstrated below, is during July, it if known for its peak temperatures throughout summer. It can be concluded that vertical shading works best with buildings that have large areas of glazing. Noting that adding the proposed fins will increase construction costs for façade works, on the contrary will save operational costs.
30 APRIL 2022 PAGE 20
Design ReferringDecisionstofigure
Figure 30 Section with deeper vertical shading
Figure 28 Building with Vertical Shading
30 APRIL 2022 PAGE 21
Figure 25 Building with Horizontal Shading


Figure 24 Section with horizontal shading
Figure 23 Plan with Horizontal Shading
Figure 27 Section with vertical shading
Figure 26 Plan with Vertical Fins
Figure 29 Plan with Deeper Vertical Shading


Figure 31 Building with Deeper Vertical Shading


2 Part L New Build, as a base line which complies with building regulations
50%
Air Changes Per Hour (ach)
To convert air permeability values to air changes per hour, the following procedure is taken:
ChangingCalculation:from air permeability data to air changes per hour: M3 /h.m2 (air permeability) x (area / Figurevolume)32Calculations
Design Decisions
3 50 percent better performance on Part L values to see effect of improvement on heating loads.
The given design consideration according to the is assessing building airtightness. Airtightness is a measure of the rate of leakage throughout a building. During winter, buildings need to be sealed, to reduce heat loss. To assess the effect of airtightness of the building, the parameter of heat loss needs to be assessed. Therefore, from the graph below, using heating plant load, which is the required amount of energy needed for the building. During winter, we see the effect of losing heat according to CIBSE (2021), therefore results throughout the month of January were investigated, this is the utmost time where heating is need for buildings in the United Kingdom
Air Tight (Passive House Building) 0.45 performancebetterofPart L building 0.55
According to CIBSE (2021), a Passive House, Part L compliance, and a 50 percent improvement on Part L values, were chosen to comprehend, the effect of airtightness to heating loads. Those three building types were chosen due to the following reasons:
Air Tight (Passive House Building) 3 (CIBSE, 2021) 50% performancebetterof Part L building 4
Part L Base Line Building (newbuild) 1.1
1 Passive Haus building is an airtight building, because of construction and materials within it.
Volume of Building (m3) 41452 Area of Building Fabric (m2) (Walls and Roof) 5736
(m3/h.m2) @ 50Pa
30 APRIL 2022 PAGE 22
Air Permeablity Values
Part L Base Line Building (newbuild) 8 (Building Regulations Part L, 2021)
The data used in the calculation above, might be unreliable because ventilation mechanism (natural or mechanical) was not mentioned, it would have been more accurate to find values for a mechanically ventilated building. From the graph above, we can see that Part L baseline new build, has the highest heating load, due to a high rate of infiltration. Additionally, it is also demonstrated on the graph, increasing the building airtightness, reduces the required heating load, due to minimal heat loss . The graph illustrated above matches with the profiles set for the office, as the building is operated from 8am to 6pm, which will define the timing for the building heating operation. Therefore, it can be concluded, buildings must be well sealed to reduce heating load and to be energy efficient.
Figure 34 Daily Load Profiles from IESVE


30 APRIL 2022 PAGE 23
Figure 33 Heating Load Graph
The chosen weather file was London Southend in general, because during the years mentioned above, for instance might not include a recent fluctuation for instance in temperature
• London Southend TMY (2007 2021)
Weather files available on Climate One for London Southend:
Assumptions
Figure 35 Wall Build up from IESVE
Fabric U Values were all based on, Part L2A (Building Regulations Part L2A, 2013)
• London Southend
1 Weather Data
30 APRIL 2022 PAGE 24
2 Fabric U Values

• London Southend TMY (2004 2008)
Wall Build Up: U Value of 0.13W/m2K
Both Wall and Glazing follow the Part L2A U Values, (Building Regulations Part L2A, 2013) provided in the report’s introduction. A better U value than recommended means the more efficient the building is.
Seasonal Efficiency: 3.44
IESVE
Domestic Hot Water ASHP, Split or multi split system Mitsubishi Electric (QAHV N560YA HPB)
System System Name Manufacturer Seasonal Efficiency or SEER

Heating
ASHP Cassettes
ASHP Cassettes
Systems
Window Construction
3 Systems
Split or multi split system (DaikinRXYSA6AV1)
Figure 36 from
30 APRIL 2022 PAGE 25
Figure 37 used in model
Split or multi split system (DaikinRXYSA6AV1) SEER:7.6
Cooling
Seasonal Efficiency: 4.7
Glazing U Value 1.00W/m2K.
Figure 38 Profile for Offices from IESVE
SinceProfilesthebuilding
30 APRIL 2022 PAGE 26 4
Figure 38 Profile for Offices from IESVE

comprises of offices, the usual working hours during the day is from 8:00am to 6:00pm ( this excludes weekends and any holidays). This means systems will not work outside working hours, which is energy efficient and will be sized to meet the space needs.
8) Centre for Sustainable Energy (2019) Bristol Net Zero by 2030: The Evidence Base [online]. Bristol: Centre for Sustainable Energy. Available from: https://www.cse.org.uk/downloads/reports and publications/policy/insulation and heating/energy justice/renewables/behaviour change/building performance/Bristol_net_zero_by_2030_study_CSE_26_Feb_2020.pdf [Accessed 10 January 2022].
30 APRIL 2022 PAGE 27
6) Chartered Institution of Building Services Engineers (2012) Energy Efficiency in Buildings [online]. 3rd ed. London: CIBSE. [Accessed 3 January 2022].
7) Chartered Institution of Building Services Engineers (2000) Understanding building integrated photovoltaics [online]. London: CIBSE. [Accessed 10 January 2022].
4) Chartered Institute of Building Services Engineers ( 2013) Module 55: Biomass for commercial building heating systems. Available from: https://www.cibsejournal.com/cpd/modules/2013 08/ [Accessed 29 December 2021].
9) Energy Services Bristol (2018) Connecting to the Bristol Heat Network [online]. Bristol: Bristol City Council. Available from: https://www.energyservicebristol.co.uk/wp content/uploads/2021/10/Heat_Network_Developer_Pack_Part 1_Oct_2021.pdf [Accessed 10 January 2022].
5) Chartered Institution of Building Services Engineers (2005) Electricity in Buildings [online]. London: CIBSE. [Accessed 3 January 2022].
11) Greenmatch (2021a) The Pros and Cons of Air to Air Heat Pumps . Available from: https://www.greenmatch.co.uk/blog/2015/09/the pros and cons of an air to air heat
1) AECOM (2015) Ten Broadway Energy Statement [online]. London: AECOM. Available from: applications/applicationDetails.do?activeTab=documents&keyVal=NT1H35RPLBX00https://idoxpa.westminster.gov.uk/online
3) Chartered Institute of Building Services Engineers (2021) CIBSE Guide A Environmental Design [online]. London: CIBSE. Available from: [Accessed 30 April 2022].
References:
2) Archdaily (2011) M Shed Bristol Museum/ LAB Architecture Studio. Available from: https://www.archdaily.com/147080/m shed bristol museum lab architecture studio [Accessed 8 January 2022].
10) GOS Heating (2022) Building Management Systems. Available from: https://www.gosheating.co.uk/commercial/building management systems bms/ [Accessed 3 January 2022].
17) Holden, J. (2014) Renewable energy sources how they work and what they deliver [online]. Report Number DG 532 1. Bracknell: BRE. Available from: https://www ihsti com.ezproxy.uwe.ac.uk/tempimg/1140244 CIS888614800309161.pdf [Accessed 5 January 2022].
18) ICAX (no date) Advantages for District Heating. Available from: https://www.icax.co.uk/Advantages_District_Heating.html [Accessed 11 January 2022].
21) Building Regulations (2021) Conservation of fuel and power in new buildings other than dwelling [online]. London: NBS. (Part L). Available https://www.gov.uk/government/publications/conservationfrom: of fuel and power approved document l [Accessed 30 April 2022].
30 APRIL 2022 PAGE 28
19) Jeddere Fisher, F. (2021) Renewable Energy Solar and Wind. Low Carbon Building Services [online]. Available from: https://my.uwe.ac.uk [Accessed 4 January 2022].
20) MCS (2012): Guide to the Installation of Photovoltaic Systems [online]. London: MCS. [Accessed 9 January 2022].
December%205%3A%20The%20indoor%20unit,thereby%20warming%20up%20the%20roompump#:~:text=1%201%3A%20An%20outdoor%20unit,coolant%20flowing%20in%20the%20coil.&text=5.[Accessed292021].
12) Greenmatch (2021b) Air to Water Heat Pumps: Working Principles. General Information about Air to Water Heat Pumps [blog]. 08 September. Available from: https://www.greenmatch.co.uk/blog/2014/08/air to water heat pumps working principles [Accessed 29 December 2021].
13) GreenMatch, (2021c) Pros & Cons of Solar Energy. Available from: https://www.greenmatch.co.uk/blog/2014/08/5 advantages and 5 disadvantages of solar energy [Accessed 30 April 2022].
14) Grynning, S., Time, B. and Matusiak, B., 2014. Solar shading control strategies in cold climates – Heating, cooling demand and daylight availability in office spaces. Solar Energy, 107, pp.1 19. [Accessed 30 April 2022].
15) Hawkins, G. (2011) Rules of Thumb. Guidelines for Building Services. 5th ed. Bracknell: BSRIA. [Accessed 4 January 2022].
16) Heat Network Partnership for Scotland (2017) District Heating Strategy Fact Sheet [online]. Stirling : Heat Network Partnership for Scotland. Available from: https://www.districtheatingscotland.com/wp content/uploads/2017/10/Module 4 Heat Pumps.pdf [Accessed 11 January 2022].
22) Building Regulations (2014) L2A Conservation of fuel and power in new buildings other than dwelling [online]. London: NBS. (Part L2A). Available from: BR_PDF_AD_L2A_2013_with_2016_amendments.pdf (publishing.service.gov.uk) [Accessed 30 April 2022].
24) Renewable Energy Hub (2018). HOW DOES BIOMASS BOILERS WORK. Available from: https://www.renewableenergyhub.co.uk/main/biomass boiler information/how biomass boilers work/ [Accessed 29 December 2021].
26) Renewables First (2015) Water Source Heat Pump Benefits. Available from: https://www.renewablesfirst.co.uk/water source heat pumps/water source heat pump benefits/ [Accessed 12 January 2022].
27) Squire and Partners (2015) Ten Broadway Design and Access Statement [online]. London: Squire and Partners. Available from: 28)applications/applicationDetails.do?activeTab=documents&keyVal=NT1H35RPLBX00https://idoxpa.westminster.gov.uk/onlineWiltshireR.,WilliamsJ.,WoodsP.,(2014)
25) Renewables First ( no date) Water Source Heat Pumps (WSHP) Information Sheet Commercial Systems [online]. Stroud: Renewables First. Available from: https://www.renewablesfirst.co.uk/wp content/uploads/2020/02/WSHP Flyer Commercial.pdf [Accessed 11 January 2022].
A technical guide to district heating [online]. Bracknell: BRE. [Accessed 11 January 2022].
30 APRIL 2022 PAGE 29
23) Palmer, D., Ashford, C., Kinnibrugh, J. and Smith, G. (2014) Biomass heating [online]. London: CIBSE. [Accessed 3 January 2022].
