
Published by SET Publisher

Published by SET Publisher
H. Douglas Lightfoot1,* and Gerald Ratzer2
1The Lightfoot Institute, Canada
2Professor Emeritus, McGill University, Canada
Article Info:
Keywords: IPCC, carbon dioxide, ECS, logarithm, Sun, methane, Earth's energy balance.
Timeline:
Received: September 26, 2025
Accepted: November 03, 2025
Published: November 10, 2025
Citation: Lightfoot HD, Ratzer G. Significant errors identified in the IPCC reports. J Basic Appl Sci 2025; 21: 167175.
DOI: https://doi.org/10.29169/1927-5129.2025.21.18
*Corresponding Author

Abstract:
Some countries are concerned about increasing levels of carbon dioxide (CO2) causing dangerous warming of the Earth, as promoted by the Intergovernmental Panel on Climate Change (IPCC). This is a mistake by the IPCC because the warming by CO2 is too small to measure. This study identifies six serious errors by applying critical thinking and the scientific method. For example, doubling the level of CO 2, i.e., the Equilibrium Climate Sensitivity (ECS), does not measurably affect the Earth’s temperature because the warming effect of carbon dioxide (CO2) is too small to measure. Thus, the plot of the warming effect of CO2 against the level, whether or not it is a straight line or logarithmic, is irrelevant. The Sun’s energy is the primary control of Earth’s temperature. However, there is some energy input from the ENSO (El Niño Southern Oscillation). Thus, the Earth's temperature drops when the Sun’s energy output falls, as it is currently doing. The IPCC overestimates the warming impact of methane and nitrous oxide, both of which have a negligible warming effect. The Earth’s energy balance is incorrect because it is based on averages, and the amount of energy to evaporate water must equal the amount sent to space. It is recommended that people and their governments know about these errors and take appropriate action.
E-mail: hdouglaslightfoot@gmail.com, contact@thelightfootinstitute.ca
© 2025 Lightfoot and Ratzer
This is an open-access article licensed under the terms of the Creative Commons Attribution License (http://creativecommons.org/licenses/by/4.0/), which permits unrestricted use, distribution, and reproduction in any medium, provided the work is properly cited.
This document excerpts the errors detailed in peerreviewed published papers in the References. These papers “return to the original, physically grounded formulations of the 19th-century scientists” to provide a clearer, more coherent foundation for physics [1]. They include the modern concept of computer models, satellite information, international weather data via cellphones, Google Earth, and Excel for calculations. Each paper in the References has a URL that allows it to be readily accessed.
The IPCC released six climate assessment reports, starting with the First Assessment Report (FAR) in 1990 and ending with the current Sixth Assessment Report ( AR6) in 2021. Few know that these reports contain at least six significant errors.
Many have shown that the Intergovernmental Panel on Climate Change (IPCC)'s concept that increasing carbon dioxide (CO2) levels in the Earth’s atmosphere can cause dangerous warming is false. However, few have pointed out the additional serious errors in the IPCC reports.
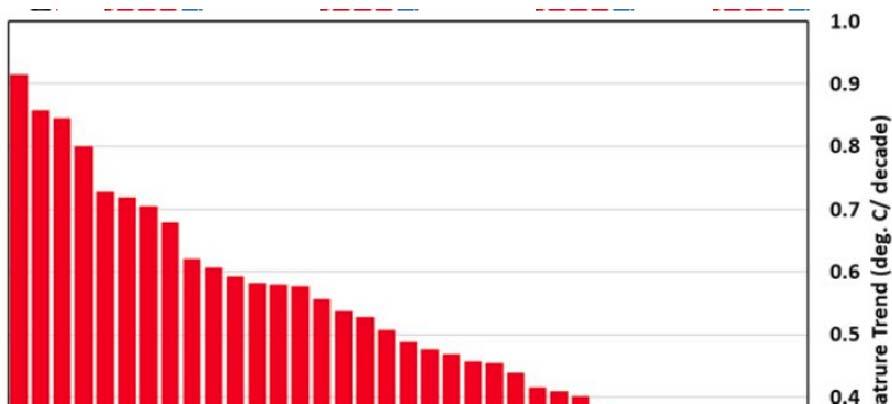
This study identifies these errors, explains the background, and references the documents in which they are presented. The study begins with Figure 1 , which is not from our peer-reviewed papers but shows the results of 39 computer models used by the IPCC that are inconsistent with the measured changes in the Earth’s surface temperature [2]. The climate models in Figure 1 used by the IPCC do not replicate the change in the Earth’s temperature. They fail validation (except, possibly, for the Russian INM model on the extreme right). Thus, these models are at the source of the problem. For example, in this group, Canada's CIESM model, the first on the left, was in error by a factor of six (a 600% error against measured data).
The contribution of CO2 to global warming shows a maximum increase in the Earth's temperature by CO2 since 1750: (0.000509 – 0.000329) = 0.000181 °C as determined in Section 6 of Reference [4]. This temperature is negligible compared to the estimated increase of 0.8 °C to 1.3 °C from 1850 to 2019 by the IPCC in AR6 [5].
The temperature increase of CO2 is calculated by knowing its measured value in the atmosphere (See section 6 of Reference [4]). For example, on February 21, 2022, the CO2 concentration was measured at Mauna Loa at 418 ppm. The 418 ppm is 418 molecules of CO2 per million molecules of dry air, which is the mole fraction, 0.000418 moles per mole of dry air. Dry air has a molar mass of 29; one mole of dry air weighs 29 grams or 29 g/mol. Multiplying 0.000418 by the molecular weight of CO2, 44, and multiplying by (1000/29) gives grams of CO2 per kilogram of dry air. This value is 0.0184 grams of CO2 per kg of dry air, or 0.0000184 kg/kg of dry air.
CO2 will substantially increase Earth’s temperature by 1.5 °C to 4.5 °C. They have had this or similar ranges for many years. It is termed the Equilibrium Climate Sensitivity (ECS).
Figure 2 below is from Reference [7]. The maximum temperature rise on this set of temperatures is 0.006035 °C at Taoudenni, Mali (Cell BF48 in the SUPPL information) in the Sahara Desert on April 21, 2021, at 16:50. If we doubled the level of CO2 to 836.48 ppm, the temperature would increase from 0.006035 to 0.012070 oC. This amount is too small to measure.
(1)
0.000418 x 44 x (1000/29) = 0.0184 grams of CO2 per kg of dry air .
The heat content of CO2 is weight x specific heat x ΔT, where weight is CO2, in kilograms per kilogram of dry air. The specific heat of CO2 is 0.833 KJ/(kg K), and Δ T is the temperature difference in Celsius between two locations of interest.
References [6, 7] also provide methods for showing that carbon dioxide's warming effect is too small to measure.
3. DOUBLING CO2 INCREASES ATMOSPHER IC TEMPERATURE BY A NEG LIGIBLE AMOUNT
The IPCC claims that CO2 can raise the Earth’s temperature significantly; thus, it shows that doubling
4. WHY IS THE WARMIN G EFFECT OF CO2 A STRAIGHT LINE AND NOT LOGARITHMIC, AS CLAIMED BY THE IPCC?
The IPCC claims in its Third Assessment Report (TAR) in section 6.3.5 that the warming effect of carbon dioxide (CO2) is logarithmic and provides a formula: ΔT = 5.35LN(C/Co) where the difference in temperature between two CO2 concentra tions is the logarithm (LN) of the ratio of the higher concentration “C” and the lower “Co”.
The IPCC logarithm function is currently used and assumed to be correct in many published works.
In 2014, Orval Mamer and H. D. Lightfoot published Figure 3 below in Reference [8]. At the time, we thought the relationship between CO2 concentration and temperature was logarithmic. We produced a
Figure 2: The temperature at Taoudenni, Mali, is 0.006035 °C above. Thus, the Equilibrium Climate Sensitivity (ECS) is negligible and unmeasurable.
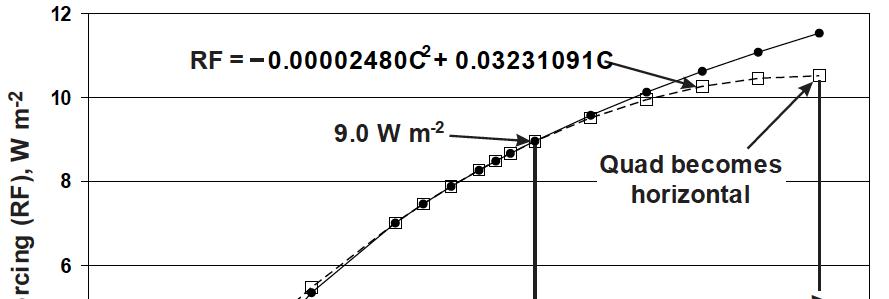
3: Concentration of CO2 (ppm) vs. Radiative forcing W m-2. The quadratic curve is a better relationship than the logarithmic curve because it starts at zero and approaches an asymptote.
quadratic curve with the same results between zero and 655 ppm as a logarithmic curve. It is better than the logarithmic curve because it starts at zero and reaches an asymptote, which is necessary, but is impossible with a logarithmic curve.
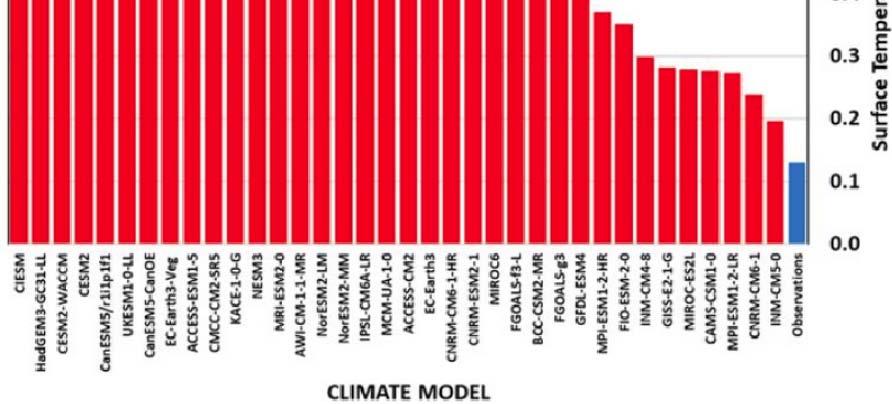
Later, we plotted the warming from CO2 in degrees Celsius against the CO2 concentration, yielding a straight line. This is proved by applying the proven Ideal Gas Laws to dry air, which includes CO2, and is expressed as:
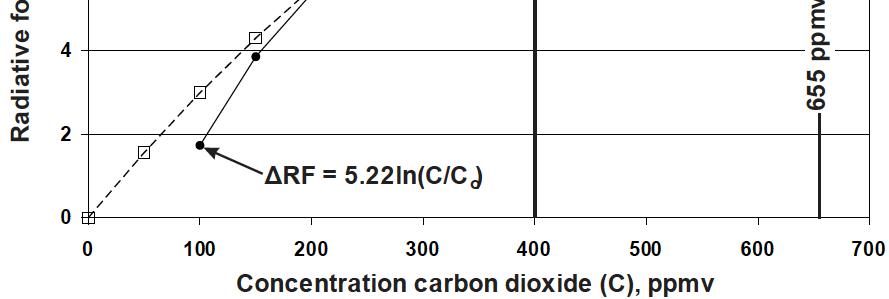
Where P = pressure, V = volume, R = gas constant, n = the number of moles, and T absolute temperature. Note that the volume of a gas is directly proportional to the absolute temperature (T) and inversely proportional to the pressure (P). When plotted, this equation will produce a straight line. Later, with Gerald Ratzer, we wrote a paper [9] using a different method of showing that the relationship between dry air, CO2, and temperature is straight, as in Figure 4 . All the gases in Earth’s atmosphere, including CO, are above their

boiling points and act as Ideal Gases . When water vapor (not an Ideal Gas) is added to dry air, it becomes moist air, and the relationship between concentration and temperature curves downward, as shown in Figure 4
The 240 points in Figure 4 result from measurements of temperature and relative humidity at twenty representative points around the Earth, taken on the 21st of each month for 12 months starting in March 2021.
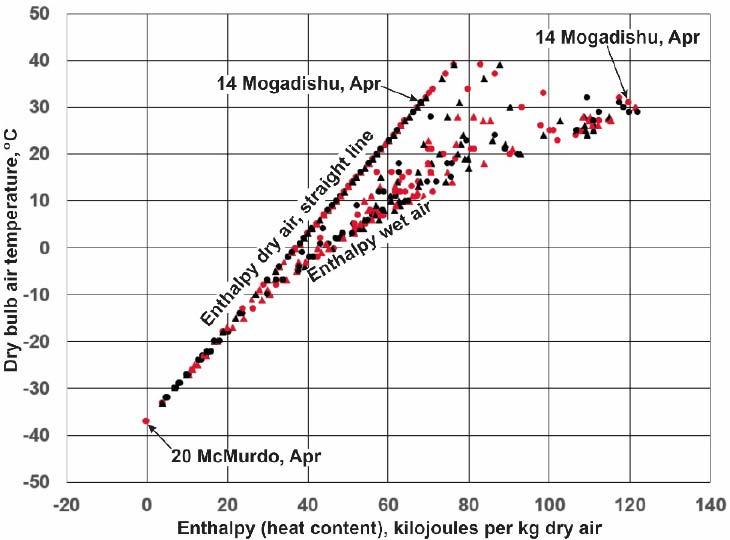
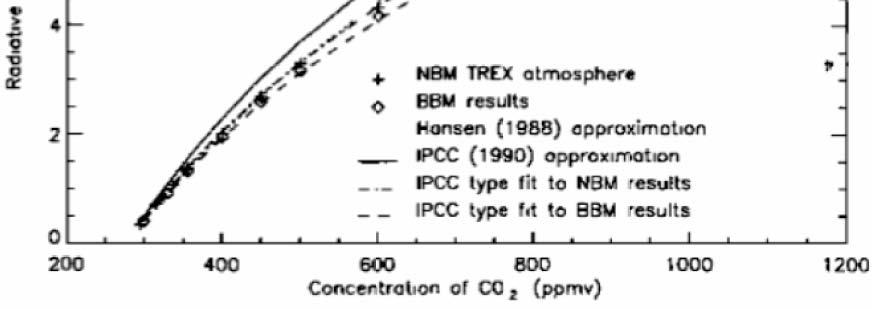
It is easy to confuse the warming effect o f CO2 with that of water vapor. Myhre et al . (1998) appear to be the origin of the IPCC mistake, as shown in Figure 5 .
If the relationship between temperature and the level of CO2 were logarithmic, then the warming caused by CO2 would decrease as the level increased. Eventually, it would no longer have a significant warming effect.
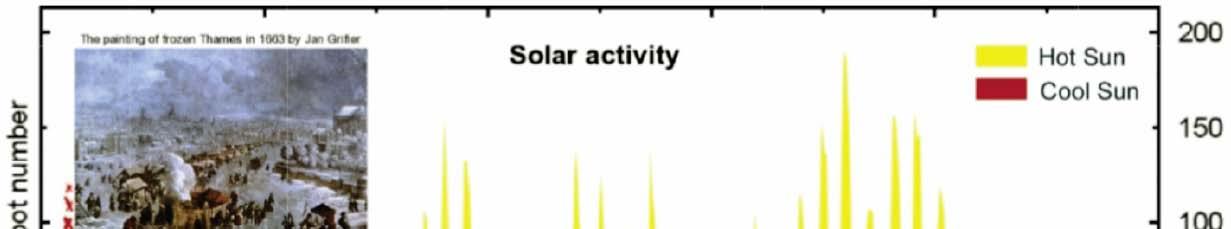
Figure 6, constructed by Abdussamatov K., from Reference [4, 10 ], shows that the Earth is headed towards a minimum temperature in 2042 ± 11, similar to the Maunder Minimum. During that period, the River Thames froze thick enough for carnivals to be held on it. Crop failures and starvation were widespread. Other authors, such as Valentina Zharkova [11], provide similar information and convincing evidence.
The Earth is part of our solar system, with the Sun at its centre. The conditions on Earth result from the properties of the Sun and the Earth. The Sun determines the Earth's temperature by sending energy to the Earth through short-wave radiation. The Sun's energy output varies over time, causing warm and cool periods on Earth, as shown in Figure 6 [12].
When the Sun’s short-wave radiation hits the Earth, it thermalizes, i.e., converts to heat. Then convection sets in, and the normal chemical and physical processes take over. Water evaporates and eventually condenses in clouds and falls as rain or snow. Enough heat goes to space (in the form of photons) from condensation as long-wave radiation to match the Sun’s heat input to the Earth, cooling it sufficiently for current life forms to flourish. The Sun provides most of Earth’s energy, but some comes from volcanic activity, especially below the ocean surface, and ENSO. Some water comes from burning fossil fuels, all containing hydrogen that forms water when burned.
A photon's energy equals its frequency multiplied by the Planck constant [13]. Thus, more photons of shortwave energy are arriving at Earth from the Sun than long-wave photons are leaving the Earth to balance the energy flows. The energy per photon of short-wave energy from the Sun is E = 6.6261 x 10⁻³³ Joules. The number of photons per Joule is the inverse of the energy per photon.
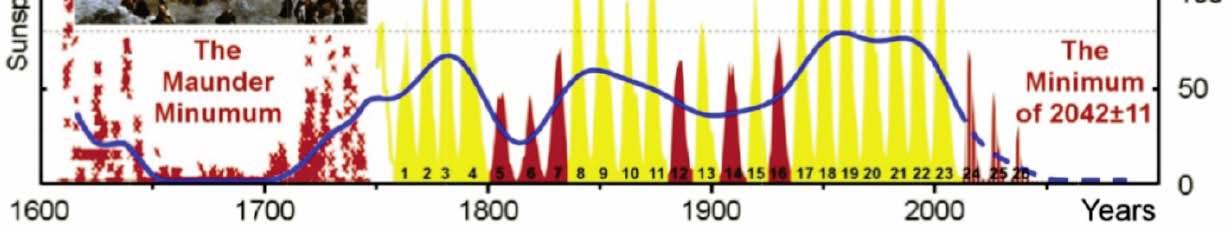
The fact that the Sun and the Earth are cooling and not warming, as in Figure 7, is not well-known, even among people who study the climate. Early frosts have already caused crop failures. By compensating for crop
failures, fossil fuels will be crucial to preventing starvation.
When photons from the Sun hit any part of the Earth, they immediately “thermalize”, meaning they convert to heat measured in Joules. If they hit solid earth, they warm the Earth and the adjacent air, which rises as convection because the warmer air is lighter.
If the photons hit water, they heat the surface, and the warm water stays on top because it is lighter than cooler water. Water's maximum density occurs at 4 °C. This is an essential property because it means rivers, lakes, and oceans freeze from the top down. Otherwise, animals living in these waters could not survive.
6. THE IPCC GROSSLY OVERESTIMATES THE NEGLIGIBLE WARMING EFFECT OF METHANE AND NITROUS OXIDE.
In Table 2.14 of the Fourth Assessment Report (AR4), the IPCC claims that methane has 21 times the warming effect of CO2 and nitrous oxide has 310 times [15].
On August 26, 2025, CO2 was 424.60 parts per million (ppm) in the Earth's atmosphere, methane was
1934.91 parts per billion (ppb) in April 2025, and nitrous oxide was 338.66 ppb in April 2025. Note that methane and nitrous oxide values are one thousand times less than those of CO2. The values are similar in [16] of April 2024. Based on the methane and nitrous oxide levels in Earth’s atmosphere as of April 2025, the warming effect of methane is 0.408% of that of CO2, and nitrous oxide is 0.085% of that of CO2
Methane molecules only have a residence time in the atmosphere of about ten years before converting to CO2 and water vapor, as shown in equation (3):
CH4 + 2O2 → CO2 + 2H2O . . . . . . . . (3)
That is why there is no significant accumulation in the Earth’s atmosphere. The warming effects of methane and nitrous oxide in the Earth’s atmosphere are so minor as to be negligible.
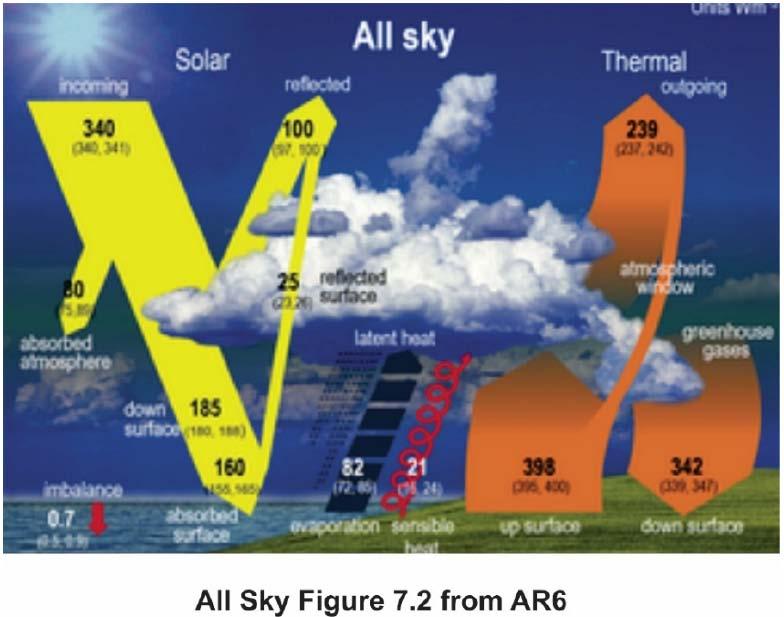
7. THE EARTH’S ENERG Y BALANCE, SHOWN IN FIGURE 7.2 IN AR6, IS WRONG BASED ON AVERAGES.
Figure 8 is Figure 7.2 of AR6, the Earth’s energy balance.
Figure 8 is wrong because it shows only energy flow averages. For example, the incomin g 340 W m-2 is the average based on the number of daily sunlight hours and the shape of the Earth as seen from the Sun. We know from [17] that the Sun's energy to evaporate
water must be slightly less than the amount sent to space because the Earth is cooling, as described in section 4 of this study.
From the water cycle (Figure 9), we know that the energy sent to space is from the evaporation of water from all sources, whereas Figure 8 shows energy from only the Sun. Other heat sources, such as submarine volcanic activity, must also be accounted for in the energy sent to space.
The amount of energy reflected to space by the Earth, the albedo, is 29%, which is close to the 30% commonly assumed for albedo.
Figure 9 shows the water cycle and includes evaporation from all energy sources. Although it shows only evaporation from the Sun’s energy, all heat sources, including underwater volcanic action, contribute to evaporation. The hydrogen from burning fossil fuels and biomass also adds water to the atmosphere.
The water cycle shows that all evaporated water condenses to form clouds of water droplets. When the clouds form, photons of long-wavelength radiation are sent into space. Many more long-wave photons go to space than short-wave photons from the Sun on Earth because long-wave photons have less energy per photon. The energy input to the Earth from the Sun is 320 exajoules (EJ)/hour [16].
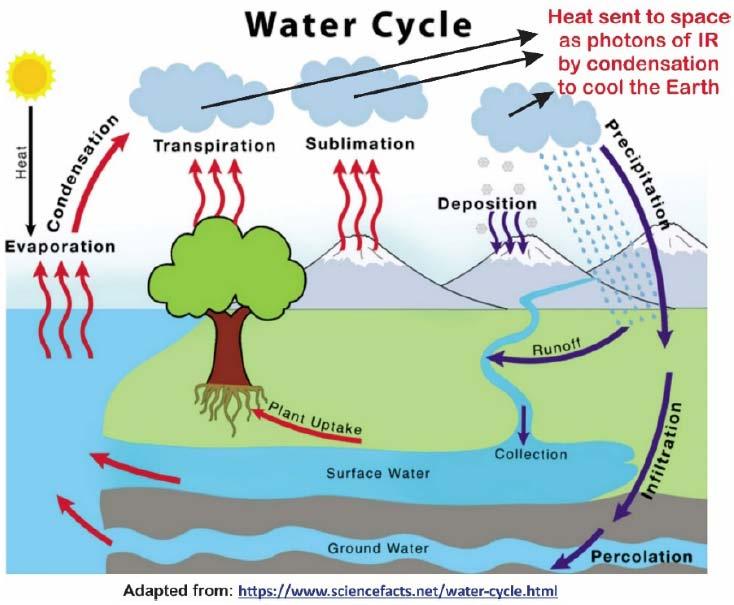
9: The Earth's water cycle shows evaporation and energy sent to space.
Although Figure 9 shows gentle clouds, much of the water vapor condenses from the estimated 40,000 thunderstorms per day and other large storms [16].
8. SUMMARY AND CONCLUSIONS.
Six serious errors were identified in the Intergovernmental Panel on Climate Change (IPCC) reports using well-known and proven chemistry, physics, and the scientific method.
• The IPCC's claim that rising levels of CO2 in the atmosphere can cause dangerous warming is false. The warming effect of CO2 is less than 0.01 °C, which is too small to measure.
• The warming effect of doubled CO2 is too small to measure. The equilibrium Climate Sensitivity (ECS) is near zero, not 1.5 to 4.5 oC.
• The warming effect of CO2 is not logarithmic as claimed by the IPCC. It is a straight line. It is irrelevant because the warming effect of CO2 is too small to measure.
• The Sun is the primary source of energy that warms the Earth. However, the energy level of the Sun is currently falling. As a result, Earth’s temperature is also falling.
• The IPCC seriously overestimates the warming effect of methane and nitrous oxide, which are minor and negligible.
• The Earth’s energy balance in Figure 7.2 of AR6 is incorrect because it is based on averages, and the energy required to evaporate water must be close to that sent to space.
Many governments accept these six IPCC mistakes as valid and make inappropriate policies based on them. These policies will produce disastrous results that will become obvious in time.
[1] Schantz H. Don't Shut Up And Calculate; Read Fields & Energy and Understand, interview at: https://treeofwoe.substack.com/p/dont-shut-up-and-calculateread-fields
[2] Friends of Science, There’s Big News in the World of Climate Science: Science – In Short. Available at: https://blog.friendsofscience.org/2025/08/31/theres-big-newsin-the-world-of-climate-science-science-in-short/.
[3] Christy J, Curry J, Koonin S, McKitrick, and Spencer R, A Critical Review of Impacts of Greenhouse Gas Emissions on the U.S. Climate, Climate Working Group, United States Department of Energy 2025. Available at: https://www.energy.gov/sites/default/files/202507/DOE_Critical_Review_of_Impacts_of_GHG_Emissions_o n_the_US_Climate_July_2025.pdf
[4] Lightfoot HD, Ratzer G. Earth’s Temperature: The Effect of the Sun, Water Vapor, and CO2. Journal of Basic & Applied Sciences 2022; 18: 87-97. https://doi.org/10.29169/1927-5129.2022.18.10
[5] IPCC, 2021: Climate Change 2021: The Physical Science Basis. Contribution of Working Group I to the Sixth Assessment Report of the Intergovernmental Panel on Climate Change. Masson-Delmotte V, Zhai P, Pirani A, Connors SL, Péan C, Berger S, Caud N, Chen Y, Goldfarb L,
Gomis MI, Huang M, Leitzell K, Lonnoy E, Matthews JBR, Maycock TK, Waterfield T, Yelekçi O, Yu R, Zhou B, Eds. Cambridge University Press, Cambridge, United Kingdom and New York, NY, USA, 2391. See A.4.4, page 11, and section A.1.3, page 5. https://doi.org/10.1017/9781009157896
[6] Lightfoot HD, Ratzer G, Only the Greenhouse Gas, Water Vapor, Measurably Warms the Earth. Journal of Basic & Applied Sciences 2024; 20: 87-91 https://setpublisher.com/index.php/jbas/article/view/2513
[7] Lightfoot HD, Ratzer G. Laws of Physics Define the Insignificant Warming of Earth by CO2 Journal of Basic & Applied Sciences 2023; 19: 20-28. https://doi.org/10.29169/1927-5129.2023.19.02
[8] Lightfoot HD, Mamer O. Calculation of atmospheric radiative forcing (warming effect) of carbon dioxide at any concentration in Energy and Environment 2014; 25(8).
[9] Lightfoot HD, Ratzer G. The Sun and the Troposphere Control the Earth’s Temperature. Journal of Basic & Applied Sciences 2023; 19: 163-173. https://doi.org/10.29169/1927-5129.2023.19.14
[10] Lightfoot HD, Ratzer G. The Sun versus CO 2 as the cause of climate change projected to 2050 Available at: https://setpublisher.com/pms/index.php/jbas/issue/view/86
[11] Shepherd SJ, Zharkov Si, Zharkova VV. Prediction of solar activity from solar background magnetic field variations in cycles 21-23. Published 2014 October 13 • © 2014. The American Astronomical Society. The Astrophysical Journal, Volume 795, Number 1.
[12] Abdussamatov K. Applied Physics Research 2012; 4(1). https://doi.org/10.5539/apr.v4n1p178
[13] Photon Energy Calculator, Formula, Photon Calculation, Available at: https://www.electrical4u.net/calculator/photonenergy-calculator-formula-photon-calculation/
[14] Lightfoot HD, Ratzer G. The Impact of the Hunga Tonga Volcanic Eruption on Earth's Temperature. https://doi.org/10.29169/1927-5129.2025.21.14
[15] Lightfoot HD, Ratzer G. Reliable Physics Demand Revision of the IPCC Global Warming Potentials, Journal of Basic & Applied Sciences, 2024, 20, 54-58. https://doi.org/10.29169/1927-5129.2024.20.05
[16] Lightfoot HD, Ratzer G The Sun Evaporates Water to Cool the Earth for Life to Flourish. https://doi.org/10.29169/1927-5129.2025.21.03