

Klimarealistene
Micheletsvei8B
1366Lysaker,Norway
ISSN:2703-9072
Correspondence:
1wavw@yorku.ca
2happer@princeton.edu
Vol.5.1(2025)
pp.1-12

Klimarealistene
Micheletsvei8B
1366Lysaker,Norway
ISSN:2703-9072
Correspondence:
1wavw@yorku.ca
2happer@princeton.edu
Vol.5.1(2025)
pp.1-12
W. A. van Wijngaarden1 and W. Happer2
1Department of Physics and Astronomy, York University, Toronto, ON, Canada
2Department of Physics, Princeton University, USA
Abstract
We briefly review the dominant role of clouds in Earth’s climate. The earliest observational studies of heat transfer through Earth’s atmosphere, for example, those of John Leslie around 1800, showed that clouds have a large effect on radiative heat transfer from Earth’s surface to space. Greenhouse gases also affect heat transfer, but much less than clouds. For example, “instantaneously doubling” CO2 concentrations,a100% increase, onlydecreasesradiationto space byabout1%.ToincreasesolarheatingoftheEarthbyafewpercent,lowcloudcoveronlyneeds to decrease by a few percent. The first half of this paper reviews observational facts about how cloudsaffectheattransfer.Thesecondhalfgivesabriefsummaryofthenew2n-streamradiation transfertheoryforquantitativelyanalysinghowcloudsscatterradiationincidentfromoutsidethe cloud,andhowtheyemitthermalradiationgeneratedbytheirparticulates.
Keywords:Pyranometer,Pyrgeometer,RadiativeTransfer,Clouds
Submitted2024-12-28,Accepted2025-01-02.https://doi.org/10.53234/scc202501/02
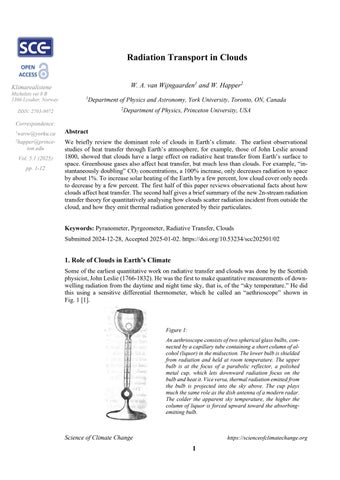
Some of the earliest quantitative work on radiative transfer and clouds was done by the Scottish physicist,JohnLeslie(1766-1832).Hewasthefirsttomakequantitativemeasurementsofdownwelling radiation from the daytime and night time sky, that is, of the “sky temperature.” He did this using a sensitive differential thermometer, which he called an “aethrioscope” shown in Fig.1[1].
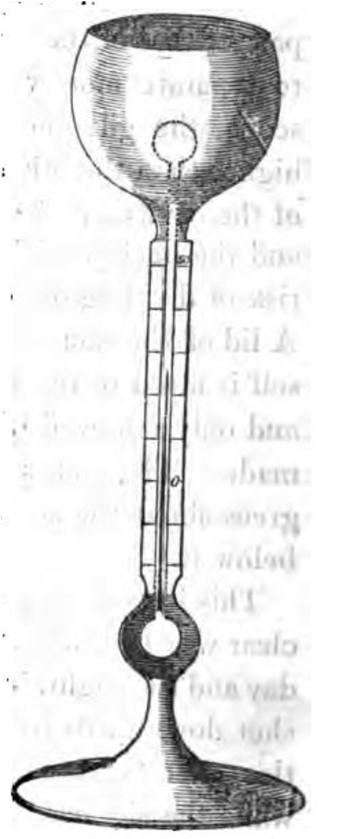
Figure 1:
An aethrioscope consists of two spherical glass bulbs, connected by a capillary tube containing a short column of alcohol (liquor) in the midsection. The lower bulb is shielded from radiation and held at room temperature. The upper bulb is at the focus of a parabolic reflector, a polished metal cup, which lets downward radiation focus on the bulbandheatit.Viceversa,thermal radiationemittedfrom the bulb is projected into the sky above. The cup plays much the same role as the dish antenna of a modern radar. The colder the apparent sky temperature, the higher the column of liquor is forced upward toward the absorbingemitting bulb.
Leslie noticed substantial increases and decreases of downwelling radiation as clouds passed overhead, as described by his words: “The sensibility of the instrument is very striking, for the liquor incessantly falls and rises in the stem with every passing cloud. In fine weather, the aethrioscope will seldom indicate a frigorific impression of less than 30 or more than 80 millesimal degrees (10 millesimal degrees = 1 C). If the sky become over clouded, may be reduced to as low as 15° or even 5° when the congregated vapours hover on the hilly tracts”[2].
Even in 1800, Leslie was well aware that there were two kinds of radiation in the atmosphere, sunlightwhichyoucouldsee,andthermalradiationgeneratedintheatmosphere,whichweshall call earthglow, which one cannotsee but can feelasradiant heat if it is sufficiently intense.Fig. 2 shows the spectral probability densities for short wave sunlight and for long wave earthglow. Thereisverylittleoverlapbetweenthetwoprobabilitydensities,whichareequalatawavelength of about = 4.2µm. Thiscanserveas aconvenientboundarybetween“short wave”radiationor sunlight, and “long wave” thermal radiation or earthglow emitted by Earth’s surface and atmosphere.
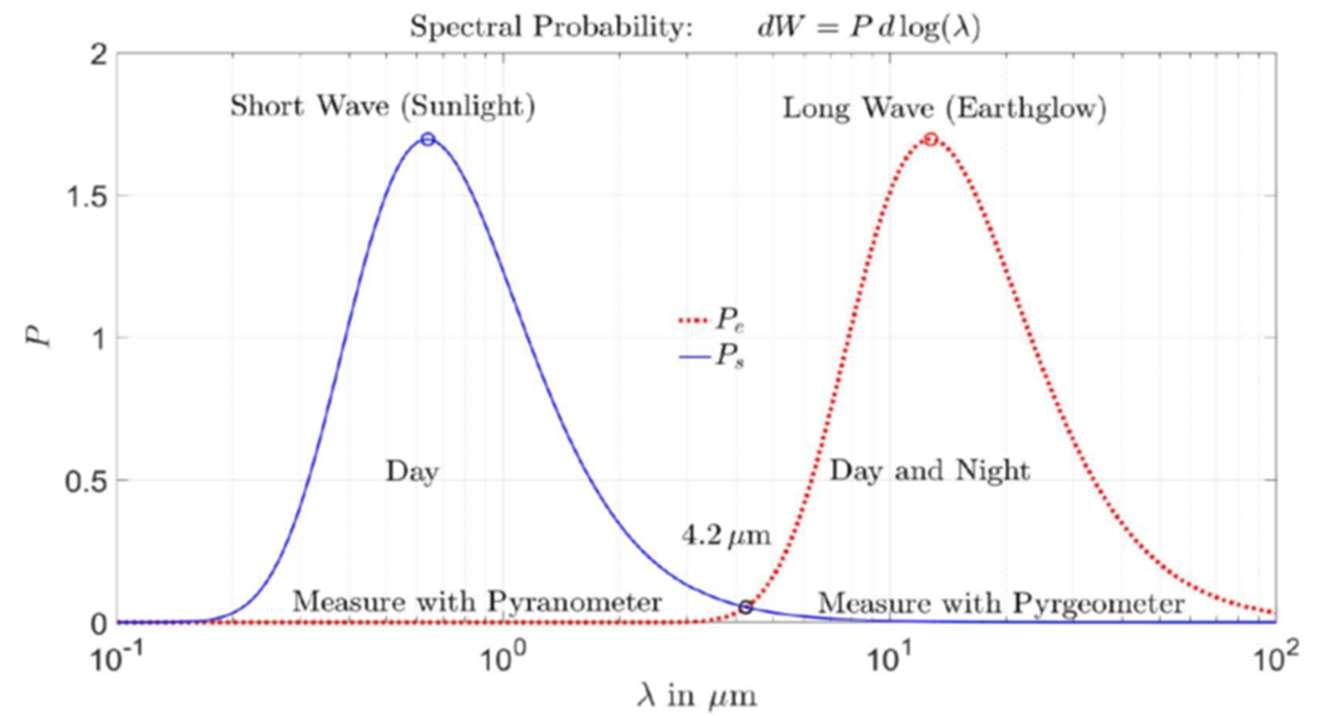
Figure 2: The spectral probability density for short wave sunlight, Ps , is shown as the blue curve and for long wave earthglow, Pe , as the red curve [3]. The increment dWi = Pi d log is the infinitesimal probability to find the radiation energy of sunlight (i = s) or earthglow (i = e) with wavelengths corresponding to the interval between log and log + d log . The probability curves assume thermal radiation at a temperature of Ts = 5772 K for sunlight and Te = 288.7 K for earthglow.
The two types of radiation can be measured with two types of instruments, a pyranometer for detectingsunlightanda pyrgeometer tomeasureearthglow.Leslie’saetherioscopewassensitive to bothdirect andscatteredsunlightaswellastothermalradiationemittedbyclouds andgreenhouse gases. It detected radiation from a relatively narrow range of directions near the vertical. Onemoderninstrumentthathasevolvedfrom the aetherioscopeisthe pyranometer, anexample ofwhichisillustratedinFig.3.
Figure 3: A pyranometer consists of a detector that absorbs solar radiation that is sealed by two glass domes to protect the sensor from the elements [4]. The instrument’s sensitivity depends on the wavelength response of the detector. Silicon-based diodes typically detect wavelengths in therange of 0.3 – 1.2 µm where most solar panels operate.

Figure 4: Pyranometer Measurements of Solar Flux at Earth’s Surface at Utah, USA in August. This data was obtained using a Campbell Scientific CS320 model pyranometer [5] and compared to that obtained using a thermopile.
Fig.4wasgeneratedbyCampbellScientific,apyranometermanufacturer.Itshowsthatformeasuring solar radiation, an instrument built with a sensitive photoelectric detector, CS320, yields resultsthatarenearlyidenticaltothatusingamuchlesssensitivethermopile.Theresultsshowa dramatic difference in shortwave radiation reaching the Earth’s surface for a clear sky as comparedtoanovercastday.ButMotherNatureissubtle.Paradoxically,Fig.5showsskieswithlots of clouds can increase the solar flux on some ground patches while decreasing it on others. The highly reflecting water droplets of the cloud edgesforward-scatter sunlight and add tothe direct irradiancefromthesun.
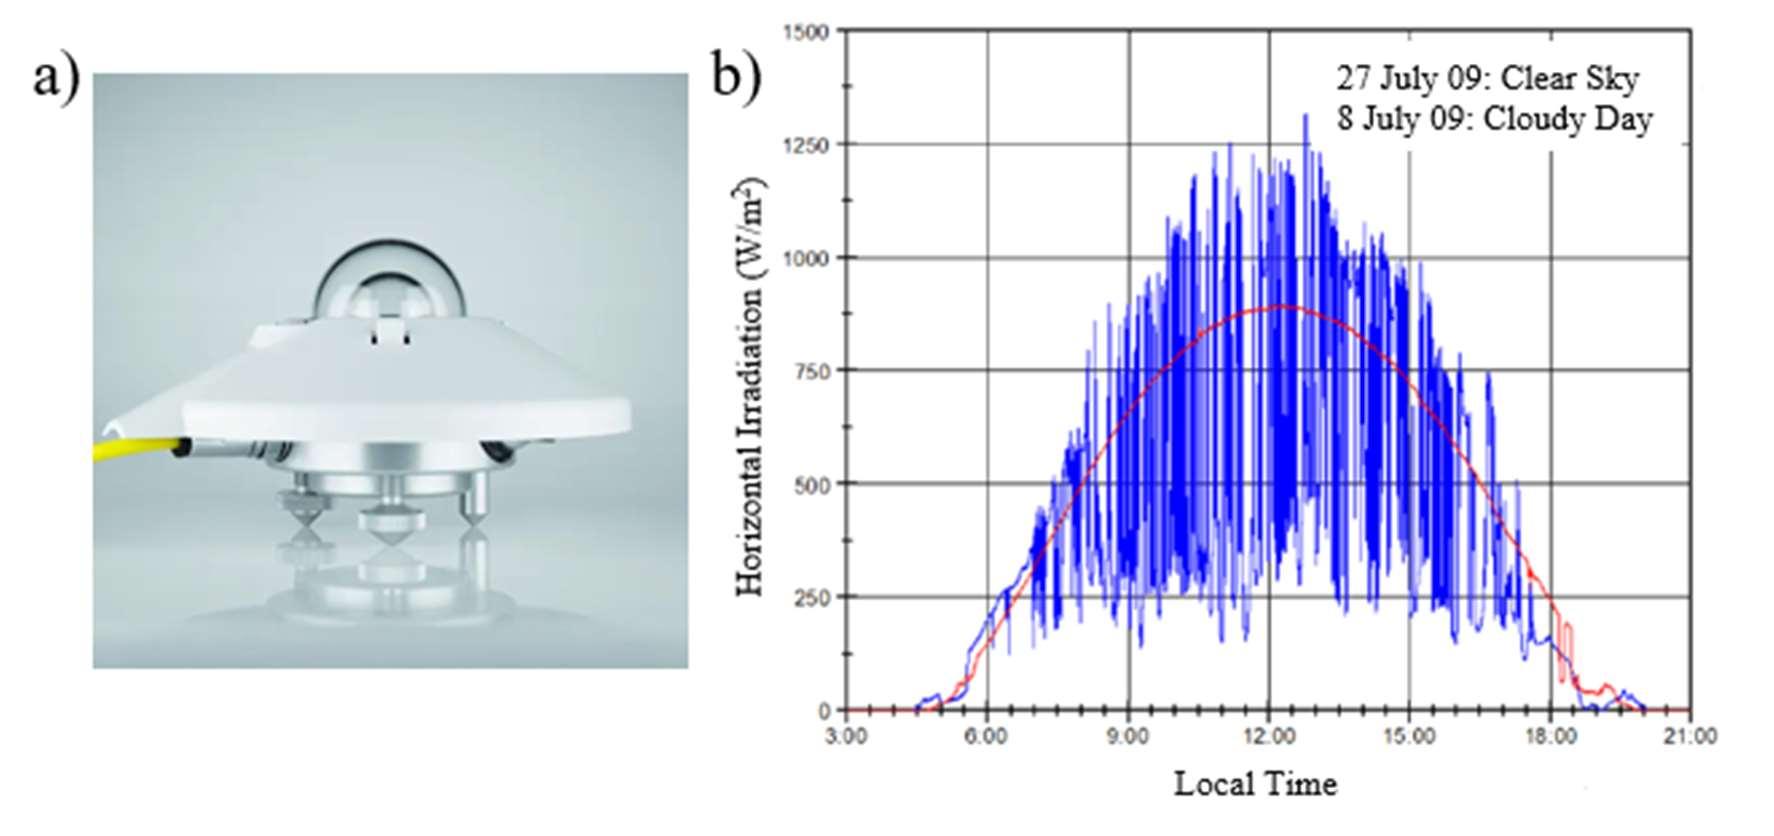
Figure 5: A Kipp & Zonen CMP22 Pyranometer [6] was used to show how clouds affect the solar irradiance measured at Munich Germany on July 8, 2009 when it was cloudy (blue) and July 27, 2009 when the sky was clear (red) [7]
An instrument thatcomplementsthe pyranometer isthe pyrgeometer illustratedin Fig. 6, which is designed to see only the downwelling flux from thermal emission by greenhouse gases and cloudsin theatmosphere.Asilicondomeandthin-film spectralfilterspreventallsolar radiation fromreachingthe detector,whichis“solarblind.” Butthedomeandfiltersadmitmost radiation withwavelengthsbetween4.2to50 m,whichincludesnearlyallatmosphericthermalradiation orearthglow. Upwardthermalradiationemittedfromthedetectorsurfacecanpassbackthrough thefiltersanddomeintothecoldsky.Theupward-facingdetectorsurfacewillnormallybecolder
W. van Wijngaarden, W. Happer: Radiation Transport in Clouds Science of
W. van Wijngaarden, W. Happer: Radiation Transport in Clouds
than the bottom since the sky is usually colder than the pyrgeometer. A modern pyrgeometer is designedtodojustwhatJohnLeslie’saethrioscopedid,tomeasurehowcoldtheskyis.
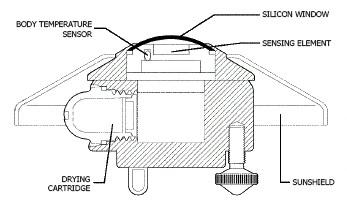
Figure 6: An instrument that complements the pyranometer is the pyrgeometer [8], which is designed to see only the downwelling flux from thermal emission by greenhouse gases and clouds in the atmosphere. A silicon dome and thin-film spectral filters prevent all solar radiation from reaching the detector,which is “solar blind.” However, the dome and filters admit most radiation with wavelengths between 4.2 to 50 µm, which includes nearly all atmospheric thermal radiation or earthglow.
Fig. 7 shows a two-week recording of downwelling thermal radiation measured with a pyrgeometer at Thule, Greenland in July. There is very little variation of downwelling radiation from daytonight. Butthereisalargedifferencebetweenclearandcloudyweather,withcloseto340 W/m2 downwellingfromcloudbottomsonovercastdaysandaround260W/m2inclearweather, wherethedownwellingcomesprimarilyfromthermalemissionofwatervapor,H2O,andcarbon dioxide, CO2. The cloud bottoms produce the same flux as a blackbody with a temperature of about5C. Theclearskyproducesthesamefluxasablackbodyatatemperatureofabout-13C. Figures 5 and 7 show downwelling radiation onto Earth’s surface. But upwelling radiation to spaceisqualitativelysimilar.
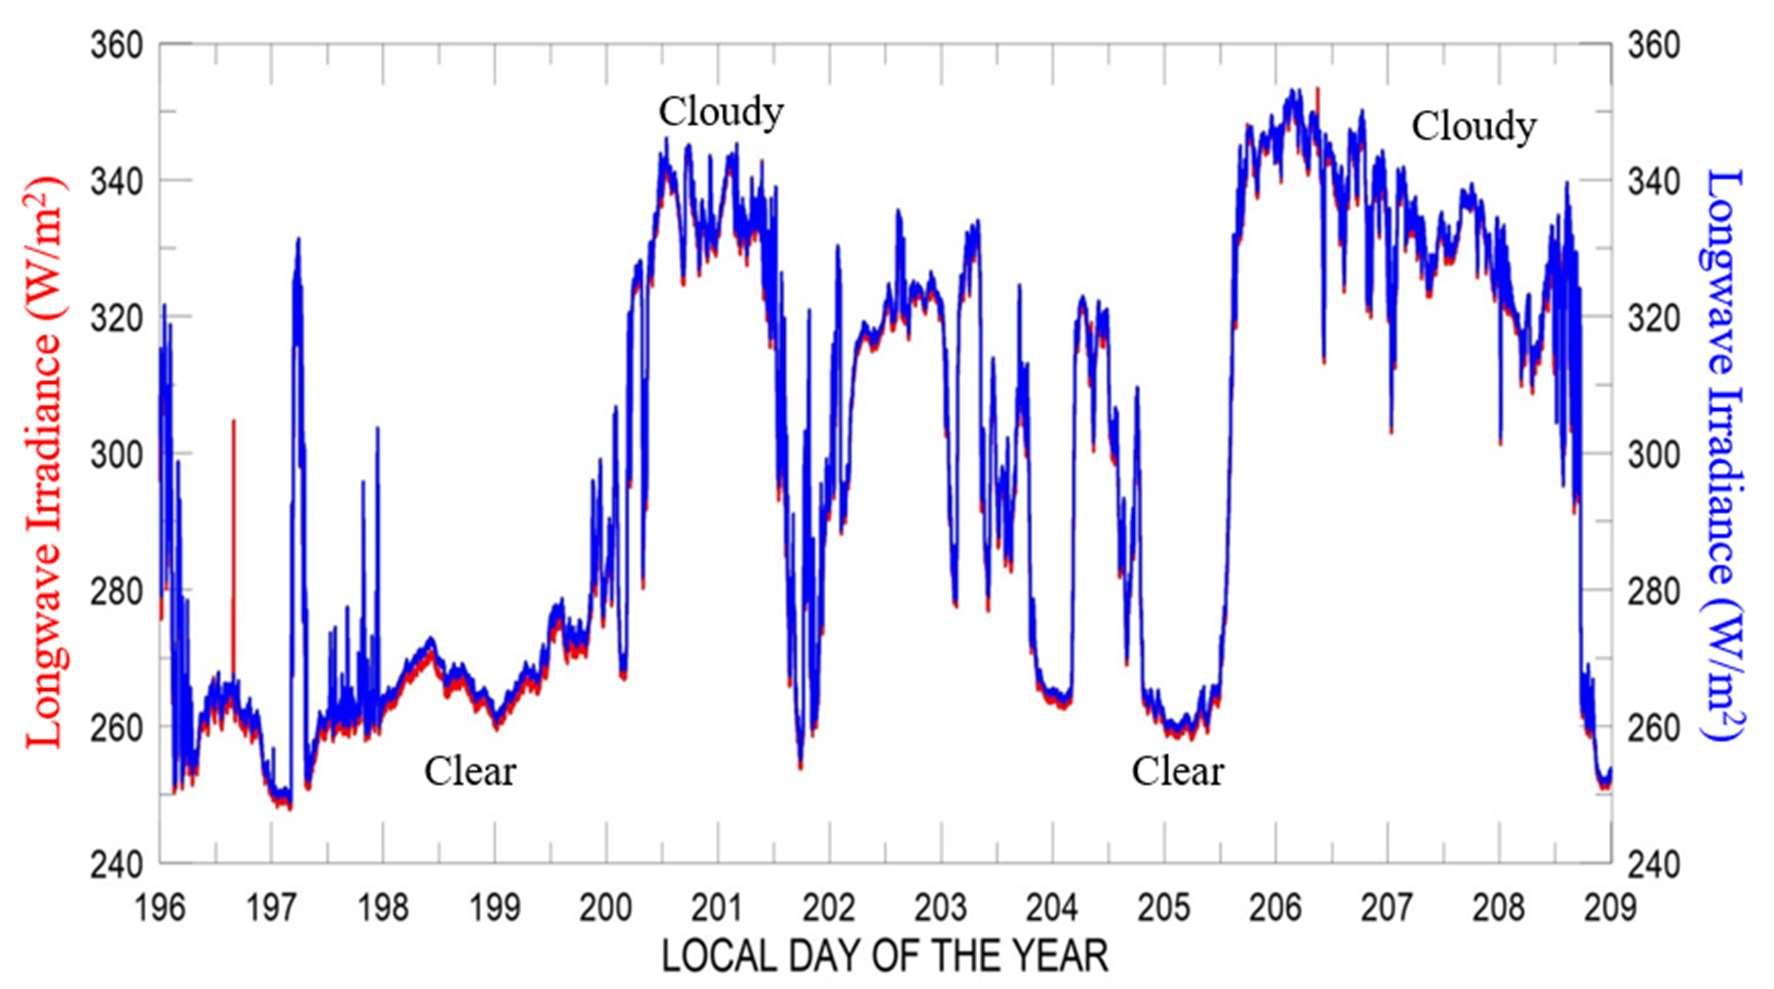
Figure 7: Comparison of downward longwave irradiance measured at the The Thule High Arctic Atmospheric Observatory (THAAO), Greenland in 2016 using two Kipp & Zonen Model CGR4 pyrgeometers calibrated in 2012 (red) and 2014 (blue) [9]. Note the suppressed zero on the vertical scale! The downwelling from cloudy skies is only about 30% greater than that from clear skies.
https://scienceofclimatechange.org
W. van Wijngaarden, W. Happer: Radiation Transport in Clouds
Fig. 8 shows longwave infrared and visible images of the Earth, recorded at the same time by a geosynchronous satellite parked in the equatorial plane above Ecuador. The right side of Fig. 8 showsbluesunlightatawavelengthof0.47 mdiffuselyreflectedinthelateafternoonretrieved at 6:12 pm in Princeton, New Jersey. Night has already descended on Europe and the eastern Atlanticsotherightsideoftheimageappearsdark.TheleftsideofFig.8showsthatEarth“glows inthedark,”atawavelengthof10.3 m,inthe“infraredwindow,”wherethereislittleabsorption bygreenhousegasesincloud-freeskies.Somuchheatisstoredupfromthepreviousdaythatthe nighttime side of the globe on the right is just as bright with longwave radiation as the daytime side on the left. Like the pyrgeometer measurements of downward earthglow in the previous viewgraph,theearthglowseenfromspacehasnearlythesameintensitydayornight.
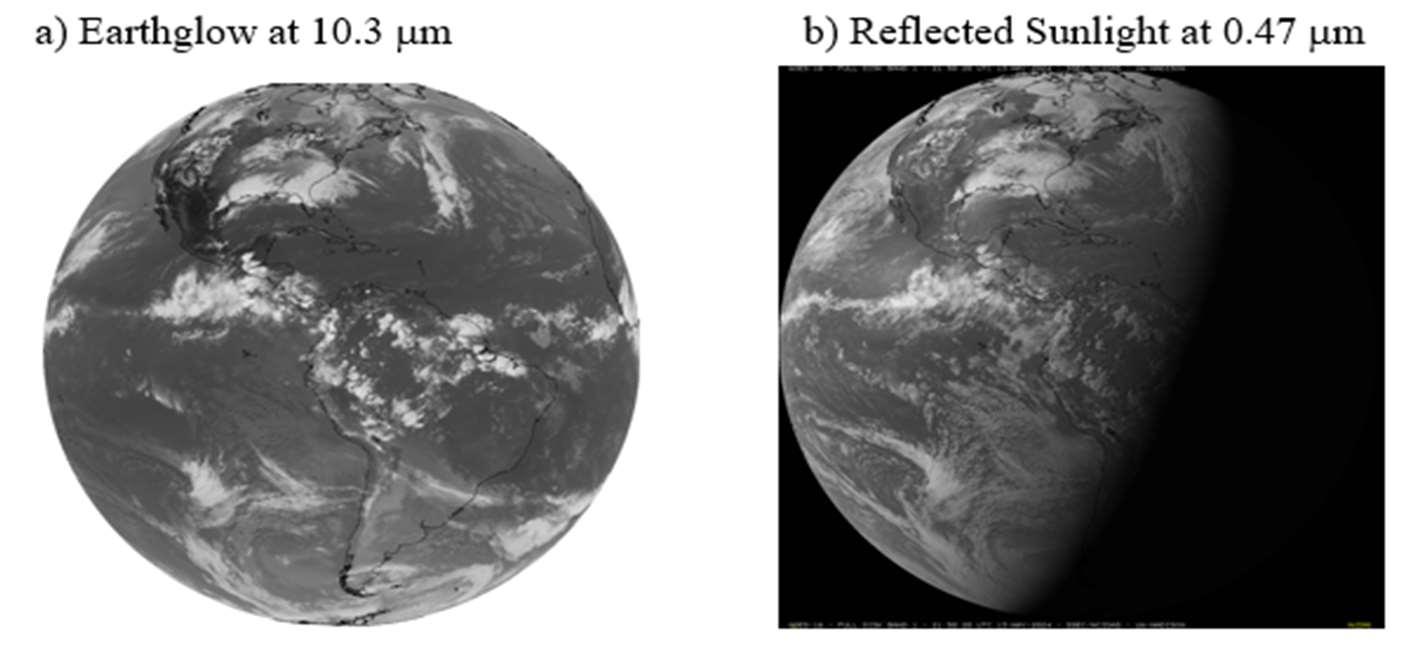
Figure 8: Satellite images retrieved at 6:12 pm EST on May 13, 2024 [10] of a) Earth-glow measured at 10.3 m and b) reflected sunlight measured at 0.47 m.
TherightcolumnofFig.9showsspectraoflongwavethermalinfraredradiationthatreachesthe satellite from a cloud-free area of the Earth. On the left are theoreticallymodelled spectra. One canhardlytellthedifferencebetweenthemodelledandobservedspectra.
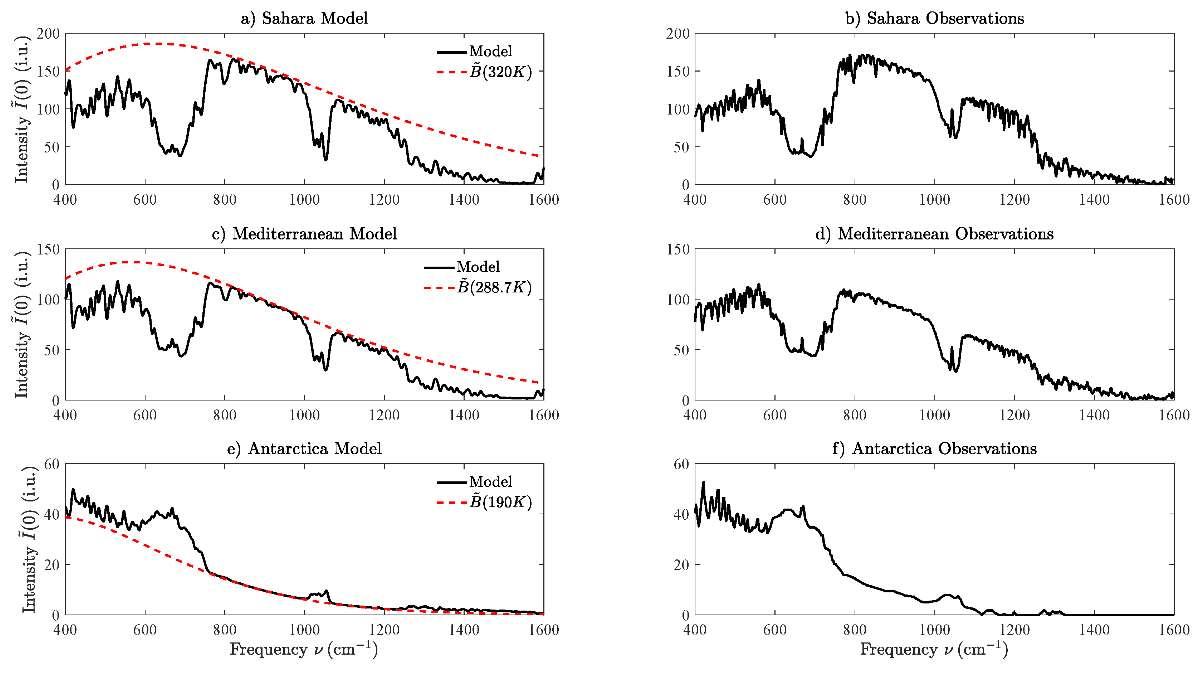
Figure 9: Comparison of modeled for a clear sky with data observed by a Michaelson interferometer in a satellite over the Saharan desert, the Mediterranean and Antarctica [11]. The intensity unit is 1 i.u. = 1 mW m-2 cm sr-1. Radiative forcing is negative over wintertime Antarctica since the relatively warm greenhouse gases in the troposphere, mostly CO2, O3 and H2O radiate more to space than the cold ice surface at a temperature of T = 190 K, could radiate through a transparent atmosphere.
Science of Climate Change
https://scienceofclimatechange.org
W. van Wijngaarden, W. Happer: Radiation Transport in Clouds
ThetopoftheatmospherefluxescomefromsolutionsoftheSchwarzschildequation[12] �� �� ������(��,��)=��(��)[��(��)−��(��,��)]
fortheintensity I(z,) withdirectioncosine = cos ,atthealtitude z,where istheattenuation absorptioncoefficientandthePlanckintensityis B(z) [13]. = 0 correspondstoupwardsintensity while = correspondstodownwardintensity. Fig.10showsthefrequencydependenceofthe spectralfluxatthetopoftheatmosphereforthecaseofacloudlessskyforvariousconcentrations ofcarbondioxide.
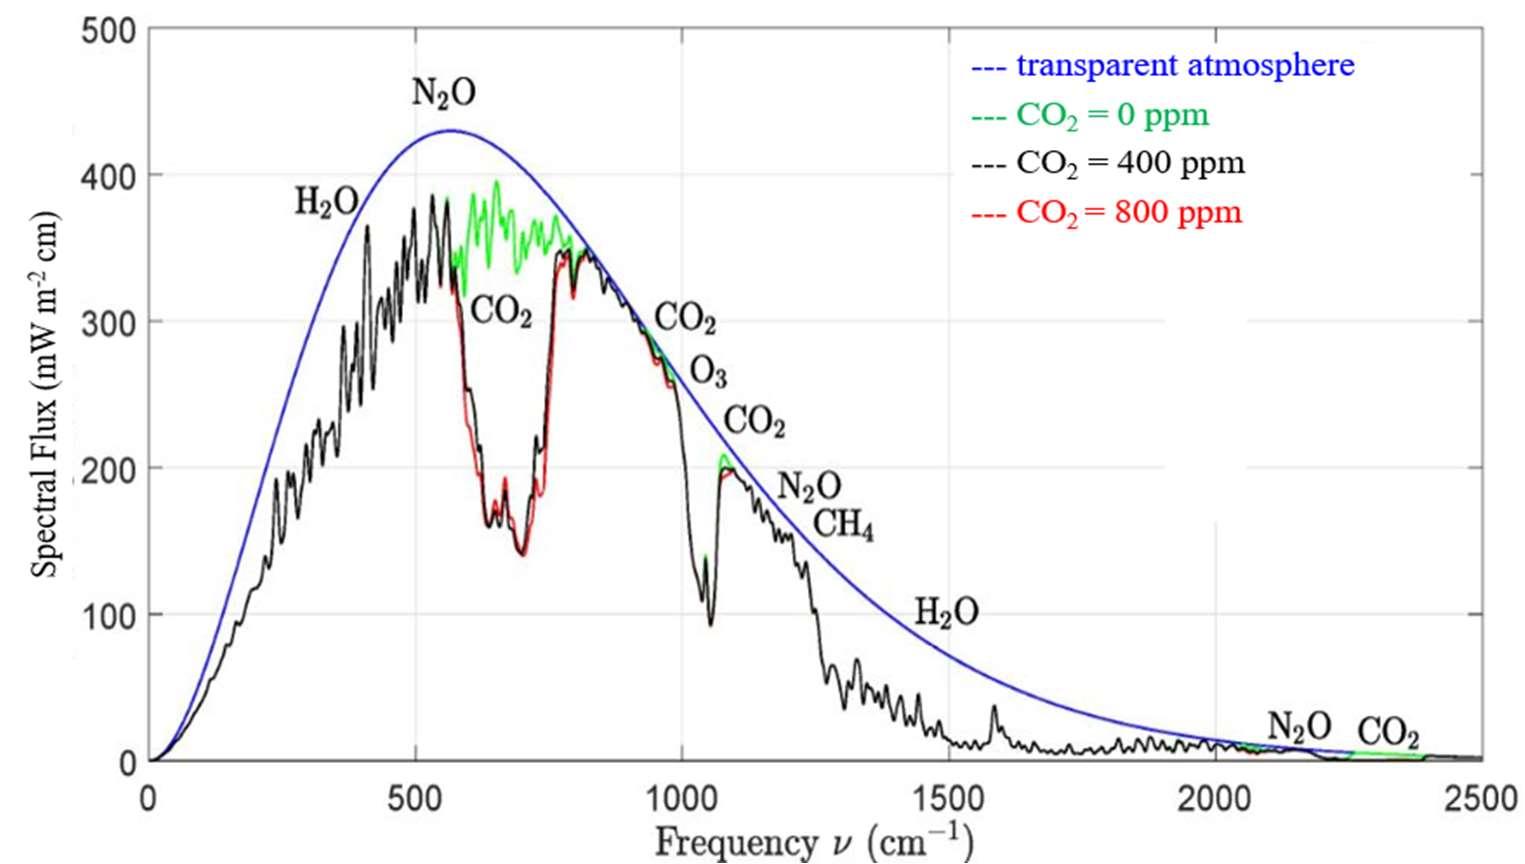
Figure 10: Effect of changing concentrations of carbon dioxide CO2, on the spectral flux at the top of the atmosphere [11]. The smooth blue line is the spectral flux from a surface at the temperature of 288.7 K for a transparent atmosphere with no greenhouse gases. The green line is with all CO2 removed but with all the other greenhouse gases at their standard concentrations. Similarly, the black and red lines were found for CO2 concentrations of 400 and 800 ppm, respectively. Doubling the concentration of CO2 from 400 to 800 ppm would cause a forcing increase (the area between the black and red lines) of 3.0 W/m2
To model radiation inside and outside of clouds, one must also take scattering of radiation into account. Thisisdescribedbytheequationoftransfer[14]
′ ��(��,��,��)��(��,��)=[1−��(��)]��(��)
Here,theindependentvariablesare r=spatiallocationinatmosphere;∇=������ ⁄ n=directionalunitvector,centeredinsolid-angleincrement��Ω=sin����������
The“knowns”atthespatiallocationrare
��(��)=attenuationcoefficientfromscatteringandabsorption
��(��)=singlescatteringalbedo(fractionscatteredinsteadofabsorbed)
��(��)=Planckintensity;dependsonlocaltemperature T(r)
��(��,��,��)= phase function; ��(��,��,��)����′/4�� is probability to scatter radiation from initial direction�� intosolid-angleincrement���� centeredonfinaldirectionn
https://scienceofclimatechange.org
W. van Wijngaarden, W. Happer: Radiation Transport in Clouds
Theunknownis
��=��(��,��)=Intensityorradiancealongunitvectornatspatiallocationr
Thesolutionofthisintegrodifferentialequationisdiscussedinourpaperson2n-StreamRadiative Transfer [15] and Radiative Transfer in Cloud Layers [16]. Despite the vast funds poured into climate research, the properties of clouds needed to solve the equation of transfer can only be described as “knowns” in quotation marks. Single scattering albedos, , phase functions, p, attenuationcoefficients, α,andotherpropertiesofcloudparticulatesarenotverywellknownfrom experimentalobservations.
MonteCarlosimulationscangivequalitativeinsightintosolutionsoftheequationoftransferfor justaboutanycomplicatedstateofacloudyatmosphere[17]. Foramoresystematic,quantitative understanding one can find analytic solutions for simplified limiting situations, which preserve mostoftheimportantphysicsoftheproblem.Weapplyatechniquewecallthe2n-StreamRadiative Transfer that solves the radiative transfer equation for a 1-dimensional column of atmosphere[15,18,19].
Thebasicideaof2n-streamradiativetransfertheorywasdevelopedin1943byGianCarloWick [20]to analyze neutron transport by multiple scattering. Wick’s two key steps were to first consideronlyaxiallysymmetricradiationtransfer,i.e.,theintensity I (r,n) I (z, μ)andnextevaluate the scattering integral with a sum on 2n sample values i of the direction cosines , a socalledGaussianquadrature[21].
Wick’s sampling is closely analogous to Shannon-Nyquist sampling of communications signals [22]. But unlike the equally-weighted Shannon-Nyquist sample times, each of the 2n Gauss-Legendresampledirectioncosines μi hasadifferentweight wi givenintermsoftheLegendrepolynomials Pl by
Scattering and emission can then be represented by 2n x 2n matrices which describe how 2n incidentbeams are scatteredinto2noutputbeams.For2n-streamradiationtransfercalculations, the axiallysymmetricphase function,��(��,��),is replacedbya2nx2nmatrixof samplevalues ��(��,�� ), evaluated at the Gauss-Legendre direction cosines, μi and μi’. Some examples are showninFig.11.
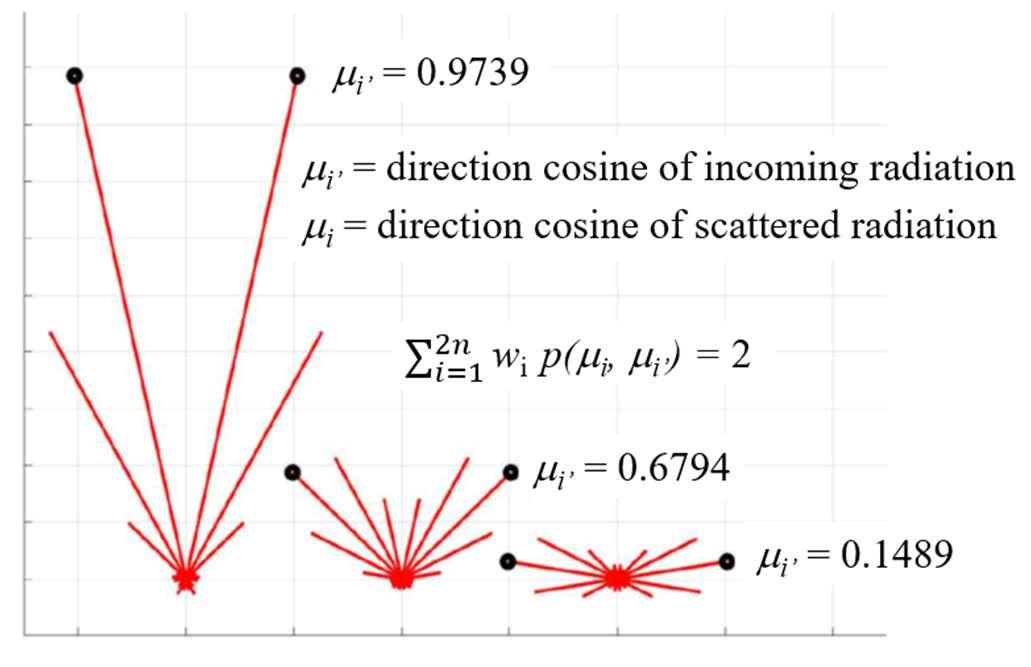
11: Forward Scattering Phase Function p(i,i’) for Cloud Particulates [1].
For simplicity, we assume only 2n = 10 streams of axially symmetric radiation. Scattering for threedifferentinputdirectionsareshown,highlyverticalontheleft,highlyhorizontalontheright and intermediate in between. This example is the maximum forward-scattering phase function, thatisnonnegativeforanyinputoroutputdirectioncosines,andthatcanbeconstructedfromthe firstsixLegendrepolynomials, P0 , P1 , …, P5 . Acceptablephasefunctionsarerotationallysymmetric,nonnegativeandsatisfythesumruleshowninFig.11.
When solving the equation of transfer, it is convenient to make a distinction between radiation that is generated by thermal emission of molecules and particulates inside the cloud, which we denoteby��andradiationinthecloudthathascomefromexternalsourceslikesunlight,orthermal emission of Earth’s surface, which we denote by ��. Fig. 12 illustrates the difference between �� and��.
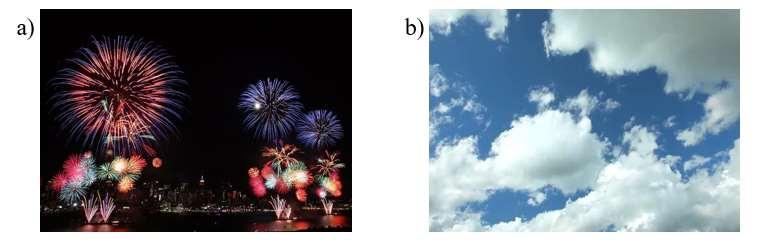
Figure 12: The left figure (a) shows thermal emission, i.e. visible light emitted by very hot atoms or particulates, in this example by fireworks, but also by lightning, aurora etc. Long wave infrared radiation is emitted by greenhouse gas molecules and particulates at normal atmospheric temperatures. The right figure (b) shows scattered white sunlight from particulates of water or ice (clouds), and blue, Rayleigh-scattered sunlight from N2 and O2 in cloud-free air. Scattered long wave infrared radiation comes onlyfromparticulates,forexample,thewateroriceparticulatesofclouds. Thereisnegligiblescattering of long wave radiation by molecules.
Fig.13showsacalculationdonewith2nscatteringtheory.Inthisexample2n=10.Anisothermal cloudlayerislocatedbetweenthegreenlinesatopticaldepths0and8abovethebottom.Incident radiationisgeneratedbyablackbodylocatedbelowthecloud.
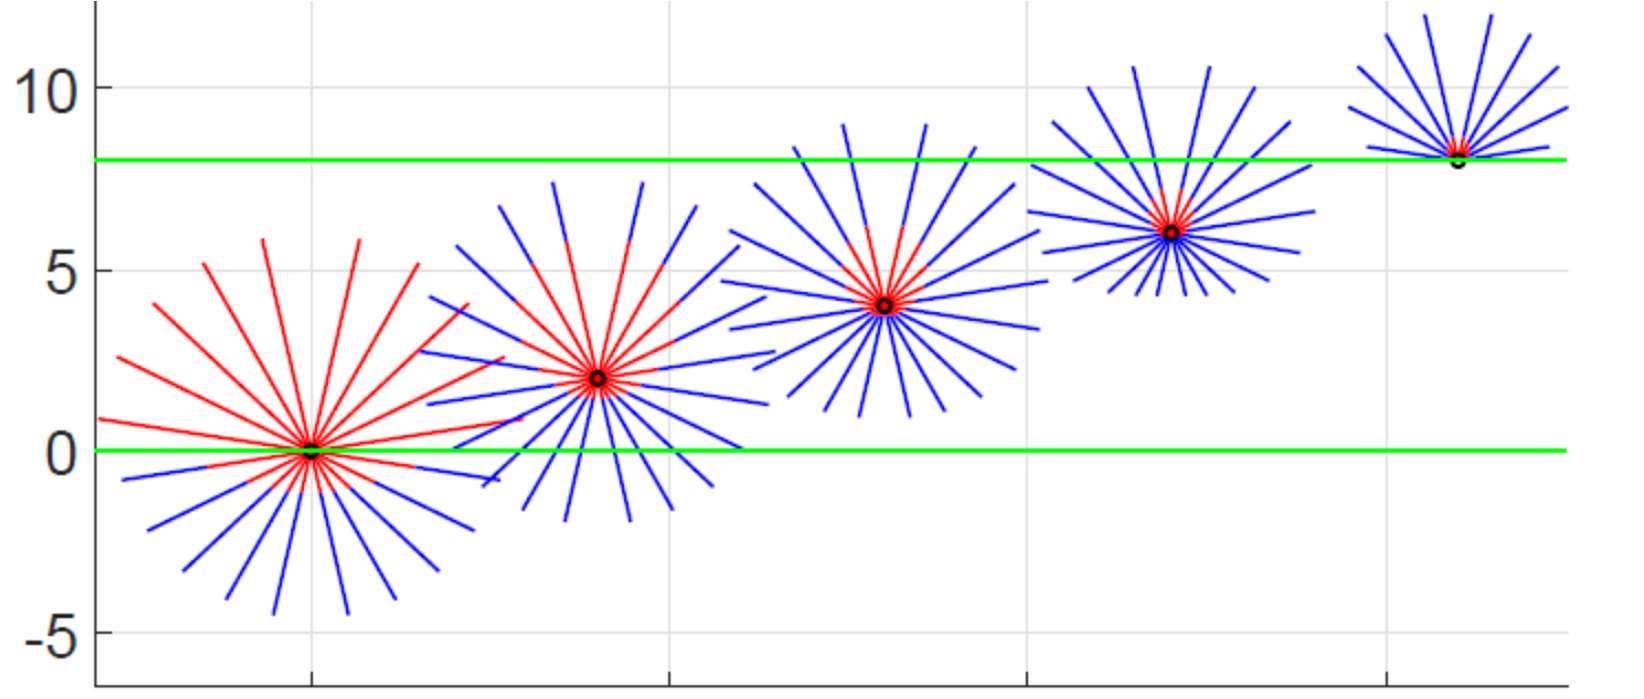
Figure 13: Scattering in an isothermal cloud. The green lines show the bottom and top of a cloud layer at optical depths = 0 and = 8. The blue rays show intensities thermally generated by isothermal cloud particulates with a Planck Intensity B. The red rays show incident and scattered intensities from a black body located below the cloud. The black body is warmer than the cloud and has a 20% larger Planck intensity.
Forstudiesofclimate,thebehaviorofradiationinsideacloudisoflittleimportancecomparedto thepropertiesofradiationescapingfromthecloudtoptospaceorfromthecloudbottomtoirradiate Earth’s surface. The external incoming intensity ��{in}, consisting of n upward external streamsincidentonthebottomofthecloudandndownwardexternalstreams,incidentonthetop ofthecloudgeneratesanoutgoingintensity��{out} consistingofnupwardscatteredstreamsemergingfromthetopofthecloud,andndownwardscatteredstreamsemergingfromthebottomofthe cloud. The constant of proportionality between the weighted 2n incoming streams ��{in} and 2n outgoing streams ��{out} is the 2n x 2n scattering matrix S. For real clouds, some fraction of the incomingradiationisalwaysabsorbedandheatsthescatteringparticulates.
For thermal radiation intensity, ��{out}, emerging from an isothermal cloud, the n upward streams emerging from the top and the n downward streams emerging from the bottom are proportional tothe2nstreamsoftheisotropicPlanckintensity B inthecloud.Theconstantofproportionality istheemissivitymatrix Ɛ
Fig. 14 shows on the lower left side the incoming radiation (red) into the bottom of the cloud shown in Fig. 13. On the lower right of Fig. 14 is the outgoing scattered radiation out of the top and bottom of the cloud layer shown in Fig. 13. Thermal radiation (blue) generated in the cloud isemittedisotropicallyasillustratedinthetopleftofFig.14.Theupperrightdiagramshowsthe thermal radiation that escapes from the top and bottom of the cloud. Note the thermal radiation rays that are emitted closest to the horizontal direction travel a greater distance in the cloud and thereforeexperiencegreaterabsorptionthantheraysdirectedupward/downward.
InaninterestinggeneralizationofKirchhoff’slaw[23]to2n-streamscatteringtheory,thesumof the scattering matrix S andthe emissivity matrix Ɛ is the identity matrix 1, that is S + Ɛ =1. The effectsofthescatteringmatrix S andemissivitymatrix Ɛ usedinFig.13areshowninFig.14.
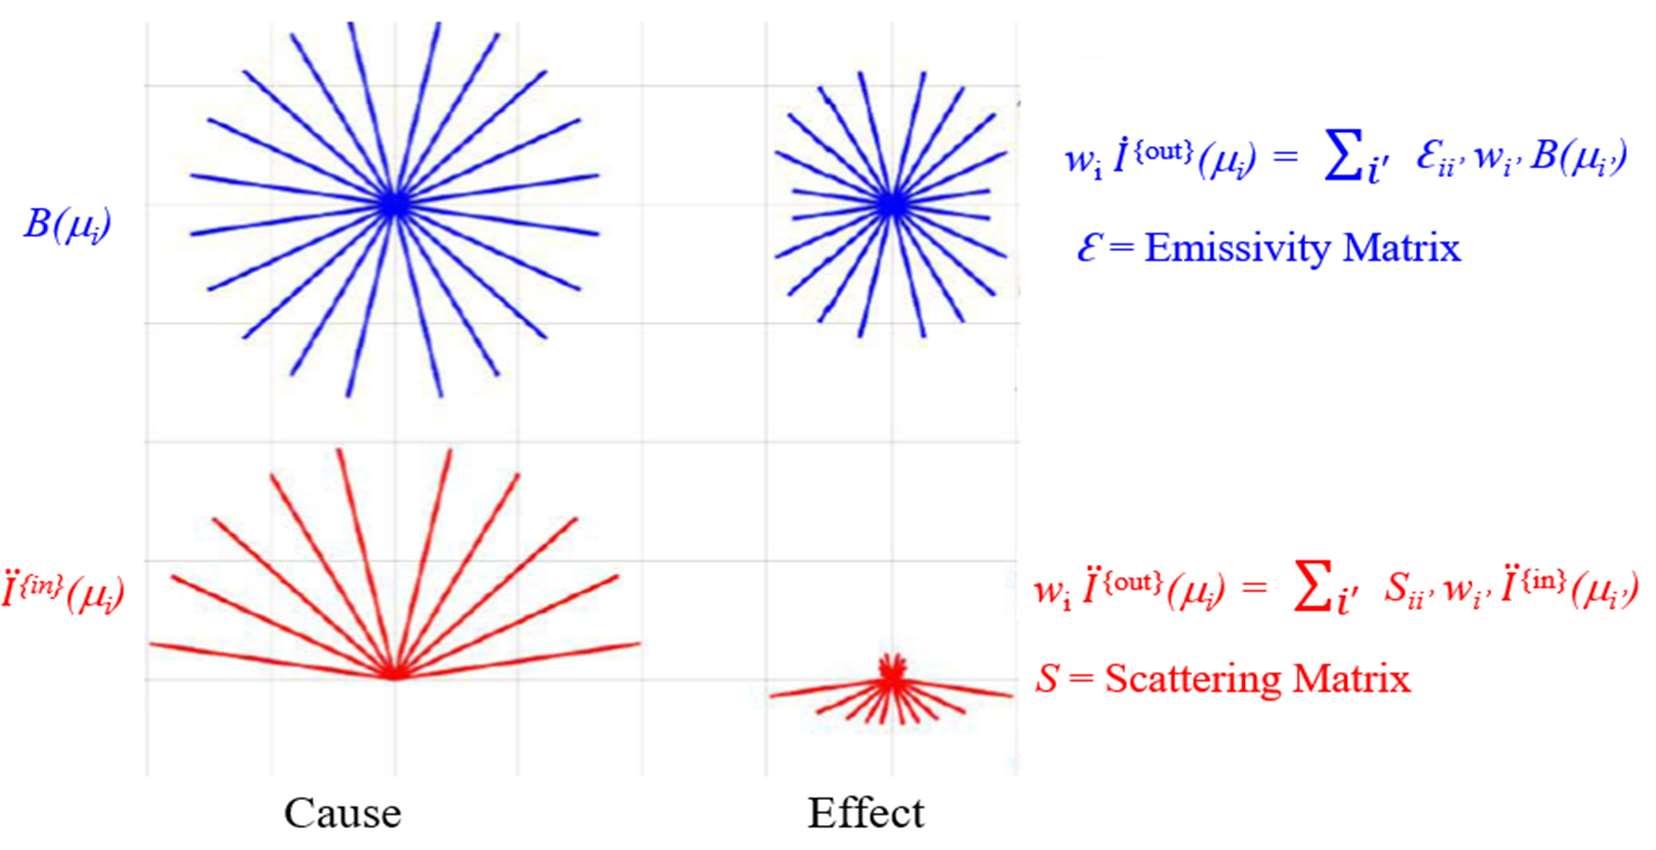
Figure 14: The left side shows the incoming radiation (red) into the bottom of the cloud shown in Fig. 13 as well as thermal radiation (blue) that is generated isotropically inside the cloud. The right side shows the effect of scattering and absorption. The scattering S and emissivity Ɛ matrices sum to unity in accordance with Kirchhoff’s law.
In conclusion, radiative transfer theory shows that doubling the concentration of the most important anthropogenic greenhouse gas, carbon dioxide, for a cloudless sky only decreases radiationtospaceby1%.However,cloudscovermorethanhalftheplanet[24]asshownbytheiconic BlueMarble photograph[25] inFig.15.Anincreaseinlowcloud cover of onlyabout 1%could largelycompensateforthedoublingofCO2 [26].
W. van Wijngaarden, W. Happer: Radiation Transport in Clouds
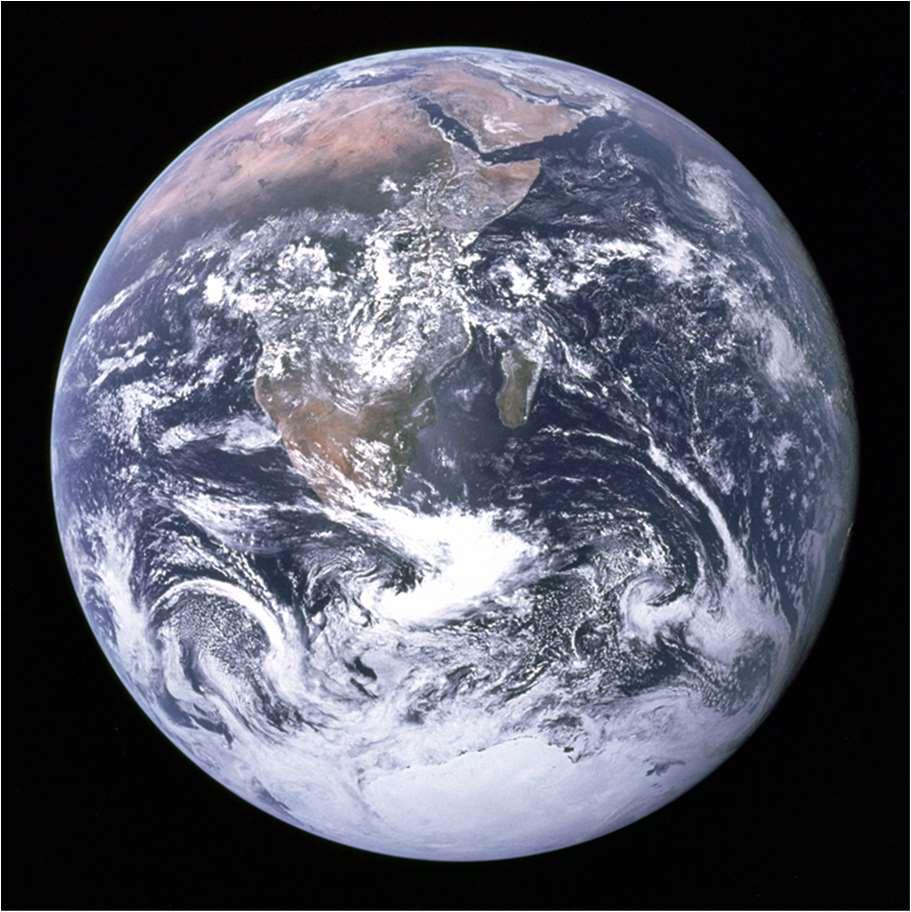
Figure 15: The Blue Marble [24]. A photograph of Earth and its clouds by lunar astronaut Harrison Schmitt taken on December 7, 1972.
2n-streamradiativetransfertheoryisaninvaluabletool tomodelcloudsandparticulatessuchas aerosolsthatscatterinfraredradiation.Itisessentialthataccuratemeasurementsofcloudparameterssuchasthe singlescatteringalbedo,opticaldepthandscatteringphasefunctionbemadeas these quantitiesareessential inputsintoanycalculation. The dependence oftheseparameterson infraredwavelengthaswellasanunderstandingofhowtheyvaryforcloudsatdifferentaltitudes or consisting of different amounts of water droplets and ice crystals is essential for meaningful progressinclimatemodelling.
Editor:HermannHarde
Acknowledgements-Funding
The Canadian Natural Science and Engineering Research Council provided financial support to oneofus.
References
1. John Leslie, https://en.wikipedia.org/wiki/John_Leslie_(physicist), accessed Dec. 11, 2024.
2. J.Leslie, A short account of experiments and instruments, depending on the relations of air, to heat, and moisture, (1813).
https://archive.org/details/shortaccountofex00lesliala.
3. M. T. Rose, A. N. Crossan & I. R. Kennedy, Sustaining Action and Optimizing Entropy: Coupling Efficiency for Energy and the Sustainability of Global Ecosystems, BulletinofScienceTechnology&Society,28,No.3,260-272(2006).
4. R. Mubarak, H. Schilke & G. Seckmeyer, Improving the Irradiance Data Measured by Silicon-Based Sensors,Energies,14,2766(2021).
https://doi.org/10.3390/en14102766.
Science of Climate Change
https://scienceofclimatechange.org
W. van Wijngaarden, W. Happer: Radiation Transport in Clouds
5. C. Stephens, Measuring the Sun More Accurately and Simply, Campbell Scientific (2017).https://www.campbellsci.ca/blog/measuring-sun-accurately-simply
6. Kipp & Zonen CMP22Pyranometer, https://www.otthydromet.com/en/p-kippzonencmp22-pyranometer/0362930,accessedDec.12,2024.
7. M. Zehner et al, Systematic Analysis of Meteorological Irradiation Effects (2010). www.researchgate.net/publication/237353475_Systematic_Analysis_of_Meteorological_Irradiation_Effects
8. Pyrgeometer,https://en.wikipedia.org/wiki/Pyrgeometer,accessedDec.12,2024.
9. D.Meloni, Shortwave and longwave broadband radiometers,TheThuleHighArctic AtmosphericObservatory(THAAO),Greenland,https://www.thuleatmos-it.it/instruments/radiometers/index.php,accessedDec.12,2024.
10. SSECGeostationarySatelliteImagery,https://www.ssec.wisc.edu/data/geo/#/animation
11. W.A.vanWijngaarden&W.Happer, Dependence of Earth’s Thermal Radiation on Five Most Abundant Greenhouse Gases, Atmospheric and Oceanic Physics, (2020) arXiv:2006.03098.
12. K. Schwarzschild, Űber Diffusion und Absorption in der Sonnenatmosphäre, Nachr. K.Gesell.Wiss.Math.-Phys.Klasse,195,41(1906).
13. M.Planck, The Theory of Heat Radiation,(1914),translatedbyM.Masius,(2nd ed.). P.Blakiston’sSon&Co.
14. S.Chandrasekhar, Radiative Transfer,Dover,NewYork(1960).
15. W. A. van Wijngaarden & W. Happer, 2n-Stream Radiative Transfer, Atmospheric andOceanicPhysics(2022)arXiv:2205.09713.
16. W. A. van Wijngaarden & W. Happer, Radiation Transfer in Cloud Layers, AtmosphericandOceanicPhysics(2023)arXiv:2310.10622.
17. J.Steinacker,M.Baes&K.D.Gordon, Three-Dimensional Dust Radiative Transfer, Annual Rev. Astron. Astrophys. 51, 63-104 (2013) doi: 10.1146/annurev-astro082812-141042.
18. G.E.Thomas&K.Stamnes, Radiation Transfer in the Atmosphere and Ocean,CambridgeUniversityPress,Cambridge,England(1999).
19. P.Eriksson,S.A.Buehler,C.P.Davis,C.Emde&O.Lemke, ARTS , the atmospheric radiative transfer simulator, Version 2,J. Quant. Spect.Rad.Trans.112(10):1551–1558(2011).
20. G.C.Wick, Űber ebene Diffusionsprobleme,Z.Phys.121,702(1943).
21. Gauss-Legendrequadrature, https://en.wikipedia.org/wiki/Gauss%E2%80%93Legendre_quadrature
22. C. E. Shannon, Communication in the presence of noise, Proceedings oftheInstitute ofRadioEngineers,37(1):10-21(1949).
https://en.wikipedia.org/wiki/Nyquist%E2%80%93Shannon_sampling_theorem
23. Kirchhoff’slawsofthermalradiation, https://en.wikipedia.org/wiki/Kirchhoff%27s_law_of_thermal_radiation
Science of Climate Change
https://scienceofclimatechange.org
W. van Wijngaarden, W. Happer: Radiation Transport in Clouds
24. CERES: Clouds and the Earth’s Radiant Energy System,https://ceres.larc.nasa.gov, accessed24Oct.2023.
25. https://en.wikipedia.org/wiki/The_Blue_Marble
26. NASAEarthObservatory, Clouds & Radiation, https://earthobservatory.nasa.gov/features/Clouds#:~:text=Low%2C%20thick%20clouds%20primarily%20reflect,the%20surface%20of%20the%20Earth,accessedDec.16,2024.
Science of Climate Change
https://scienceofclimatechange.org