
Published by SET Publisher
Journal of Basic & Applied Sciences ISSN (online): 1927-5129

Published by SET Publisher
H. Douglas Lightfoot1,* and Gerald Ratzer2
1The Lightfoot Institute, Canada
2Professor Em eritus, McGill University, Canada
Article Info:
Keywords: Hunga Tonga, Volcano, IPCC models, Satellite temperatures, Stratosphere,
Timeline:
Received: July 05, 2025
Accepted: August 10, 2025
Published: August 15, 2025
Citation: Lightfoot HD, Ratzer G. The impact of the Hunga Tonga volcanic eruption on earth's temperature J Basic Appl Sci 2025; 21: 136-140.
Abstract:
In January 2020, we published a paper [1] showing that the Intergovernmental Panel on Climate Change (IPCC) claimed that Earth’s temperature would reach 1.5 °C above pre-industrial days by 2030. At the same time, those who study the Sun, such as Valentina Zharkov, indicated that by 2030, the Earth's temperature would be much lower and close to pre-industrial times. The satellite temperature measurements of the Earth’s temperature are the best because they cover the whole Earth and minimize the urban heat island effect. This record shows that from January 2019 to January 2023, the temperatures dropped by approximately 0.5 °C, which indicates that the Earth is cooling. On January 15, 2022, the Hunga Tonga submarine volcano violently erupted, sending approximately 146 million tonnes of water into the stratosphere. This water reduced the heat flow to space. It increased the Earth’s temperature to a peak in April 2024 of approximately 0.45 °C above the safe upper limit of 1.5 °C above pre-industrial levels, as promoted by the IPCC. There was no disastrous effect. We are halfway to 2030, and there are serious problems with the IPCC estimate. It is recommended that the IPCC consider revising its estimates of the impact of CO2 on warming the Earth’s atmosphere.
DOI: https://doi.org/10.29169/1927-5129.2025.21.14
*Corresponding Author
E-mail: hdouglaslightfoot@gmail.com, contact@thelightfootinstitute.ca
© 2025 Lightfoot and Ratzer; Licensee SET Publisher.
This is an open-access article licensed under the terms of the Creative Commons Attribution License (http://creativecommons.org/licenses/by/4.0/), which permits unrestricted use, distribution, and reproduction in any medium, provided the work is properly cited.
This study hypothesizes that the current spike in global satellite temperatures, measured by the University of Alabama at Huntsville (UAH) [2], was caused by the Hunga Tonga submarine volcano explosion on January 15, 2022.
From mid-2022 through 2024, the media claimed these were the hottest years ever recorded, implying that increasing levels of carbon dioxide (CO2) caused the increase in temperature. The media ignored, and continues to ignore, the warming effect of the water injected into the stratosphere, and that it is now dissipating. Thus, the general public and many scientists do not know that colder times will come for a few decades.
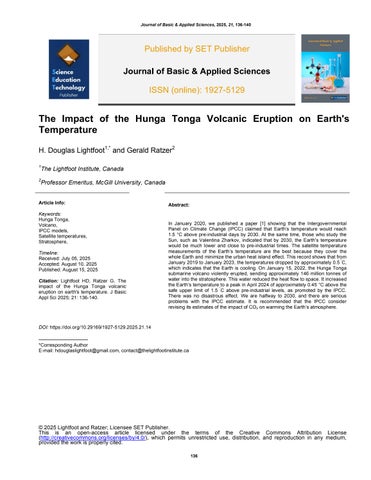
In 2022, the stratosphere's water vapor content rose after the massive explosion in the Western Pacific. One hundred forty-six million metric tonnes of water were blasted approximately 60 km into the air, forming ice crystals. The stratosphere usually has a low water vapor content, but the Hunga Tonga eruption added an extra 10%. The stratosphere is the section of Earth’s atmosphere above the troposphere where we live. See Figure 5 of Reference [3].
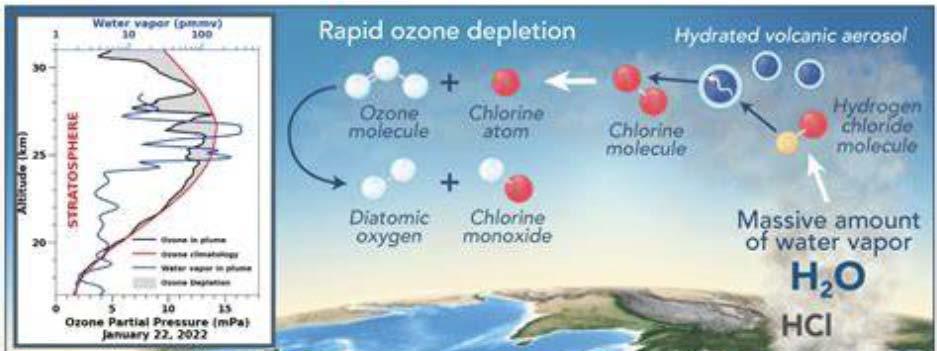
The National Oceanic and Atmospheric Administration (NOAA) sent a team of researchers into the southern Indian Ocean on the Island of Reunion the week after the explosion. They constructed Figure 2 based on their findings from balloon data collection. When examining this chart, start at the lower right-hand side and follow the arrows to the left to see the island of Reunion and the data collection site. The inset in the upper left shows a vertical cross-section profile of the stratosphere up to 31 km high. This graph, when integrated, is where the estimate of the 146 million tonnes of water vapor comes from.
Figure 2 shows the level of water vapor in the upper atmosphere in parts per million (ppm) from 2004 to 2025. The normal maximum level is 0.25 to 0.50 ppm, the darkest green color. The black area is above one ppm and can reach 10 ppm. The central black area starts on January 15, 2022, and gradually spreads around the Earth.
Figure 2 is the updated data record from the NASA Aura satellite. It shows the water vapor in the stratosphere, and an apparent increase in 2022 can be seen as the dark patch. Over a year, it spread globally, first in the Southern Hemisphere and then to the north. By the middle of 2024, the dark patch was beginning to
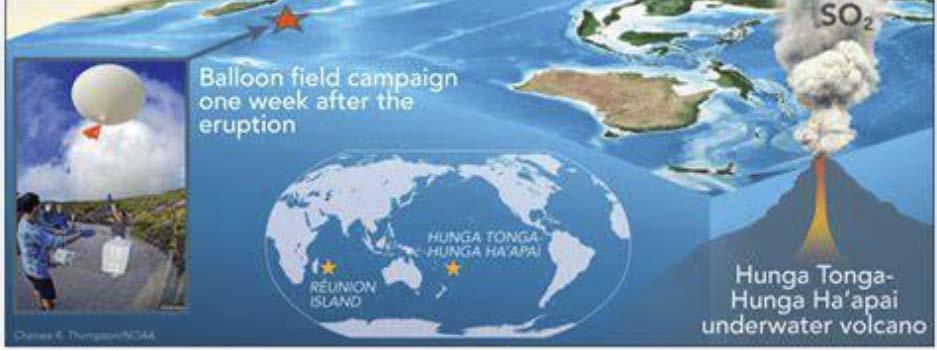
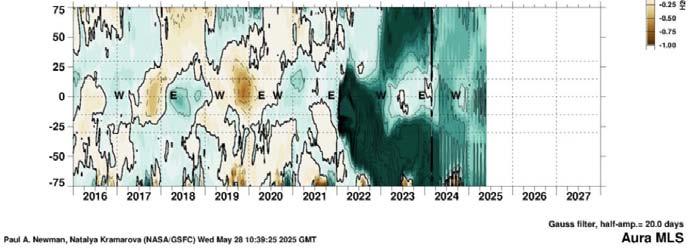
lighten up, showing a reduction in the water vapor content, which was now spread evenly around the globe. The dissipation continues.
Figure 3 shows the impact on global temperature. We consider the 45-year UAH satellite temperature record the best available data [2], with one reading per month.
Figure 3 shows the period from 2015 through the end of June 2025.
Figure 3 is a chart of those data points for the last few years, starting in 2015. The blue squares show the January readings, usually the lowest in the year, and the large red circles show the July readings, usually the highest for the year.

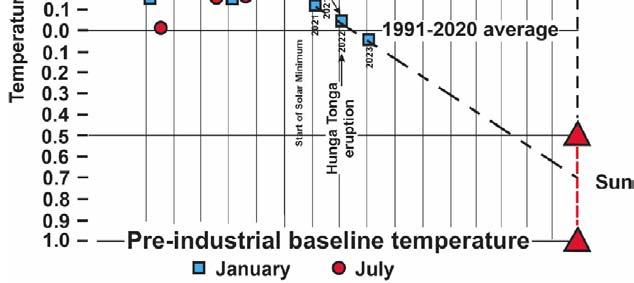
The baseline along the x-axis is the pre-industrial baseline temperature. The temperature projection by the IPCC in 2030 of a 1.5°C rise above that of preindustrial times is shown as “IPCC 2030”, on the right margin. A downturn in the temperature record can be seen starting in 2020. Then the July 2022 reading is an outlier, which we assert was due to the extra water vapor in the Stratosphere. From July 2023 onwards, there are 24 red dots, for two years of the monthly readings, at or above the 1.5°C IPCC projection. Note the red dot for April 2024; the maximum spike is 0.45 °C, above the 1.5 °C of IPCC. The Earth’s temperature values above the IPCC 1.5 °C caused no adverse effects. The July 2025 measurement by satellite is 0.58 °C below the peak in April 2024 and shows the Earth is cooling. As July is the hottest month of the year, the future temperatures in 2025 will be lower.
These 24 UAH readings for m an apparent spike, one of the highest temperature spikes over the last century. The red dots for February and May 2025 are 1.5°C above pre-industrial; the March and April ones are slightly higher. People who study the Sun predict the dashed line through the blue squares of January readings, pointing to the “Sun” in Figure 3
Figure 3 aims to determine whether the IPCC projection for 2030 was better than that of people who
study the Sun, such as Valentina Zharkova. At this point, and if this trend continu es, the IPCC's projection is showing weakness.
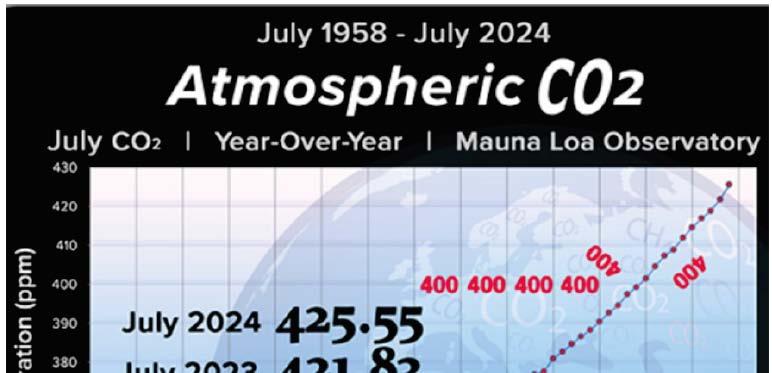
2024 was a very hot year, but not due to the slow rise of CO2 as in July 2023 and July 2024, as in Figure 4 . The increase might appear large in Figure 4 , because the y-axis starts at 310 ppm. However, the difference between July 2023 and July 2024 is negligible at 0.87%.
The attribution of the heat spike to the Hunga Tonga volcano is based on several different empirical data sources and meets the standard of the scientific method. Many references cover several aspects of the results of the underwater volcanic explosion. These references are: [6-12]. They support our assertion and add more details. Reference [8], by Javier Vinos, is a recent article recommended by Judith Curry.
Figure 3 gives the agriculture industry a “heads-up.” They are facing cooler growing temperatures, early damaging frosts, and crop failures, which require additional effort to maintain the World’s food supply.
The satellite temperature record from 2020 to 2025 reveals a significant cooling trend before the Hunga
Tonga eruption, followed by a sharp but temporary warming spike. This pattern suggests that short-term climate variability can be strongly influenced by natural events, such as volcanic eruptions, rather than solely by anthropogenic greenhouse gas emissions.
The eruption of the Hunga Tonga submarine volcano in January 2022 injected an unprecedented volume of water vapor into the stratosphere, contributing to a measurable increase in global temperatures. This warming episode peaked in April 2024, exceeding the IPCC’s 1.5 °C projection for 24 months. However, no catastrophic impacts were observed during this period.
These findings challenge the IPCC’s projections by demonstrating that natural forcings particularly stratospheric water vapor from volcanic activity can produce short- term warming effects that rival or exceed those attributed to CO ₂. This underscores the need for climate models to better account for episodic natural phenomena.
The observed temperature spike aligns with empirical data and is consistent with the scientific method. It supports the hypothesis that solar variability and natural feedback mechanisms may play a more significant role in climate modulation than currently acknowledged in mainstream climate assessments.
While this study does not dismiss the role of CO2 in climate dynamics, it highlights the importance of distinguishing between long-term anthropogenic trends and short-term natural variability. Future climate policy and modeling efforts should incorporate a broader range of natural influences to improve predictive accuracy.
The 24- month spike in the measured temperature record is uncorrelated with steadily rising CO2 levels, disproving any assertion that CO2 is a driver of global climate warming. This is a decisive counterexample to the IPCC position.
The agriculture industry has the information to plan for the future food supply as temperatures fall in the next few decades.
[1] Lightfoot HD, Ratzer G. The Sun Versus CO2 as the Cause of Climate Change Projected to 2050 Journal of Basic & Applied Sciences 2022; 18: 16-25. https://doi.org/10.29169/1927-5129.2022.18.03
[2] Latest global temperatures as measured by satellite. UAH is the University of Alabama at Huntsville. The record of satellite measurements is available at: Lower Troposphere: https://www.drroyspencer.com/wp-content/uploads/UAH_LT_ 1979_thru_July_2025_v6.1_20x9-scaled.jpg
[3] Lightfoot HD, Ratzer G. The Sun and the Troposphere control the Earth’s temperature Journal of Basic & Applied Sciences 2023; 19: 163-173 https://doi.org/10.29169/1927-5129.2023.19.14
[4] Figure 1 is from the NOAA Research website: https://research.noaa.gov/hunga-tonga-2022-eruption/
[5] Earth’s CO 2 homepage. Available at: https://www.co2.earth/
[6] NOAA Chemical Sciences Laboratory. Hunga Tonga-Hunga Ha'apai Volcano Eruption Research. Available at: https://csl.noaa.gov/news/topics/hthh.html
[7] AGU Advancing Earth and Space Science, JGR Atmospheres. Evolution of the Climate Forcing During the Two Years After the Hunga Tonga-Hunga Ha'apai Eruption. First published: 24 July 2024. https://doi.org/10.1029/2024JD041296
[8] Climate etc., Vinós J. Hunga Tonga volcano: impact on record warming, Posted on July 5, 2024 by curryja. Available at: https://judithcurry.com/2024/07/05/hunga-tonga-volcanoimpact-on-record-warming/
[9] Science. 12 May 2022. Atmospheric waves and global seismo-acoustic observations of the January 2022 Hunga Tonga eruption: https://www.science.org/doi/10.1126/ science.abo7063
[10] AGU. 4 November 2024.https://news.agu.org/pressrelease/new-trigger-tonga-eruption/
[11] Science Advances. 28 June 2023. Mesospheric pressure source from the 2022 Hunga Tonga eruption excites 3.6-mHz air-sea coupled waves. https://www.science.org/doi/pdf/ 10.1126/sciadv.adg8036
[12] Science. 7 September 2023. Fast and destructive density currents created by ocean-entering volcanic eruptions. https://www.science.org/doi/pdf/10.1126/science.adi3038