
ClimateAnalysis withAI - Part 2
Erik
Bye December 8, 2025
I recently presented an article describing the assistance by ChatGPT to construct a 3D scatterplot of CO2, HadCRUT and CH4: Here is the link.
Here is a description of how ChatGPT assisted in performing PCA analyses in combination with a detailed correlation analysis, with the same variables.
Technical details:
1. PCA = Principal ComponentAnalysis, a multivariate analysis of many objects characterized by many variables.
Purpose: To look for major trends in a data set, i.e. variance percentage explained; important variables, i.e. the loadings.
2. Correlation analysis:
Purpose: To look for coherent variation among important variables. These analyses do not imply causalities.
TheAnalyses
1. PCA
The dataset with the objects, i.e. the observations in each year, 1984 - 2022, of the variables: temperature, CO2 and the CH4 concentrations are listed in a 2-dimensional table. The columns are the years, and the rows are the variables/parameters.
Through the method of least squares we can find the direction, the best line, which explains most of the statistical variance in the data matrix. This is principal component one, i.e. PC1. This variance is withdrawn and the direction for the next best line is calculated, i.e. PC2. The component PC2 is calculated to be orthogonal to PC1.
In the present dataset, PC1 explained most of the variance: 97%, i.e. the main trend. PC2 explains only 3%. The results can be seen in the PC1 - PC2 plot, showing the object scores. This may be looked upon as a projection of the 3D room down to the 2D room:
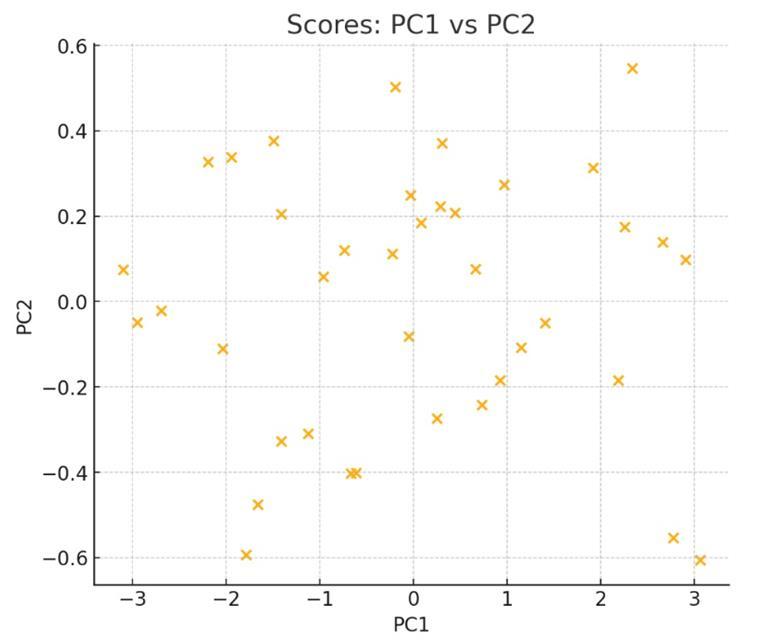
The points (objects) show a random distribution, and I asked ChatGPT if this showed almost zero correlation between the objects. But ChatGPT answered that only the two components PC1 and PC2 were uncorrelated, but not the objects. However, the orthogonality of the two components was calculated in this way and
the object score plot shows an uncorrelated distribution. There was no reason to continue to discuss this point any further.
Conclusion 1:
The main trend here is the time-trend, all the three variables increase monotonically.
PC1 explains 93% of this variance. The score plot of PC1 - PC2 shows no correlation between the observations, with the objects randomly distributed in the plot.
2. Correlations
The CO2 hypothesis says that the CO2 gas in the atmosphere is the cause of global warming.And now this is the key question in the scientific discussions.
The graphical pattern is shown by Ole Humlum, on climate4you.com. He has made a biplot, with the temperature and the CO2 level in the same plot, see Figure 2.
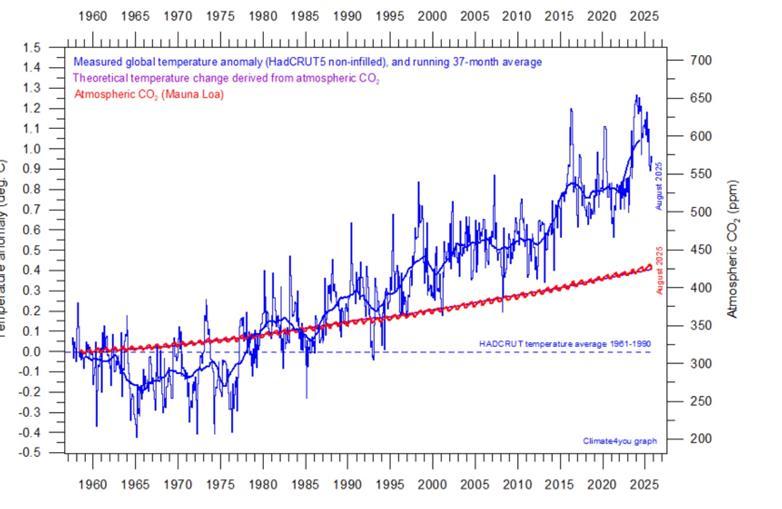
An experienced observer might attribute the increased gap at the higher temperatures as a decreased correlation. Proponents of the IPCC paradigm tend to deny this.
One way to verify the correlation is to calculate PCs for the Temperature and CO2 concentration, as shown in Figure 3.
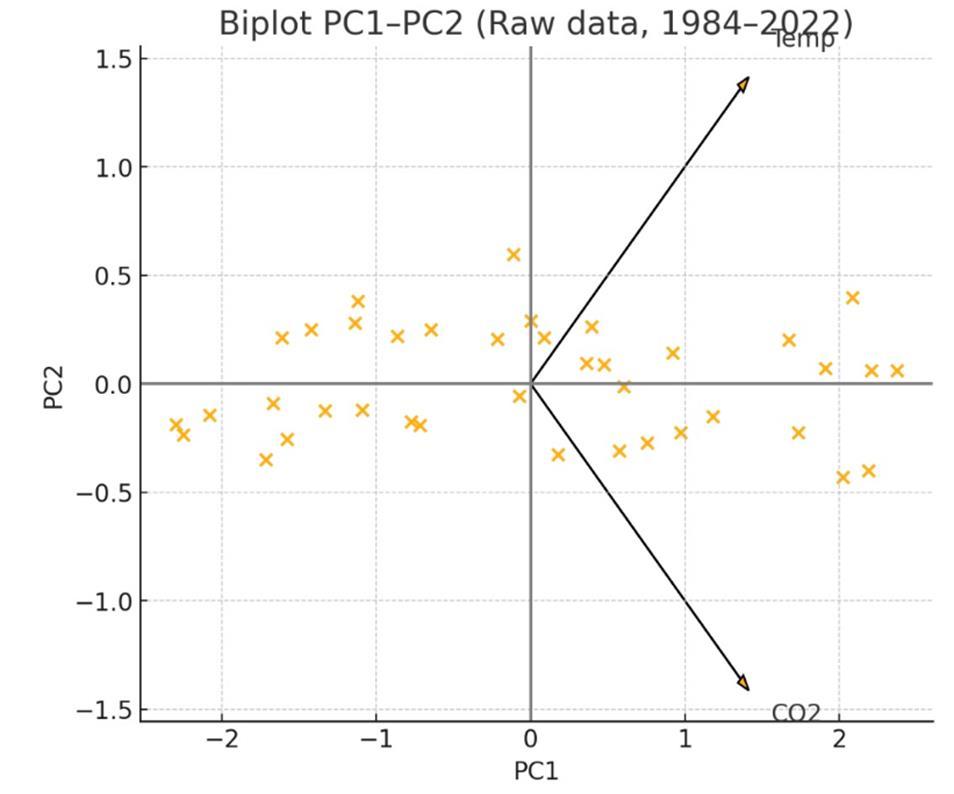
The angle between the two vectors, Temperature and CO2 concentration, is larger than 90˚, verifying the extremely low correlation.
An angle close to zero degrees is a strong correlation.An angle in the range 30 -70 degrees is a low correlation.At 90˚ the variables are orthogonal and completely uncorrelated. With an angle between 90 and 180 degrees the correlation increases further to 180 degrees. Then we have an inverse correlation, with the two factors pointing in opposite directions.
Conclusion 2:
The angle between the temperature and the CO2 level has been determined to be larger than 90˚. Therefore, the two variables are uncorrelated. The hypothesis indicating CO2 as the cause of global warming is thus falsified.
Reference:
PCA: https://en.wikipedia.org/wiki/Principal_component_analysis