National Neonatal Audit Programme (NNAP) Summary report on 2024 data
October 2025
Royal College of Paediatrics and Child Health
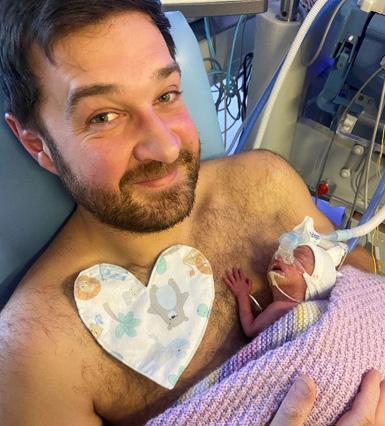
Photo courtesy of Mabel Micah
Front cover photo courtesy of Mabel Micah
NNAP Governance
Details of the NNAP governance structure and membership of the NNAP Project Team are available at www.rcpch.ac.uk/workwe-do/quality-improvement-patient-safety/national-neonatalaudit-programme/governance-delivery
Further information about the background, aims, and scope of the NNAP is available at: www.rcpch.ac.uk/about-nnap
Introduction
Established in 2006, the National Neonatal Audit Programme (NNAP) is commissioned by the Healthcare Quality Improvement Partnership (HQIP) and delivered by the Royal College of Paediatrics and Child Health (RCPCH).
Extended analysis report
It assesses whether babies admitted to neonatal units receive consistent high-quality care in relation to the NNAP audit measures that are aligned to a set of professionally agreed guidelines and standards. The NNAP also identifies variation in the provision of neonatal care at local unit, regional network and national levels and supports stakeholders to use audit data to stimulate improvement in care delivery and outcomes. The audit reports key outcomes of neonatal care, measures of optimal perinatal care, maternal breastmilk feeding, parental partnership, neonatal nurse staffing levels, and other important care processes. This report summarises the key messages and national recommendations developed by consensus by the NNAP Project Board and Methodology and Dataset Group, based on NNAP data relating to babies admitted to neonatal care in England, Scotland, Wales and the Isle of Man between 1 January and 31 December 2024.
Full results
Full annual results at unit and network level, interactive reporting tools and unit posters are available on NNAP Online at: www.rcpch. ac.uk/resources/nnap-online-report-data
A line of sight table describing the evidence base for the recommendations made in this report is available at: www.rcpch.ac.uk/NNAPreport-2024-data
The NNAP 2024 data extended analysis report, available at: www.rcpch.ac.uk/ NNAP-report-2024-data provides results by NNAP measure by unit type, by neonatal network, and for England, Scotland, Wales and the Isle of Man combined. There is also a summary of findings for each audit measure, recommended next steps for services seeking to make improvements and links to further resources and case studies.
NNAP Data Dashboard
The public facing NNAP Data Dashboard presents results for each of the 10 key performance metrics as annual rolling averages, updated monthly. Data in the Dashboard are provisional and may be subject to change between updates and before the publication of the NNAP annual summary report. Registered audit participants within neonatal networks and units can access a restricted version of the dashboard to support data cleaning and early quality improvement interventions. Access the dashboard at: www. rcpch.ac.uk/resources/nnap-data-dashboard
Further data
Full results
Full annual results at unit and network level, interactive reporting tools and unit posters are available on NNAP Online at: www.rcpch.ac.uk/resources/ nnap-online-report-data
Further data about maternity and perinatal services is available from the National Maternity & Perinatal Audit (NMPA) and Mothers and Babies: Reducing Risk through Audits and Confidential Enquiries across the UK (MBRRACE-UK). The NMPA measures various aspects of maternity and neonatal care provided by NHS maternity services in England, Scotland and Wales. MBRRACE-UK conducts robust national surveillance and investigates the deaths of women and babies who die during pregnancy or shortly after pregnancy in the UK.
Results at a glance
The National Neonatal Audit Programme (NNAP) assesses whether babies admitted to neonatal units receive consistent high-quality care and identifies areas for improvement. This poster summarises both the combined national and network level results based on NNAP data relating to babies admitted to neonatal care between January and December 2024, unless otherwise stated. Results displayed in the horizontal pink bars show the range of neonatal network proportions (lowest and highest) and the pink circles shows the overall audit results. A green arrow, whether pointing up or down denotes a positive change, whereas a red arrow, pointing up or down denotes a negative change. An amber arrow denotes no change.
Outcomes of neonatal care
Mortality
6.4% of 7,038 babies born at less than 32 weeks died before discharge home.
0% change from previous year (2023: 6.4%)
Necrotising enterocolitis
5.1% of 6,909 babies born at less than 32 weeks developed necrotising enterocolitis.
3% of 6,871 babies born at less than 32 weeks experienced cPVL.
0.5% increase from previous year (2023: 2.5%)
Born in a centre with a NICU
80.7% of 1,920 babies born at less than 27 weeks’ were born in a centre with a NICU on site.
1.1% increase from previous year (2023: 79.6%)
Temperature on admission
77.6% of 13,077 babies born at less than 34 weeks’ were admitted with a temperature within the recommended range of 36.5°C-37.5°C.
2.6% increase from previous year (2023: 75%)
Breastmilk feeding in first 2 days of life
66.8% of 12,874 babies born at less than 34 weeks’ received their mother’s milk in the first 2 days of life.
4.7% increase from previous year (2023: 62.1%)
Breastmilk feeding at 14 days of life
80.8% of 11,601 babies born at less than 34 weeks’ received their mother’s milk at 14 days of life.
1.4% increase from previous year (2023: 79.4%)
Breastmilk feeding at discharge
65.8% of 11,596 babies born at less than 34 weeks’ received their mother’s milk at discharge.
2.7% increase from previous year (2023: 63.1%)
Parent consultation within 24 hours
94.6% of 56,864 parents had a documented consultation with a senior member of the neonatal team within 24 hours of their baby’s admission.
0.5% decrease from previous year (2023: 95.1%)
Parent inclusion in consultant ward rounds
36% of 772,337 baby care days had a consultant-led ward round with at least one parent included.
2.7% decrease from previous year (2023: 38.7%)
Care processes and nurse staffing
On-time screening for retinopathy of prematurity (ROP)
80% of 6,725 eligible babies were screened on time for ROP.
1.5% increase from previous year (2023: 78.5%)
Medical follow up at two years
77.9% of 3,890 babies born at less than 30 weeks’ had a documented medical follow up at the right time.
0.7% increase from previous year (2023: 77.2%)
Non-invasive breathing support
51.7% of 6,642 babies born at less than 32 weeks’ received only noninvasive breathing support in the first seven days of life.
2.4% increase from previous year (2023: 49.3%)
Neonatal nurse staffing
81.5% of 124,981 nursing shifts were staffed according to recommended levels.
2.6% increase from previous year (2023: 78.9%)
Further information and resources
For neonatal services, neonatal networks and trusts/health boards
Full annual results
Full annual results at neonatal unit and network levels, interactive reporting tools and unit posters are available on NNAP Online at: www.rcpch.ac.uk/resources/nnap-online-report-data
Extended Analysis Report
The NNAP 2024 Data: Extended Analysis Report, providing in-depth results and a summary of findings by audit measure, along with full national recommendations, local quality improvement recommendations and links to case studies and useful resources is available at: www.rcpch.ac.uk/nnap
For parents and families
Your Baby’s Care Guide 2024
Parents and families can find more information about the NNAP and 2024 results in Your Baby’s Care, a guide to the NNAP, while NNAP Online provides more in-depth results for each neonatal unit and network in England, Wales, Scotland and Isle of Man.
Your Baby’s Care: www.rcpch.ac.uk/your-babys-care NNAP Online: www.rcpch.ac.uk/resources/nnap-onlinereport-data
How we use information
To find out more about how we use information about babies experiencing neonatal care and their mothers, visit www.rcpch.ac.uk/your-babys-information or scan the QR code with your phone to read our leaflet, Your Baby’s Information
Key messages & recommendations
1
Mortality to discharge in very preterm babies
Overall, the proportion of very preterm babies, born between 24 and 32 weeks gestational age, who die before discharge home from the neonatal unit is unchanged from 2023 at 6.4% (451 of 7,038) and has not improved over recent years. Unacceptable geographical variation persists between neonatal networks, which
is not explained by the clinical or demographic background characteristics of babies cared for in the neonatal network (Figure1, NNAP Online and extendedanalysisreport)
Although the NNAP reports only deaths occurring after admission to a neonatal unit, not including stillbirths and delivery room deaths, it’s clear that the national ambition in England to halve the number of stillbirths and neonatal deaths by 20251 is unlikely to be achieved, and a different approach to reducing mortality is needed.
Figure 1: Front and back plot of mortality to discharge in very preterm babies, by neonatal network, 2017-2024.
The number of babies born at 22 weeks gestational age and admitted to neonatal care appears to have plateaued (108 in 2024), having increased approximately seven-fold between 2018 (15) and 2023 (112). The number of babies born at this gestational age and surviving to discharge has increased from 5 in 2018 to 33 in 2024 (Figure2) . The proportion of admitted babies born at 22 weeks and surviving to 44 weeks or discharge is largely unchanged (Figure2)
Figure 2: Babies born at 22 and 23 weeks gestational age, admitted to a neonatal unit and surviving to 44 weeks gestational age, 2018-2024.
National recommendation:
1. Neonatal networks should:
a. Review their mortality data and, where rates are higher than expected, develop locally prioritised improvement plans. Quality improvement activity should focus on best practices identified from Neonatal Networks exhibiting low mortality, with particular attention given to differences in network structure, staffing, clinical governance, and clinical practices. (Recommendation repeated from the 2023 data report).
b. With their constituent units, undertake reviews of deaths in accordance with the BAPM Framework for Practice: Neonatal Mortality Governance (expected to be published in the second part of 2025) and engage with other statutory death review processes. Shared learning from these reviews should inform network governance and unit level clinical practice.
Outcomes of neonatal care
This year, the highest proportion to date of neonatal units were able to provide assurance that all required data relating to key complications of prematurity were submitted to the audit (bloodstream infection –90% (161 of 179), necrotising enterocolitis – 92% (164 of 179), preterm brain injury – 89% (160 of 179). However, caution should continue to be exercised in interpreting measure results due to continuing levels of missing data and unclear quality assurance, as well as the risk of imprecision in reporting cases of preterm brain injury and necrotising enterocolitis.
Rates of late onset bloodstream infection have remained static since 2019 with no evidence of improvement over time nationally; ranging between 4.7% and 5.9% (extendedanalysisreport) . When case mix is taken into consideration, variation in rates of infection between neonatal units and networks is low (NNAP Online,extendedanalysisreport)
There is some evidence of a small overall reduction in the incidence of necrotising enterocolitis (NEC) (2017 –6.6%; 2024 – 5.1%, 351 of 6,909) (extendedanalysisreport) ; with regional variation not explained by differences in gestational age of the babies being cared for (NNAP Online,extendedanalysisreport) . However, caution should continue to be exercised over these results due to the levels of missing data and quality assurance, while data completeness - and ultimately quality - continue to improve.
The completeness of preterm brain injury data reported in the NNAP continues to improve year on year, with only two networks with missing data over 20% in 2024 for each of the reported brain injury types (IVH grades 3 or 4, cPVL and PHVD) (NNAP Online,extendedanalysis report) . However, data quality issues and reporting of PHVD mean that NNAP cannot yet confidently describe rates of brain injury and trends over time.
Over the last three years, the overall proportion of babies born at less than 32 weeks who developed bronchopulmonary dysplasia (BPD) or died has remained stable (2024 – 39.8%, 2,925 of 7,341; 2023 –40.1%, 2022 – 40.2%) (Figure3) . Prior to 2022, there was evidence of an increase over time2
3: Proportion of babies born at less than 32 weeks GA who developed BPD or died, 2017-2024, using 2024 data, definitions and methodology.
Figure
Use of non-invasive breathing support is recommended where clinically appropriate to reduce the risk of mortality and incidence of BPD3. There is a continued overall improvement in the proportion of babies receiving only non-invasive breathing support during their first week of life; rising to 51.7% (3,437 of 6,642) in 2024 (2023 – 49.3%; 2022 – 47.8%) (extendedanalysis report)
However, there is significant variation in adherence to NICE guidance among neonatal units and networks, which is not decreasing over time. Network proportions range between 43.3% and 61.7%; and among NICUs, 24% - 68.8% (extendedanalysisreport,figure4). Differences in treatment effect4 indicate that regional and local variation is not explained by differences in the gestational age of the babies being cared for(extended analysisreport)
Figure 4: Observed proportion of non-invasive breathing support, by neonatal unit (2024).
National recommendation:
2. NHS England5 and health departments in Devolved Governments should:
a. issue clear guidance to neonatal services around the correct reporting of preterm brain injury including PHVD, so that robust data collection can support the achievement of the national ambition for neonatal brain injury.
b. develop a mandatory NHS neonatal information standard to ensure that clinical reporting systems are interoperable, ensuring robust data collection to support effective measurement and reporting of all neonatal processes and outcomes.
3. NICE. Specialist neonatal respiratory care for babies born preterm. Quality standard QS193. 15 July 2020. Available here
4. In reporting outcomes, the NNAP describes the observed number of infants with an outcome, and a “balanced proportion” which is the proportion of that outcome in a matched group of babies with similar baseline characteristics to those in the network of interest. Comparing the balanced proportion to the observed proportion allows calculation of a “treatment effect”. Treatment effect is the difference between the observed and balanced proportion. A negative treatment effect means that the observed proportion is lower than the balanced proportion, and suggests that the babies were more likely to survive/not have a particular outcome in the network than elsewhere in the country. A positive treatment effect means that the observed proportion is higher than the balanced proportion, and suggests that the babies would have been more likely to survive/not have a particular outcome had they been born and treated elsewhere.
5. NHS England or succeeding responsible organisation in England.
Optimal perinatal care
Despite rapid improvement in the proportion of babies receiving all reported perinatal optimisation measures6, only 1 in 5 babies (21.9%, 2,849 of 13,023) currently receives a complete optimal perinatal care journey, increased from 7.7% in 2021 (extendedanalysisreport)
There is evidence that optimal perinatal interventions are linked to key outcomes such as mortality and brain
injury.7,8,9 Therefore, there is an important opportunity to improve perinatal optimisation nationally, to increase the proportion of babies receiving an optimal perinatal care journey and reduce regional variation in mortality and brain injury.
Since the introduction of deferred cord clamping into NNAP reporting in 2020, there has been rapid uptake of this important intervention by the neonatal community, with significant overall year-on year improvement in data completeness and delivery - from 36.9% in 2020 to 73.5% (9,479 of 12,894) in 2024 (Figure5)
Figure 5: Proportion of babies born at less than 34 weeks GA receiving deferred cord clamping, 2017-2024, using 2024 data, definitions and methodology*.
National proportion
National proportion missing Pre-NNAP measurement Pre-NNAP measurement
However, there is still striking unit level variation (from 30.8% to 100%) (extendedanalysisreport) and therefore opportunities exist for further improvement.
Using the latest definition of this measure, there is a clear year-on-year improvement in the proportion of babies with a normal temperature on admission and within an hour of birth, from 64.5% (9,542 of 14,801) in 2017 to 77.6% (10,149 of 13,077) in 2024 (Figure6)
While improvements can clearly still be made, variation between networks is relatively low, ranging from 69.1% to 82.2%, with year-on-year improvement continuing in most networks (extendedanalysisreport) .
magnesium sulphate, birth in a centre with a NICU, deferred cord clamping, normal temperature on admission, breastmilk feeding in the first 2 days of
7. Fogarty, M. et al. Delayed vs early umbilical cord clamping for preterm infants: a systematic review and meta-analysis. AmJObstetGynecol.2018 Jan;218(1):1-18. doi: 10.1016/j. ajog.2017.10.231. Available here.
6. Antenatal steroids, antenatal
life.
8. Oddie S., Tuffnell D. J., McGuire W. Antenatal magnesium sulfate: Neuro-protection for preterm infants. ArchivesofDiseaseinChildhood-FetalandNeonatalEdition2015; 100: F553-F557. Available here
9. McCall EM, Alderdice F, Vohara S, et al. Interventions
Issue 2. Available here.
Figure 6: Proportion of babies born at less than 34 weeks GA with normal temperature on admission, 2017-2024, using 2024 data, definitions and methodology*.
There has been a small reduction in the overall proportion of eligible mothers receiving a full course of antenatal steroids within one week prior to delivery (2024 – 51.8%, 5,867 of 11,321; 2023 - 53%) (extendedanalysisreport) . However, there is evidence that shortened courses (less than 24 hours) are common.10 Antenatal steroid courses with a short duration do not have additional benefit over standard length courses and may cause harm.11 It is important to ensure that NNAP measurement of antenatal steroid usage does not inadvertently encourage sub-optimal delivery of this treatment.
Broadly, delivery of antenatal magnesium sulphate is relatively unchanged in recent years (2024 – 86.7%, 3,291 of 3,795; 2023 – 85.2%; 2022 – 85.5%) following the introduction in 2018 of the PReCePT programme12 in England, and in 2020, PERIPrem Cymru13 in Wales. Three neonatal networks are meeting the NNAP developmental standard of 90% (extendedanalysis report)
Despite a small increase in the overall proportion of extremely preterm babies born in a centre with a NICU this year, performance has remained relatively unchanged since 2020 (2024 – 80.7%, 1,549 of 1,920; 2020 – 79.7%) (extendedanalysisreport) . Regional
variation does exist, with network rates ranging from 71% to 91.3%; only four networks are meeting the NNAP developmental standard of 85% (extendedanalysis report) . The network variation observed reflects both population geography and network management of patient flows.
National recommendation:
As recommended in the NNAP Summary Report on 2023 Data:
3. Neonatal Networks should ensure that their constituent units are using the NNAP restricted access dashboard to regularly review their rates of optimal perinatal care delivery, identifying instances of non-adherence, and implementing quality improvement activities in response to them.
10. Pettinger, K. et al, (2025) Hitting the target and missing the point with shortened
of antenatal steroids: An observational study. Neonatal Society Summer Meeting. 19 June 2025; London. Available here
11. Pettinger KJ, Spencer R, Oddie SJ. Perinatal medicine’s best
2025;110:245-246. Available here.
Parental partnership in care
Communication and decision making
94.6% (53,817 of 56,864) of families have a consultation with a senior member of the neonatal team within 24 hours of admission. This is a small drop since 2023 (95.1%), coinciding with this measure no longer being subject to the outlier management process (extended analysisreport) . However, network variation remains low; all neonatal networks achieve this for over 92% of baby admissions (NNAP Online,extendedanalysisreport)
The audit has been measuring parental inclusion on daily consultant ward rounds since 2017, and it is now widely accepted that parents should be included in these key decision-making discussions. Initially reporting on whether a parent was involved in the ward round at least once during their baby’s stay, the NNAP now looks at whether this happened on each day of a baby’s stay. Overall, a parent is involved in the ward round for 36% of baby care days (277,943 of 772,337). There is wide variation in how well this is achieved geographically, from 25.2% to 58.2% between neonatal networks (NNAP Online,extendedanalysisreport)
Changes to the way these data are recorded in clinical systems make it difficult to compare data over time, and to effectively interpret the impact of missing data, and therefore the NNAP recommends caution when comparing and interpreting results. Feedback to the audit from some users has indicated that parent partnership could be measured in ways which take
better into account other opportunities for parents’ inclusion. The NNAP is committed to exploring what parent partnership in care means to parents and families, and how this could be better measured in the future.
Breastmilk feeding
There is an encouraging increase in the proportion of babies receiving breastmilk in their first two days of life, from 52.4% in 2022, to 66.8% (8,586 of 12,847) in 2024, with minimal missing data (0.7% in 2024) (extended analysisreport) . Opportunities do however exist for improvement; there is striking unit level variation, from 38.4% to 91.6% across NICUs, and 21.4% to 100% across all levels of neonatal unit (Figure7) .
Overall, high rates of any breastmilk feeding are being achieved at 14 days, and this rate has been sustained over the last 5 years (2019 – 78.4%; 2024 – 80.8%, 9,371 of 11,601). Breastmilk feeding rates decrease to 65.8% at discharge home, although this represents an improvement from 59.5% in 2017 (extendedanalysis report) .
Geographical variation exists between networks in the rates of feeding with any mother’s milk at day 14 (from 72.7% to 89.6%), which widens further by discharge home (50.1% and 84.6%). Evidence shows that the higher the proportion of breastmilk consumption during the neonatal stay, the better the odds of continued breastfeeding14,15. Rates of exclusive breastmilk feeding at day 14 range from 43.6% to 59.5% across networks, while rates of exclusive breastmilk feeding at discharge range from 29.9% to 47.2% (extendedanalysisreport)
Figure 7: Proportions of any breastmilk feeding in the first two days of life, by neonatal unit (2024).
Medical follow up at two years of age
The rate of improvement in the delivery of medical follow-up at two years of age has been slow, from 69.9% in 2018 to 77.9% (3,029 of 3,890) in 2024, and regional variation remains, from 67.7% to 85.8% (NNAP Online, extendedanalysisreport) . However, there is clear evidence of some regional and local good practice – 41 units are achieving the NNAP developmental standard that says that at least 90% of babies should have two-year follow up data entered (NNAP Online,extendedanalysisreport)
The NNAP will now consider and consult on reporting rates of survival without severe disability for centres following up over 90% of their babies, which may support improvements in follow-up delivery in other centres.
National recommendation:
4. Neonatal networks and local maternity and neonatal systems should ask their constituent units with below average rates of breastmilk feeding by day 2 to:
a. investigate reasons for variation in uptake locally, and
b. with families, co-design targeted, quality improvement programmes.
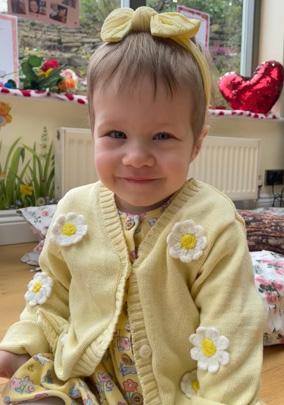
Luna having her first cuddle and skin-to-skin with dad, Mike Smith, whilst on CPAP. We were given bonding hearts on the unit to use so that our scent could be transferred and comfort Luna when we were away from her. Luna is now an amazing two year old and our miracle.
Photos courtesy of Rosanna Smith
On-time screening for retinopathy of prematurity (ROP)
Since the publication of new ROP screening guidance in March 2022, there has been a clear increase in the proportion of eligible babies receiving on time screening in line with the new recommendations; from 66.4% in 2022 to 80% (5,377 of 6,725) in 2024 (extendedanalysisreport) . This important screening needs to be delivered within a precise time window by highly specialised staff, and this challenge has been increasingly met by the neonatal community.
There is an overall trend towards improving compliance with nurse staffing levels over time, from 62.5% in 2017 to 81.5% (101,921 shifts of 124,981) in 2024, with evidence of a recovery following the aftermath of the COVID pandemic (2020 – 79.3%, 2021 – 74.1%, 2022 – 72.3%, seeextendedanalysis report). However local and regional variation remains; from 66.3% to 91.1% between networks (extendedanalysisreport)
Neonatal nurse staffing
Equity in neonatal care process delivery by ethnicity
This year, for the first time, the NNAP has also undertaken analysis of data for areas where differences in the delivery of important neonatal care interventions according to ethnicity have been demonstrated.16 More detailed results are available on NNAP Online and the NNAP Dashboard. The results presented are not adjusted for differences in case mix, because the unadjusted results are those which need to be actioned.
Robust reporting of equity in neonatal care relies on accurate and complete reporting of patient demographics. The NNAP is driving improvements in completeness of demographic data through its dashboard. Among babies born in 2024 and admitted to a neonatal unit, 11.4% had missing ethnicity (8.5% of babies born at less than 34 weeks gestational age), after using baby’s ethnicity if a mother’s ethnicity was not recorded.
Optimal perinatal care
• Nationally, a lower proportion of babies of Black mothers received deferred cord clamping (68.5%, 755 of 1,102) than White (74.1%, 5,927 of 8,002), Asian (75.5%, 1,594 of 2,112) and mothers classified as Mixed/ Other (70.2%, 458 of 652) (extendedanalysisreport)
• Nationally, a lower proportion of babies with Black mothers had a normal temperature on admission (73%, 818 of 1,120), than White (78.1%, 6,302 of 8,072), Asian (77.5%, 1,649 of 2,129), and mothers grouped as Mixed/Other (76.3%, 505 of 662) (extendedanalysis report)
• A lower proportion of babies with White mothers were born in a centre with a NICU (77.8%, 755 of 971), when compared to Black (82.9%, 213 of 257), Asian (82.6%, 327 of 396) and Mixed/Other (83.2%, 99 of 119) (extendedanalysisreport) .
Parent partnership in care
Parental consultation within 24 hours took place for a lower proportion of admissions when the mother was Black (93.7%, 3,886 of 4,147) Asian (94.2%, 7,783 of 8,261) or grouped as Mixed/Other (93.8%, 2,343 of 2,498) than for White mothers (95%, 34,656 of 36,483) (extendedanalysisreport)
• Parental inclusion on the consultant ward round took place for a lower proportion of baby care days when the mother was Asian (29.3%, 38,083 of 129,969 baby care days), Black (34.7%, 23,743 of 68,423 baby care days), or Mixed or other ethnic background (33.6%, 12,989 of 38,651 baby care days) than for White mothers (37.9%, 178,111 of 469,391 baby care days) (extendedanalysisreport)
Use of breastmilk amongst preterm babies varies by ethnicity. A lower proportion of babies born to Black and Asian mothers (62.2%, 680 of 1,093; and 65.5%, 1,370 of 2,091 respectively) received any of their mother’s milk in their first 2 days of life than babies born to White mothers (67.5%, 5,367 of 7,949) and those grouped as Mixed/Other (70.9%, 464 of 654) (extendedanalysisreport)
Conversely, breastmilk feeding was established and sustained through the neonatal stay for a higher proportion of babies born to Black mothers (day 14 –88.9%, 876 of 985; discharge – 82.3%, 795 of 966), than for babies born to White mothers (day 14 – 77.4%, 5,581 of 7,213; discharge – 59.8%, 4,335 of 7,249), Asian mothers (day 14 – 86.8%, 1,652 of 1,903; discharge –73.1%, 1,362 of 1,863), and mothers grouped as Mixed/ Other (day 14 – 84.9%, 507 of 597; discharge – 74.4%, 451 of 606) (extendedanalysisreport) . This suggests there may be opportunities to improve the equity of early support provided to women of minoritised ethnicity.
National recommendation:
5. Neonatal networks and local maternity and neonatal systems should work with the perinatal teams in their constituent neonatal units to:
a. ensure that staff receive appropriate and consistent training to confidently ask families about their ethnicity and that of their baby, and to accurately record demographic information,
b. use the NNAP dashboard to review how well NNAP process measures are delivered locally, and whether this differs by ethnicity
c. where differences exist, seek to understand the underlying causes, and
d. with families, co-design quality improvement programme that directly address those causes.
16. Pettinger, K. et al, (2024)
A guide to the National Neonatal Audit Programme
Summary report on 2024 data
The National Neonatal Audit Programme is commissioned by the Healthcare Quality Improvement Partnership (HQIP) and funded by NHS England and the Governments of Wales, Scotland and the Isle of Man as part of the National Clinical Audit and Patient Outcomes Programme.
Royal College of Paediatrics and Child Health. Incorporated by Royal Charter and registered as a Charity in England and Wales: 1057744 and in Scotland: SCO38299. Registered Office 5-11 Theobalds Road, London WC1X 8SH.