Sustainable Development Bonds & Green Bonds
IMPACT REPORT
THE WORLD BANK
Investor Relations & Sustainable Finance Capital Markets & Investments Department The World Bank Treasury 1818 H St NW Washington, DC 20433 USA debtsecurities@worldbank.org +1 (202) 477-2880 treasury.worldbank.org/capitalmarkets E T W
June 2021
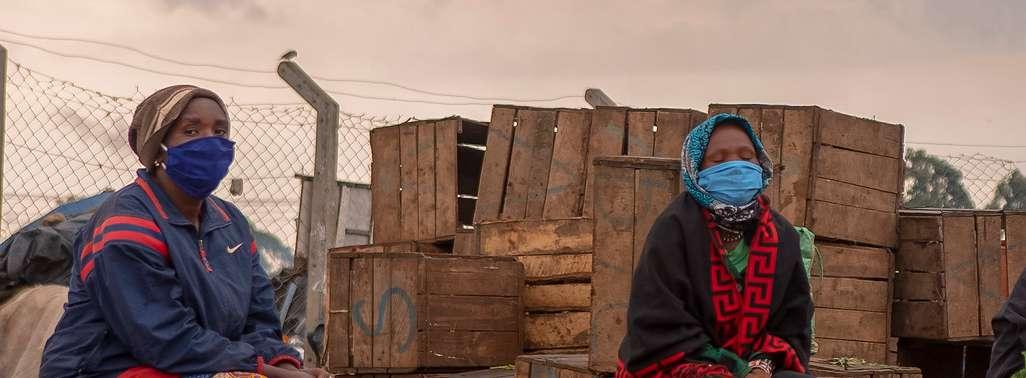
World Bank Sustainable Development Bonds & Green Bonds: Impact Report 2020 Cover photo credit: ©DisobeyArt / Adobe Stock
Acknowledgements
The report benefitted from consultation with technical experts in World Bank Global Practices, thematic areas and corporate partners including Nora Kaoues, Flore de Preneuf, and Geeta Sethi, in Agriculture & Food; Alexandra Humme in Health, Nutrition and Population; Garo Batmanian, Morgan Graham, Monika Kumar, and Susan Pleming in Environment, Natural Resources & Blue Economy; Meriem Gray and Erin Hylton in Water; and Samuel Fargher, Sohee Gu, and Janak Shrestha in Climate Change; Mauro Azeredo, Natalia Cieslik, Nicole Frost, Paul McClure, and Leslie Yun in External and Corporate Relations; and Nazmul Chaudry, Geetanjali Chopra, Jacqueline Julian, Svetlana Klimenko, Charles di Leva, Andres Londono, Frank Madsen, Lisandro Martin, Una Meades, Sara Okada, Robert Saum, and Johannes Zutt in Operations Policy & Country Services. The team also received support from and wish to thank the following task team leaders for providing insight on the projects featured in this report: Abedalrazq F. Khalil, Regassa Ensermu Namara, Edouard Ereno Blanchet, Hadji Huseynov, Deepika Eranjanie Attygalle, Volkan Cetinkaya. Finally, we would like to thank Sarah Cochrane, Sarah Kim, Isaias Losada Revol, and Bart Servaes in Legal Finance and the World Bank’s Office of the Managing Director and Chief Financial Officer and Finance Partners for guidance and support in finalizing the report, particularly Ivar Andersen, Otilia Ciotau, and Fernanda Zavaleta.
Authors: This report was prepared by the Investor Relations and Sustainable Finance team in the World Bank Treasury. The authors of the report are Colleen Keenan and Zoe Russo with guidance from Heike Reichelt and key contributions from Scott Cantor, Juwon Lim, and Kacie Sampson.
Designer: The report was designed by Jonelle Karinne Agurs.
This year’s World Bank (International Bank for Reconstruction and Development, IBRD) impact report benefits from extensive feedback received during the development and rollout of the inaugural impact report covering fiscal year (FY) 2019. Building on the FY19 report, this report covers all projects active in FY20 whose financing was supported by IBRD bonds, presenting for the first time, the World Bank’s Green Bond project portfolio alongside the Sustainable Development Bond (SDB) project portfolio.
For the SDB project portfolio, we present results achieved by projects active in FY20. Compared to the FY19 report, in which we presented the results of projects that closed in FY19, this presentation allows us to provide a more contemporary snapshot of what the current SDB project portfolio is achieving. This further aligns SDB impact reporting with the World Bank Corporate Scorecard and Corporate Results Indicators (CRIs), which we have used to report a subset of results across the entire project portfolio. The
presentation of the World Bank Green Bond project portfolio compared to the FY19 Green Bond Impact Report remains the same.
As part of our efforts to provide a model for impact reporting that maps project results to the Sustainable Development Goals (SDGs), we have partnered with the Stockholm Environment Institute (SEI). This impact report includes two high-level mappings of the 100 projects added to the SDB project portfolio in FY20 using a methodology developed in partnership with SEI.
1 More information about World Bank sustainability reporting is available in the Resources section of this report.
Impact reporting is a constantly evolving process and, at the World Bank, is part of our sustainability reporting.1
About the Report
Who is the intended audience?
The impact report, which covers bonds issued in FY20 (July 1, 2019 - June 30, 2020), is intended primarily for World Bank bond investors and other capital market stakeholders to explain how all IBRD bond proceeds support sustainable development in IBRD member countries and contribute to the SDGs. We welcome feedback from investors, underwriters, capital market service providers, and other stakeholders, including input from our own technical and financial experts and management.
What does the report cover?
The report is focused on IBRD Sustainable Development Bonds and Green Bonds and the IBRDfinanced projects supported by these bonds. Contributions from the World Bank Treasurer, the Global Director for Health, Nutrition and Population, and the Global Director for Climate Change, set the context for the report, with the pandemic and climate change as the most critical challenges to highlight for the reporting period.
The Introduction provides an overview of the World Bank Group’s strategy and goals for additional context alongside FY20 achievements. We share
how the World Bank engages with IBRD investors on the SDGs while issuing bonds to raise awareness for development challenges using themes and SDGs that investors were most interested in during the reporting period. We present highlights of the expected impact of the 100 new projects added to the SDB project portfolio in FY20 and an SDG mapping of the SDB project portfolio developed with SEI. Finally, we share highlights of our efforts to promote sustainable capital markets through speaking engagements and recognition for stand-out bond issuance in FY20.
Dedicated chapters for SDBs and Green Bonds present impact highlights followed by issuance, commitment and allocation figures. Each section includes examples of new projects added to the respective portfolios in FY20.
The Project-by-Project Reporting section presents project level detail for each portfolio. The SDB section includes the 100 new projects added to the SDB project portfolio in FY20 out of a total of 599 active projects.² The 100 new projects added are those which began disbursing in FY20. Due to the size of the dataset, a list showing the remainder of
projects is available on the World Bank Treasury website
The Green Bond section includes a mix of active and closed projects which comprise the 111 projects in the Green Bond project portfolio. Each section is organized by sector and provides selected results, commitment and allocation data, and project identification numbers to easily access detailed project documentation on the World Bank’s project portal. The section concludes with a project level mapping to the SDGs of the 100 new projects supported by the SDB project portfolio in FY20. Green Bond projects are included in the project level reporting of the SDB project portfolio and marked with green shading or a green leaf for convenience.
The Resources section provides information on the impact reporting approaches for each program and details on how World Bank bonds align to Sustainability Bond Guidelines and Green Bond Principles published by the International Capital Market Association. It also includes information about key World Bank reports, sustainability resources and accountability measures.
The report is an integral part of the World Bank’s sustainability reporting and will evolve over time based on feedback and as data management, collection and aggregation improve and as guidance for impact reporting continues to develop.
2 “Added to the Sustainable Development Bond project portfolio” refers to projects that began disbursing in FY20.
Table of Contents 8 Foreword A Message from Jingdong Hua, Vice President and Treasurer 10 Building a Green, Resilient and Inclusive Re covery � � � � � � � � � � � � � � 13 In Conversation with Muhammad Pate, Global Director, Health, Nutrition and Population; Director, Global Financing Facility for Women, Children and Adolescents 14 I n Conversation with Bernice Van Bronkhorst, Global Director, Climate Change 16 18 Introduction About the World Bank 19 Engaging with Investors on the SDGs � � � � � � � � � � � � � � � � � � � � � � � � � 20 FY20 Impact Highlights � � � � � � � � � � � � � � � � � � � � � � � � � � � � � � � � � � � � � � 22 SDG Mapping � � � � � � � � � � � � � � � � � � � � � � � � � � � � � � � � � � � � � � � � � � � � � � � � 24 Engaging Stakeholders to Build Sustainable Capital Markets 26 28 Sustainable Development Bonds Impact 30 Issuance Highlights, Commitments, and Allocations 31 Featured Projects 34
40
Bonds Impact � � � � � � � � � � � � � � � � � � � � � � � � � � � � � � � � � � � � � � � � � � � � � � � � � � � � � � 42 Issuance Highlights, Commitments, and Allocations � � � � � � � � � � � 44 Featured Projects � � � � � � � � � � � � � � � � � � � � � � � � � � � � � � � � � � � � � � � � � � � 48 54 Project-by-Project Reporting Sustainable Development Bonds 55 Green Bonds 97 Project-Level Mapping to the SDGs 138 140 Resources Impact Reporting Approach 142 Alignment with Market Standards 146 World Bank Annual and Sustainability Reporting 150 Accountability Mechanisms 151 List of Abbreviations 152 Disclaimer 153
Green
Foreword
 Photo credit: ©Tomislav Georgiev / World Bank
A Message from Jingdong Hua
Vice President & Treasurer, World Bank

The challenges of this past year have been unprecedented. The impacts of the coronavirus pandemic have fallen disproportionately on the most vulnerable with the fewest safety nets. The virus has brought illness and death on a catastrophic scale and has devastated the global economy, pushing an estimated 150 million additional people into extreme poverty and reversing decades of development gains.
As countries work to contain the impacts, the World Bank has mounted the fastest and largest crisis response in its history to help borrowing member countries strengthen their pandemic response, healthcare systems, and economies while remaining focused on resilience and climate action. In response, the World Bank issued a record US$75 billion equivalent in 27 different currencies through 349 transactions in FY20 to support the financing of sustainable development projects and programs. Together with bonds issued this fiscal year, funds raised in capital markets have been helping countries to support the financing of a range of activities that include providing personal protective equipment (PPE), adding hospital beds,
THE WORLD BANK SUSTAINABLE DEVELOPMENT BONDS & GREEN BONDS | IMPACT REPORT 2020 10
FOREWORD
Building human capital and tackling inequality are at the center of the World Bank’s work with member countries. At the same time, we know that the devastating effects of climate change can severely limit countries’ economic recovery from the pandemic and that we have a unique opportunity to refocus global efforts on rebuilding better.
“
training medical staff, investing in remote learning, providing safety nets, and financing the purchase and distribution of COVID-19 vaccines. In the spring and summer of 2020, the World Bank issued several benchmarks to raise awareness for these efforts. This included an US$8 billion 5-year IBRD Sustainable Development Bond which set the record as the largest bond issued by a sovereign, supranational or agency (SSA) issuer.
Investors are increasingly focused on managing environmental, social, and governance (ESG) risks through their investments and seeking ways to have positive impact. World Bank bonds offer investors an opportunity to help member countries recover from the pandemic and make progress toward the SDGs. The health and economic crisis brought on by the coronavirus pandemic in 2020 also elevated our collective focus on the “social” in ESG. Building human capital and tackling inequality are at the center of the World Bank’s work with member countries. At the same time, we know that the devastating effects of climate change can severely limit countries’ economic recovery from the pandemic and that we have a unique opportunity to refocus
global efforts on rebuilding better. This has never been more important than this year as we work with countries to implement policies and reforms that expand economic participation, that leverage technology for more robust and inclusive delivery of key services—including health, education, and social protection—and that make it easier for the public and private sectors to work together toward a green, resilient, and inclusive recovery.
The World Bank issues green bonds to respond to specific investor interest in efforts dedicated to climate and as an opportunity to focus attention on the World Bank’s commitment to climate action and related projects that are supporting developing countries to advance their climate commitments and create more jobs in emerging and greener sectors. Since the World Bank issued the world’s first green bond in 2008 and created the blueprint for this US$1 trillion+ labeled bond market, the World Bank has issued approximately US$16 billion equivalent in 185 green bonds and 23 currencies. In FY20, this included the first World Bank green bond in Danish kroner.
The World Bank’s commitment to climate action extends to Sustainable Development Bonds which support the financing of a mix of projects that address both climate action and other social challenges and respond to investors’ interest in supporting a broader range of activities. Our engagement with investors helps raise awareness for SDGs and development challenges, using World Bank-financed projects as examples. Dedicated themes have included food loss and waste; gender equality; health and nutrition of women and children; education; water and oceans; and sustainable cities.
Finally, I’m proud to acknowledge that in late 2020, we hit a historic milestone for IBRD bonds, with total issuance surpassing one trillion dollars since our first bond in 1947. I marvel at the simplicity and efficiency of the World Bank’s business model of using billions, currently based on US$17 billion in paid-in capital, to catalyze trillions and connect savings to development. This funding gets channeled to IBRD operations, which span almost 60 countries, and are focused on reaching the World Bank Group’s twin goals of ending extreme poverty and promoting shared prosperity that are aligned to the SDGs.
FOREWORD | A M E ss A g E FROM Jing DO ng Hu A 11
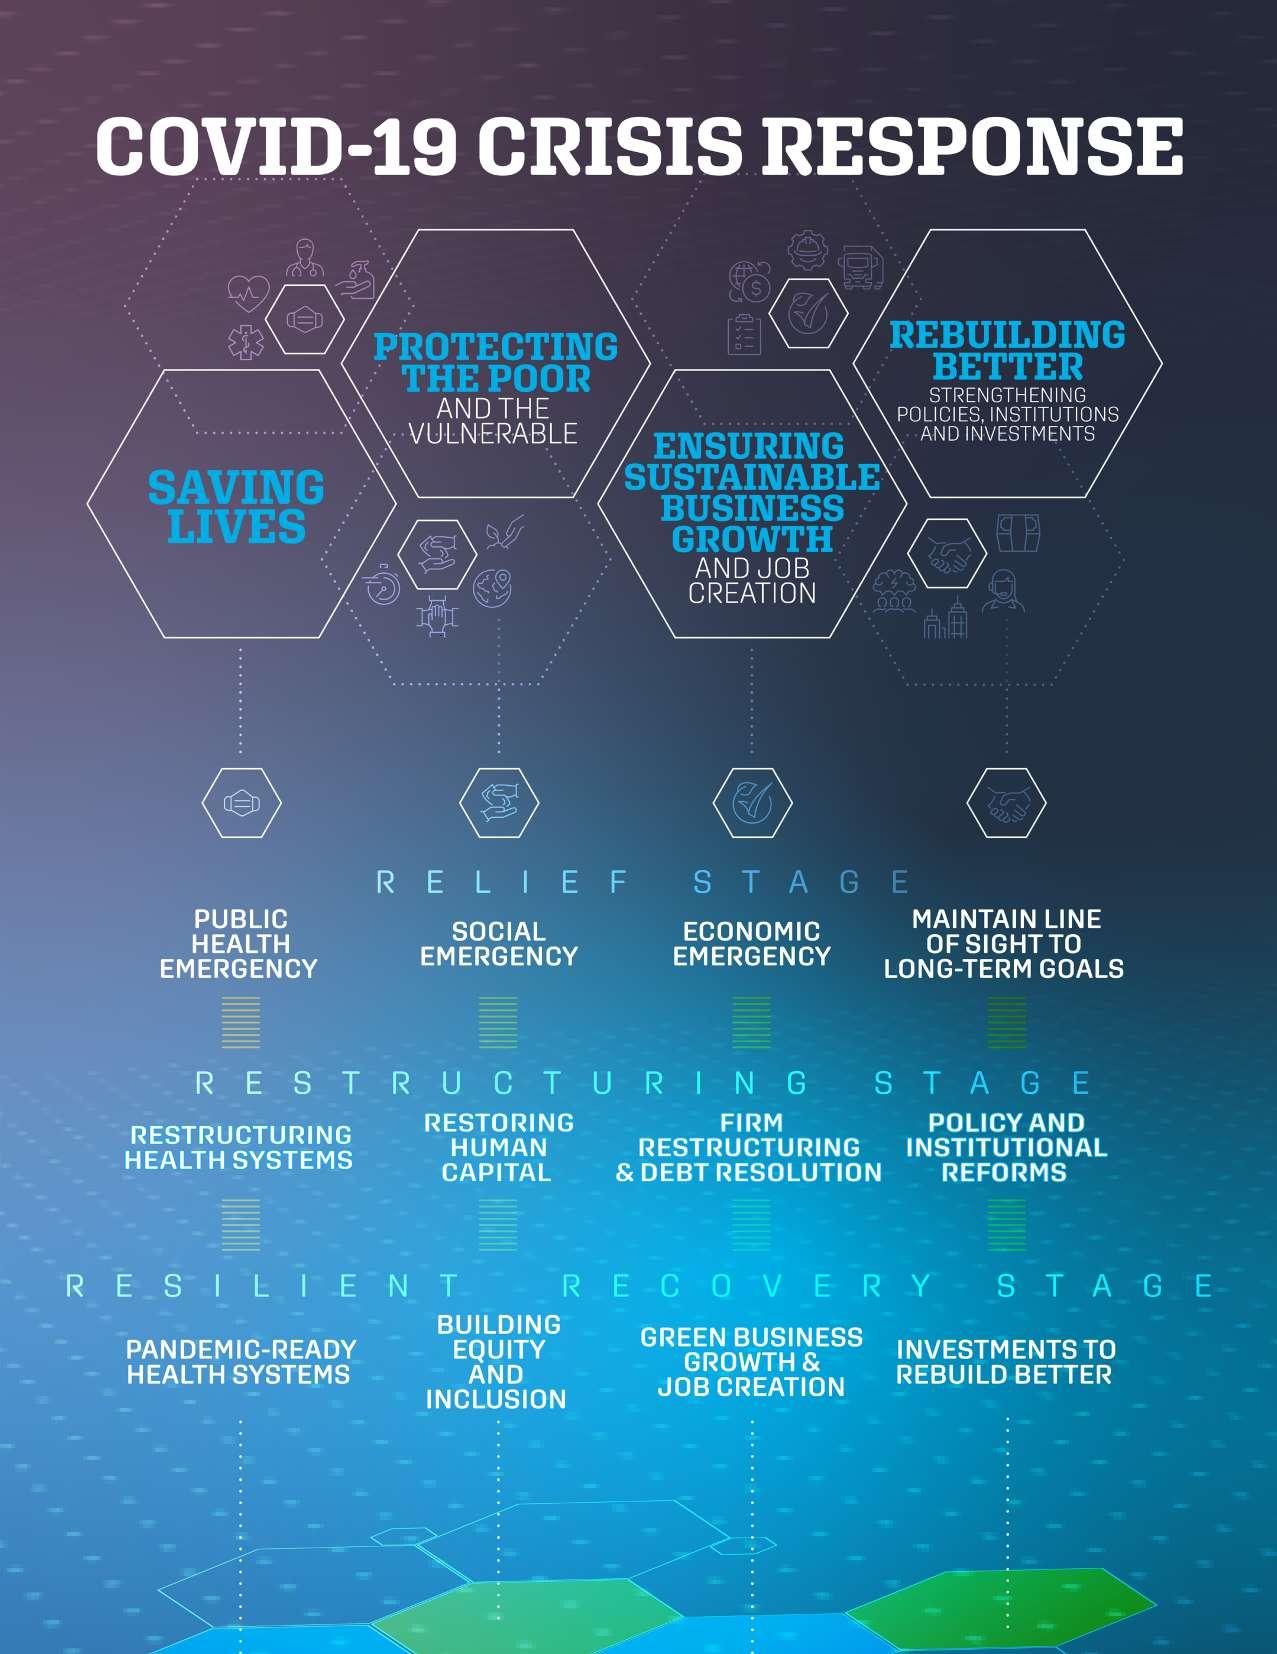
COVID-19 CRISIS RESPONSE
Building a Green, Resilient and Inclusive Recovery
The World Bank Group is taking fast, comprehensive action to save lives, protect the poor and vulnerable, achieve sustainable growth, and rebuild in better ways. Between April 2020 and March 2021, IBRD committed US$34 billion in nearly 50 countries across more than 100 projects.
The World Bank’s COVID-19 Response is targeted in four key areas:
1. First, we are focused on saving lives by helping countries implement emergency health operations by strengthening health facilities, ensuring that enough frontline health workers are in place and well-trained, helping necessary medical supplies get through and supporting public health information campaigns.
2. Second, we are helping countries protect the poorest and most vulnerable by expanding social protection through new programs and scaling up of existing programs.
$34 100 Ongoing Projects*
Billion US$ Committed*
+ ~
50 Participating Countries*
*IBRD figures as of March 31, 2021
3. Third, we are working to save jobs and businesses by supporting the private sector to preserve jobs and combat disruptions of supply chains which are critical for the immediate health crisis and preventing hunger and preserving livelihoods.
4. Fourth, as we see that over 150 million people could be pushed into extreme poverty, we are looking at how we can support policy reforms to facilitate a green, resilient and inclusive recovery.
For more information, read: Saving Lives, Scaling-up Impact, and Getting Back on Track
COV i D-19 CR isis RE s PO ns E | Buil D ing A gREE n, R E sili E nt A n D i n C lusi VE R ECOVER y 13
IN CONVERSATION WITH
Muhammad Ali Pate

It has been just over a year since the outset of the global pandemic and the World Bank’s announcement of a financial package to support member countries in their response to COVID-19. What we have learned this past year?
We have learned so much, yet I would point out that even before the unprecedented crisis, the consequences of weak health systems were visible in countries’ health results. Even high-income countries were struggling with the impact of the pandemic on their health systems, highlighting the importance of resilient, high-quality primary healthcare everywhere. Many countries continue to struggle to purchase vaccines. In addition, ensuring that they are deployed and reach those who need them the most is much more complicated.
Across the globe, vaccine deployment has highlighted the urgent need to strengthen health systems that showed a lack of sufficiently trained health workers, limited storage and transport capacity of vaccines, especially in remote areas, lack of data systems to track vaccinations and inadequate number of health centers equipped for vaccinations. The pandemic has shown us that our focus going forth must be helping countries strengthen
their systems, starting with primary health care, to ensure better preparedness for future disease outbreaks. We have to remember that investments in human capital will be key to help ensure a more resilient and inclusive recovery.
You just mentioned the challenges with vaccine rollout to developing countries, what is the World Bank doing to help?
Our current effort is focused on vaccine access and deployment.
Global Director, Health, Nutrition and Population; Director, Global Financing Facility for Women, Children and Adolescents
THE WORLD BANK SUSTAINABLE DEVELOPMENT BONDS & GREEN BONDS | IMPACT REPORT 2020 14
The pandemic has shown us that our focus going forth must be helping countries strengthen their systems, starting with primary health care, to ensure better preparedness for future disease outbreaks.
“
At the end of 2020, the World Bank board committed to US$12 billion globally to support countries to purchase and deploy COVID vaccines and to strengthen health systems to ensure that jabs get into people’s arms. We are concerned about equitable distribution of vaccines globally and we expect that a large share of the US$12 billion facility will be invested in Africa. We are rolling out vaccine projects with some $4 billion expected to be approved reaching about 50 countries. We are working closely with governments and help them get ready for vaccine distribution.
Can you give a concrete example of how the Bank’s support for vaccine finance works?
In March 2021, we approved US$100 million to support Tunisia to enable affordable and equitable access to COVID-19 vaccines. The funds will go to support the government’s strategy to vaccinate 50 percent of the population by the end of 2021. The funds will pay for the
Supporting Vaccine Readiness
purchase and deployment of several million doses of safe and effective COVID-19 vaccines— through COVAX or directly from manufacturers—as long as they meet World Bank vaccine approval criteria. World Bank funds will support the largest portion of Tunisia’s vaccine supply. In addition, the funds are going to strengthen key aspects of Tunisia’s vaccine deployment system, including safety surveillance; service delivery; upgrading the entirety of the national cold chain including the purchase of freezers and refrigerators; and developing communications campaigns to increase the uptake of vaccines. Finally, the funding will help the Tunisian government monitor and evaluate the deployment of vaccines.
Developing countries are going to be facing challenges for years to come as a result of the COVID-19 pandemic, what inspires hope?

This is undoubtedly the case, however we expect some longterm positive effects of the
investments that the World Bank and our member countries are making to respond to the immediate health emergency that has the potential to pay dividends for years to come by creating more resilient and sustainable health systems. Take for example, the cold chain that is so important for some of the COVID-19 vaccines, investments in refrigeration at the point of health centers, can have long term benefits to the community to support the delivery of other vaccines and medicines. Or, take the example of public outreach campaigns on public health surrounding COVID-19. These campaigns, when put in place as part of a holistic response, can help increase public engagement on public health at large, and in the case of vaccines can raise vaccination rates for other diseases. Finally, investments in training of health workers, and equipment will have long-term effects that can strengthen health systems and support building human capital for years to come.
Photo credit: ©Dominic Chavez / World Bank
IN CONVERSATION WITH Bernice Van Bronkhorst

In December 2020, the World Bank Group announced a new, ambitious target that 35 percent of financing, on average, will have climate co-benefits over the next five years. Can you start by explaining what we mean by climate co-benefits and what gets counted?
Climate co-benefits refer to the share of financing dedicated to climate change adaptation or mitigation in operations financed by the World Bank. Simply put, co-benefits are World Bank financing that support climate action while also furthering other development objectives. It is more commonly known as climate finance, but we refer to this finance from our own accounts as “climate co-benefits” to distinguish it from dedicated climate finance coming from funds like the Climate Investment Funds, the Green Climate Fund, and the Adaptation Fund. The share of our finance with climate co-benefits rose from 18 percent in 2015 to 29 percent in 2020 for the World Bank Group.
This 35 percent target is part of the World Bank Group’s Second Climate Change Action Plan, which will cover 2021-2025. What lessons did we learn during implementation of the first Climate Change Action Plan (2015-2020) that influenced the new plan?
There were a number of lessons and positive results from the first Action Plan, including the scale at which the World Bank Group has provided climate finance: $83 billion over the past five years supporting developing countries to act on climate. What we’re also very proud of is that by undertaking a range of different measures, we’ve actually been able to mainstream
Director, Climate Change
climate considerations across the World Bank Group. All new World Bank-financed projects are screened for climate risk. Climate change considerations are taken into account at every stage of project design and have been integrated into 100 percent of the World Bank’s multi-year development strategies with developing country partners. By 2020, over 60 percent of World
Global
“ THE WORLD BANK SUSTAINABLE DEVELOPMENT BONDS & GREEN BONDS | IMPACT REPORT 2020 16
All new World Bank-financed projects are screened for climate risk. Climate change considerations are taken into account at every stage of project design and have been integrated into 100% of the World Bank’s multiyear development strategies with developing country partners.
Bank Group projects included climate considerations, and over 80 percent for IBRD, up from 26 percent in 2015 for World Bank Group as a whole. It’s now across the majority of our transactions and investments, including in sectors like health and governance.
So much is still needed to get countries back on their feet and the focus remains on the health response to the pandemic and strengthening health systems. Yet, we hear a lot about a “green” recovery. What does that mean for the World Bank and its member countries?
First, it is important to recognize that like the COVID-19 pandemic, climate-related shocks disproportionately affect the poorest and most vulnerable. What we do today will determine how well prepared we are to handle future risks and shocks. As governments take urgent action and lay the foundations for their financial, economic, and social recovery, they have a unique opportunity to create economies that are more sustainable, inclusive and resilient. For example, short and long-term recovery efforts should prioritize investments that boost jobs and economic activity; have positive impacts
Financing a Green Recovery
on human, social and natural capital; protect biodiversity and ecosystems services; boost resilience; and advance the decarbonization of economies.
Looking forward, what will the World Bank’s focus in terms of climate action?
We’re intending to raise the bar on more fully integrating climate and development through our new Action Plan, key elements of which we presented to our board in April 2021. We are:
• Aligning our financing with the goals of the Paris Agreement – the World Bank will align all new operations by July 1, 2023. We are the first international financial institution working primarily in developing countries to make this type of announcement.
• Introducing new metrics with a greater focus on reducing greenhouse gas emissions, and adaptation and resilience goals, which put emphasis on making vulnerable communities stronger and better able to cope with climate shocks.
• Improving and expanding climate diagnostics with a strong analytical base at the global and country levels to support preparation
and implementation of our client countries’ Paris commitments.
• Supporting transformative investments in systems that contribute the most to emissions and have the greatest climate vulnerabilities, like energy, food systems, cities, transport, and manufacturing.
• Significantly increasing our support for a just transition away from coal for client countries that request assistance. Importantly, we will seek to mobilize the further large-scale resources to support this. One example is the jobs and skills transition for people working in the coal sector. Another is helping countries replace coal with affordable, reliable and cleaner alternatives as they expand electricity access.
• Increasing our climate finance so 35 percent of World Bank Group financing has climate co-benefits, representing a major increase in climate action funding for developing countries. It’s a big step up from the 26 percent achieved on average in FY1620 and an even bigger step in dollar terms as our total financing has expanded.
Photo credit: ©Dominic Chavez / World Bank
Introduction
THE WORLD BANK SUSTAINABLE DEVELOPMENT BONDS & GREEN BONDS | IMPACT REPORT 2020 18
Photo credit: ©Deborah W. Campos / World Bank
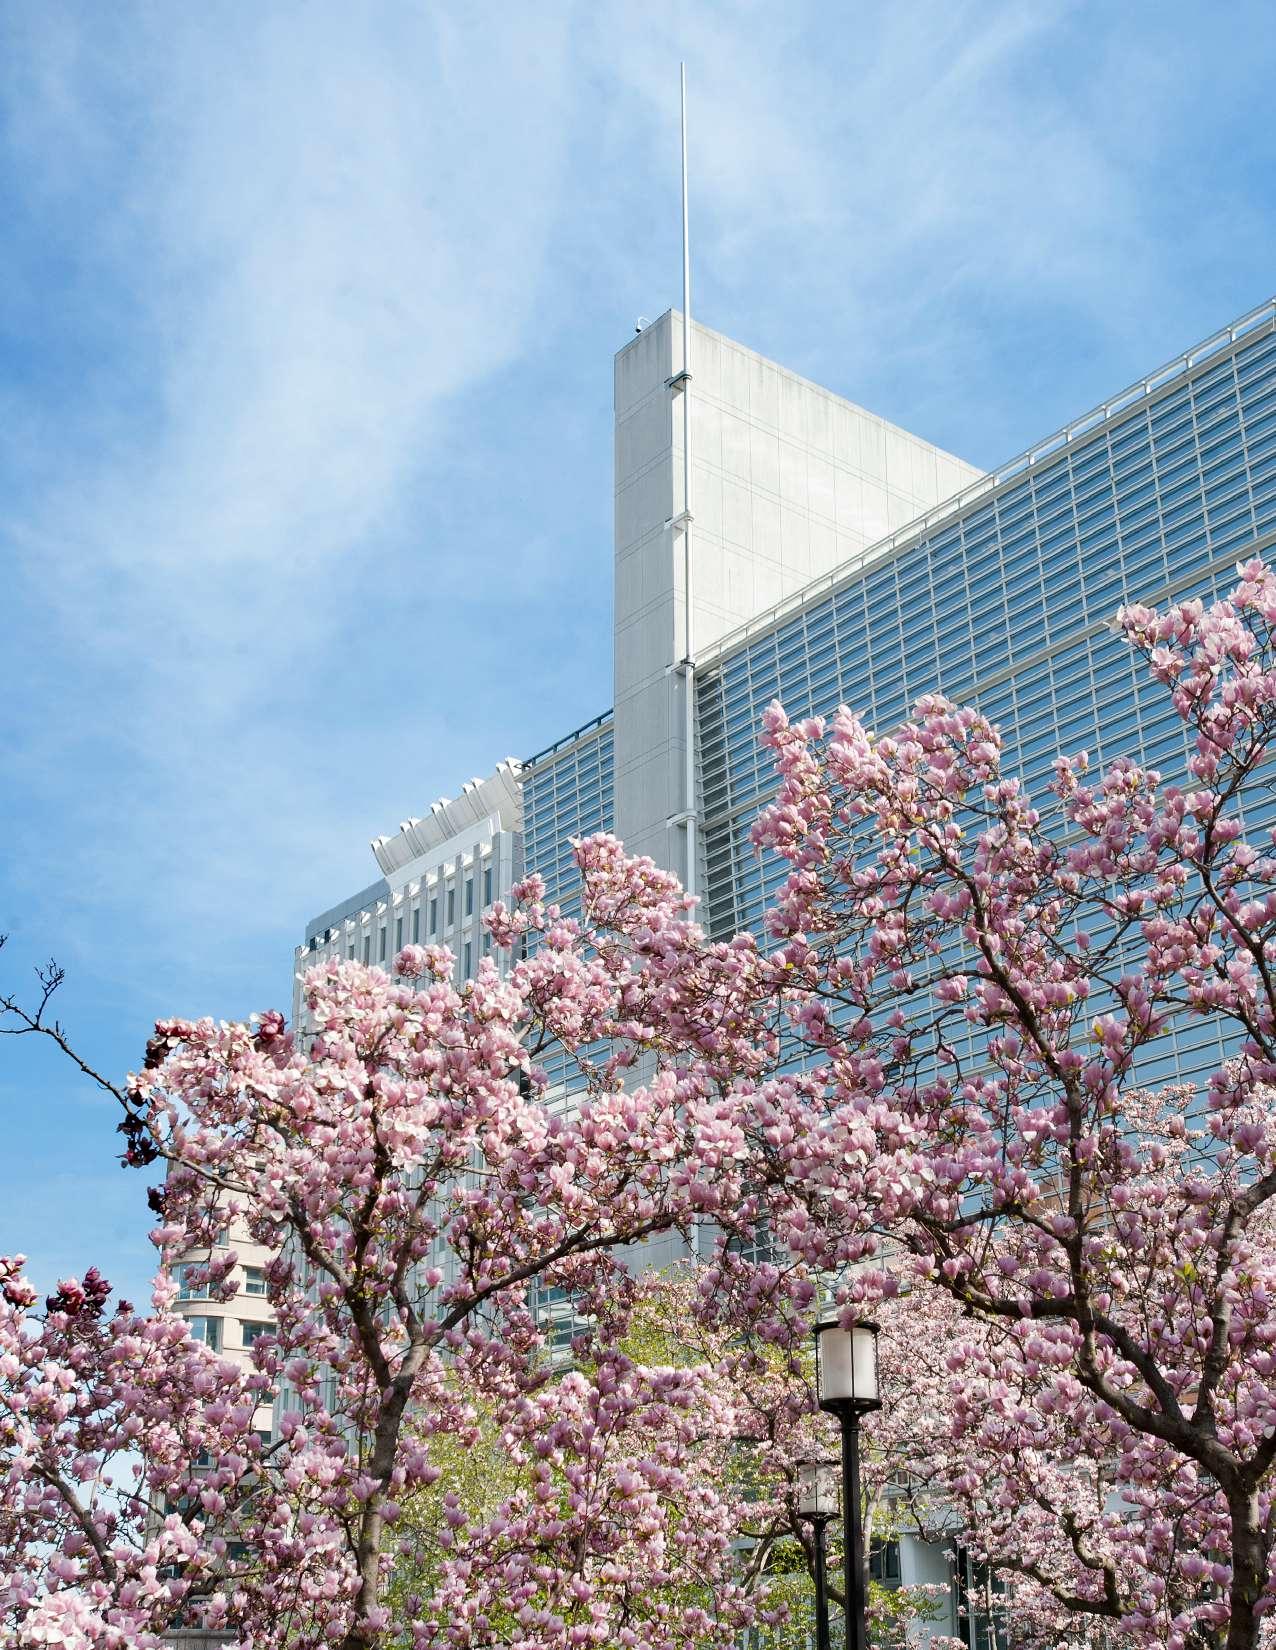
ABOUT THE WORLD BANK Mission & Strategy

The International Bank for Reconstruction and Development (IBRD) was established in 1944 and is the original member of the World Bank Group. IBRD is an international organization and global development institution owned by 189 member countries. As the largest development bank in the world, it supports the mission of the World Bank Group³ by providing loans, guarantees, risk management products, and advisory services to middleincome and creditworthy lowincome countries.
Today, IBRD and the International Development Association (IDA), which was established in 1960 and lends to low-income countries, share the same leadership and staff.⁴ Both IBRD and IDA issue bonds in the international capital markets to support the development mission. This report focuses on IBRD bond issuance, projects, and results.
At the heart of the World Bank Group’s strategy are two goals:
• To end extreme poverty: reduce the percentage of people living on less than US$1.90 a day to three percent by the year 2030.
• To promote shared prosperity: foster income growth for the bottom 40 percent of the population in every developing country.
To deliver on the twin goals as well as support the SDGs, the World Bank Group ’s management and shareholders have agreed on three main priorities for its work with developing countries, including those affected by fragility, conflict, and violence: accelerate sustainable and inclusive growth, invest in human capital, and strengthen resilience.
This overarching strategic framework rests on four pillars:
(1) serving all clients in low- and middle-income countries; (2) creating markets, mobilizing finance for development, and expanding the use of private sector solutions; (3) leading on global issues; and (4) improving the ways we do business to be agile, efficient, and closer to clients.
The World Bank Group is committed to bringing together the international community in the urgent task of achieving the goals by 2030. They can be reached only through the collaboration of all partners, including countries, other institutions, civil society, and the private sector.
3 The World Bank Group consists of five organizations: International Bank for Reconstruction and Development, International Development Association, International Finance Corporation, Multilateral Investment Guarantee Agency and International Centre for Settlement of Investment Disputes.
4 For the purpose of this report, “World Bank” or the “Bank” refers to IBRD.
ABO ut t HE WOR l D BA n K | Missi O n & s t RAt E gy 19
THE WORLD BANK’S APPROACH
Engaging with Investors on the Sustainable Development Goals
IBRD issues bonds with two types of labels: World Bank Sustainable Development Bonds which support the financing of a mix of green and social projects and World Bank Green Bonds.⁵ All World Bank development operations are designed to achieve positive environmental and social impacts and outcomes consistent with the World Bank Group’s twin goals of ending extreme poverty and advancing shared prosperity. Operations are approved by the World Bank Board of
Executive Directors after an extensive internal review process, which integrates sustainability policies and environmental and social requirements.
In FY20, we used our bond issuance program to engage investors on the World Bank’s development mandate, explain how the use of bond proceeds supports the financing of sustainable development activities, and describe how these activities contribute to the
SDGs. Below are examples of the themes and SDGs of FY20 and a selection of transactions executed over the fiscal year.⁶ All Sustainable Development Bonds issued while raising awareness for specific themes or SDGs are issued under the World Bank’s Sustainable Development Bond Framework
US$8 B Benchmark
April 2020
In March 2020, the World Bank began engaging with investors about how it was working decisively and rapidly with member countries to support their response to COVID-19, which poses a major threat to achieving the SDGs. To help fund the Bank’s COVID response, over two days in April, IBRD launched four benchmark transactions across four currencies raising a record US$15 billion equivalent. This included a landmark US$8 billion benchmark bond, the largest-ever US dollar denominated bond issued by a supranational issuer on April 15, 2020. Bond proceeds are supporting the financing of projects that are helping countries purchase PPE and ventilators, support health worker training and equipment procurement, strengthen health systems to build resilience and assist vaccine rollout, address the disproportionate impacts of the pandemic on women and girls, support distance learning and safe schooling, enhance social protection systems, and strengthen the financial sector.
5
6
particular projects,
Returns on World Bank
are not linked to the performance of any particular projects, programs or activities.
Examples of the types of projects supported by World Bank bonds are outlined in the Resources section of this document.
The net proceeds from the sale of any World Bank bonds are not committed or earmarked for the lending to, or financing of, any
programs or activities.
bonds
THE WORLD BANK SUSTAINABLE DEVELOPMENT BONDS & GREEN BONDS | IMPACT REPORT 2020 20
The projects featured here are for illustrative purposes only. No assurance can be provided that disbursements for projects with these or similar characteristics will be made by the World Bank in the future. The net proceeds from the sale of any World Bank bonds are not committed or earmarked for the lending to, or financing of, any particular projects, programs or activities. Returns on World Bank bonds are not linked to the performance of any particular projects, programs or activities.
COVID-19
CA $1.5B
Benchmark
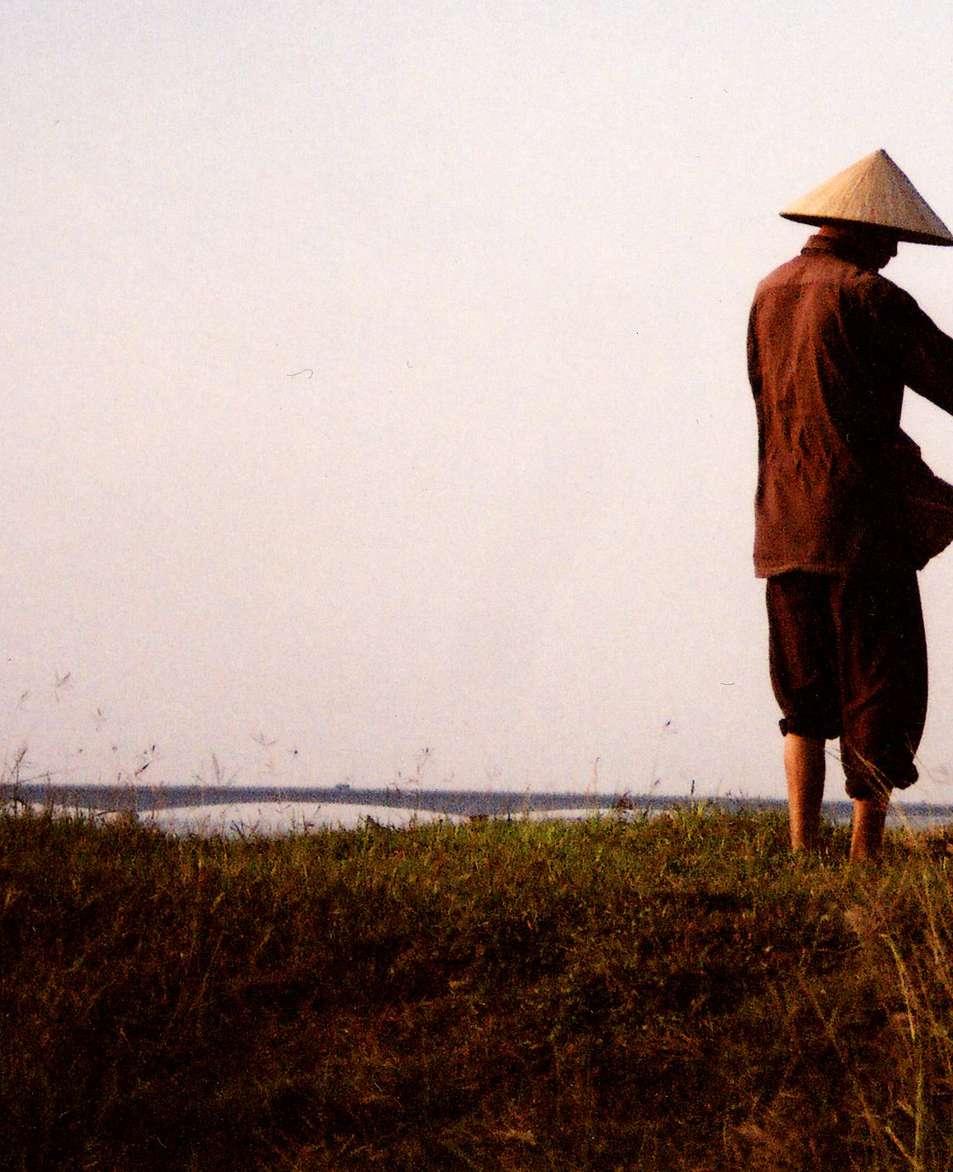
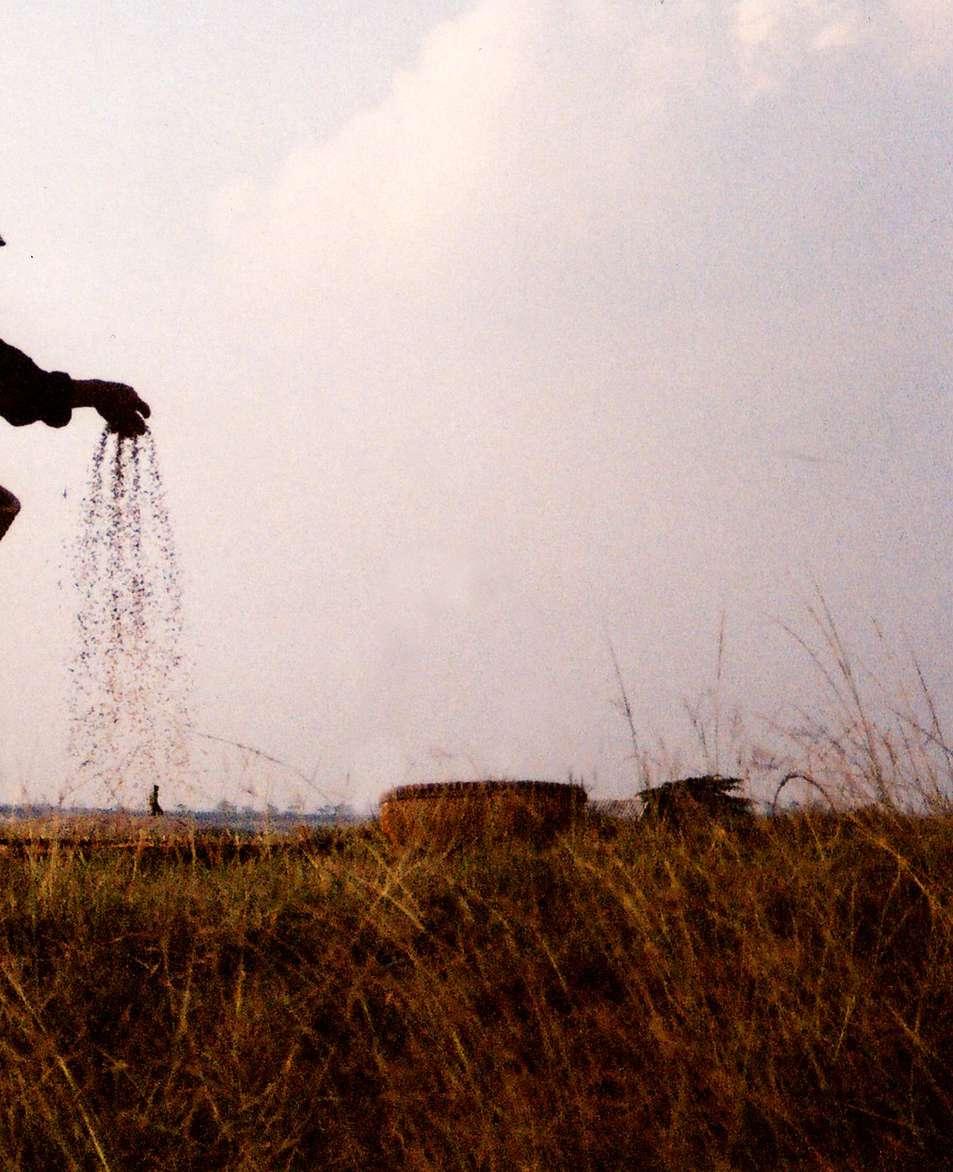
Water
The World Bank is the world’s largest multilateral source of financing for water in developing countries with over US$25 billion in water-related investments across 139 projects. Our vision is a water-secure world for all, which we support through operations aimed at sustaining water resources, delivering services, and building resilience. Safely managed water, sanitation, and hygiene (WASH) services are an essential part of protecting human health during infectious disease outbreaks, including the current COVID-19 pandemic. Three priority areas are included in projects that are part of the World Bank’s emergency response: safe WASH services in health care facilities; improving handwashing behavior, food hygiene, and safe water practices; and emergency support to secure and extend water and sanitation service provision. IBRD’s Water portfolio is currently comprised of 64 projects with total commitments of US$13.4 billion. A variety of investors have helped raise awareness for the importance of sustainable use of water and marine resources from Canadian and Scandinavian institutional investors to Japanese retail investors.
Blue Economy

The World Bank helps client countries transform the way they manage their marine and coastal resources in a more sustainable and integrated way on a path to a Blue Economy. The World Bank’s engagement, which includes sustainable fisheries, more resilient coastlines, reduced pollution and improved knowledge and capacity around ocean health, is supported by PROBLUE. With the COVID-19 pandemic, the World Bank is supporting communities through investments providing livelihood support in sectors like fisheries, tourism, and ecotourism and is well-positioned to boost smaller enterprises, easing pressure from the loss of jobs and allowing for early inclusion of vulnerable groups, including women. With increased single-use plastics and medical waste ending up in oceans, the World Bank is embracing this challenge, based on decades of experience in financing pollution prevention projects, providing technical expertise across many sectors, and bringing together key players. In addition, the World Bank is increasing support to healthcare waste management activities in COVID-19 emergency projects.
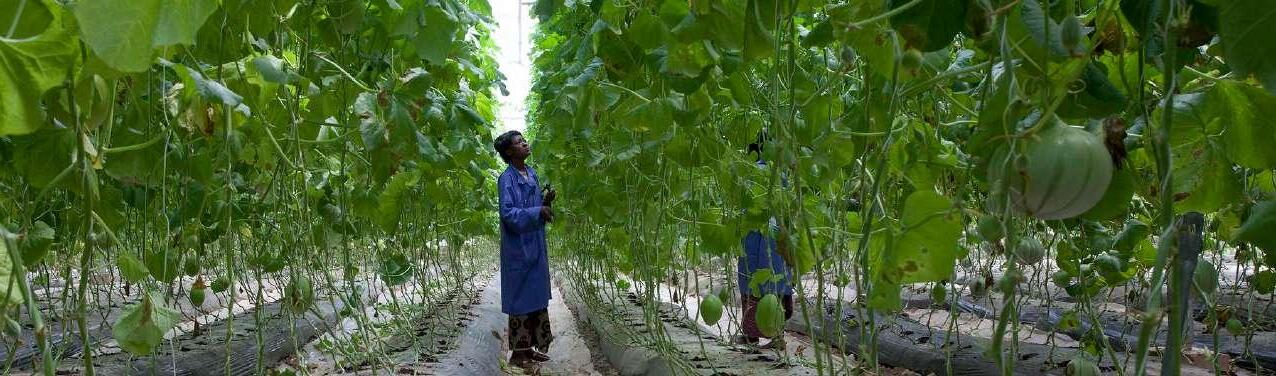
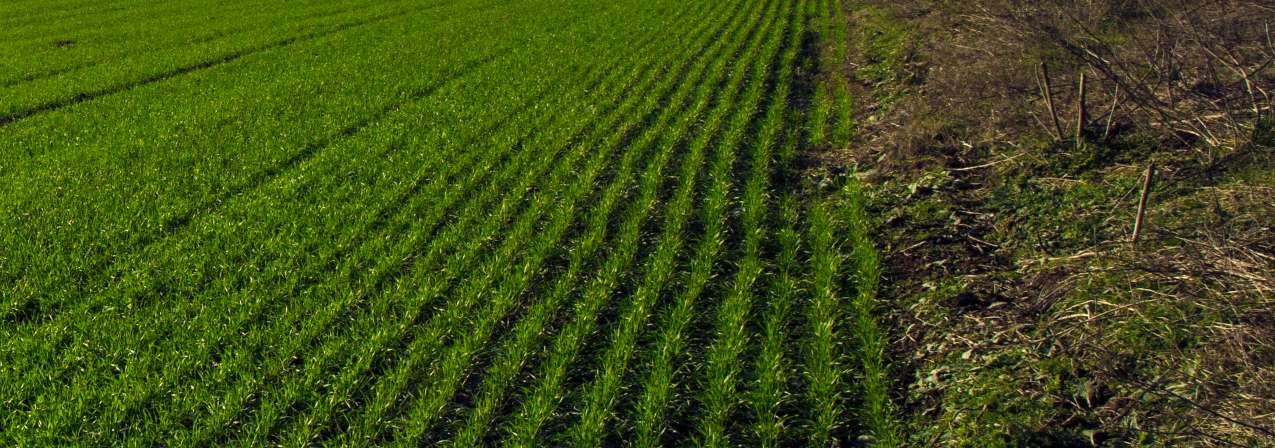
Food Loss & Waste
US$2 B eq. MarchDecember 2019

Investments that reduce food loss and waste can help address both food security and environmental sustainability. COVID-19 has further exposed the vulnerabilities of food supply chains globally and locally. The pandemic may add up to 130 million undernourished people in the world and is increasing the urgency to tackle food loss and waste locally to help reduce food insecurity. The World Bank’s flagship report, Addressing Food Loss and Waste: A Global Problem with Local Solutions, launched in September 2020, analyzes why food loss and waste has been difficult for countries to manage and propose country-specific and even commodity-specific solutions. World Bank-financed projects are helping countries improve post-harvest technologies for food storage, handling and processing, develop cold chain infrastructure and biogas energy facilities, and create cooperatives and access to markets. IBRD’s Food Loss and Waste portfolio is currently comprised of 34 projects across regions with total commitments of around US$5.8 billion. Japanese and Scandinavian investors have shown strong interest in this theme.
Climate Action

Over the last five years, the World Bank Group has been mainstreaming climate considerations across investments and operations – working to ensure that 28% of our total financing had ‘climate co-benefits’. In December 2020, the World Bank Group announced a new and ambitious target of 35% for climate co-benefits as a percentage of total financing over the next five years to support direct climate action for our clients, helping them address climate change and adapt to its mounting impacts. The World Bank is also piloting a new Resilience Rating System in over 20 World Bank-financed projects across all regions, covering human development, infrastructure, and sustainable development to rate how well a project plans for climate risk and builds the resilience of people. Today, every World Bank project is screened for climate co-benefits and the World Bank reports annually on the GHG emissions reductions achieved across its lending operations.7 In FY20, IBRD-financed projects had projected net GHG emissions reductions of 12.5 million tCO₂ eq/year. In FY20, the World Bank launched its first green bond denominated in Danish kroner.⁸
7 Project net greenhouse gas (GHG) emissions are calculated as an annual average of the difference between project gross (absolute) emissions aggregated over the economic lifetime of the project and the emissions of a baseline (counterfactual) scenario aggregated over the same time horizon. The indicator applies to operations that are subject to GHG accounting under the corporate mandate. This includes IBRD investment lending in Sustainable Development Global Practices (Energy & Extractives, Transport & ICT, Environment & Natural Resources, Social, Urban, Rural and Resilience, Water, and Agriculture) where agreed GHG accounting methodologies exist. The indicator is based on an ex-ante estimation performed during project preparation using World Bank-approved GHG accounting methodologies. The indicator value is negative if the portfolio is reducing emissions, and positive if the project is increasing emissions. The World Bank has committed to report GHG emissions for the World Bank portfolio (i.e., IDA and IBRD combined) and the disaggregation of the two may not always be available.
NOK 2.5 B Benchmark November 2019
January 2020
This
the
Photo credit: ©Quy-Toan Do / World Bank t HE WOR l D BA n K’ s APPROACH | Eng A ging W it H i n VE st OR s O n t HE s ustA in AB l E D EVE l OPME nt gOA ls 21
8
bond was issued under
World Bank’s Green Bond Framework
FY20 Impact Highlights
Sustainable & Inclusive Growth
Provide enhanced access to transportation services for
90,000 People
235 MW Construct or rehabilitate of energy generation capacity
2.2 Million People
Provide with new or improved electricity service
Produce of new or improved irrigation or drainage services
2.3 Million People
Benefit with job-focused interventions
Provide financial services to
1.3 Million People
45,800 Farmers Support in adopting improved agricultural technology
9 “Added to the Sustainable Development Bond project portfolio” indicates projects that began disbursing in FY20. 10 The expected results, presented above, have been aggregated where possible according to set of core indicators and therefore represent a subset of expected results from the 100 new projects that began disbursing in FY20 (July 1, 2019 - June 30, 2020) and were added to the SDB project portfolio. Detailed information on these projects is available in the Project-by-Project Reporting section of this report. For information on the composition of the indicators presented above, please refer to World Bank Group Corporate Scorecards
285,069 Hectares THE WORLD BANK SUSTAINABLE DEVELOPMENT BONDS & GREEN BONDS | IMPACT REPORT 2020 22
100

New Projects
Human Capital
added to the Sustainable Development Bond project portfolio9 in FY20 are expected10 to
9.0 Million Beneficiaries
Cover with social safety net programs
3.6 Million People
Provide with essential health, nutrition, and population services

6 Learning Assessments
Complete at the primary/ secondary level
Resilience
Reduce greenhouse gas emission by
6.5 Million tCO2 eq. annually*
1.2 Million People
Provide with access to improved water sources
285,345
Provide with access to improved sanitation services
People
Provide with improved urban living conditions
3.5 Million People
1,220 Wind Turbines running for a year* equivalent to
Photo Credit: @Sambrian Mbaabu / World Bank
* Source: US Environmental Protection Agency Greenhouse Gas Equivalencies Calculator, CIA World Factbook
i MPAC t | F y 20 iMPAC t Hig H lig H ts 23
Looking Through an SDG Lens
The World Bank is working to build sustainable capital markets with a focus on building models for transparency and disclosure, such as impact reporting.
We do this in part through collaboration with the International Capital Market Association, the Network for Greening the Financial Sector, the Stockholm Environment
Institute (SEI) and others. Our collaboration with SEI has focused on developing a methodology to map projects financed by the World Bank to the SDGs. The methodology
Region/Project
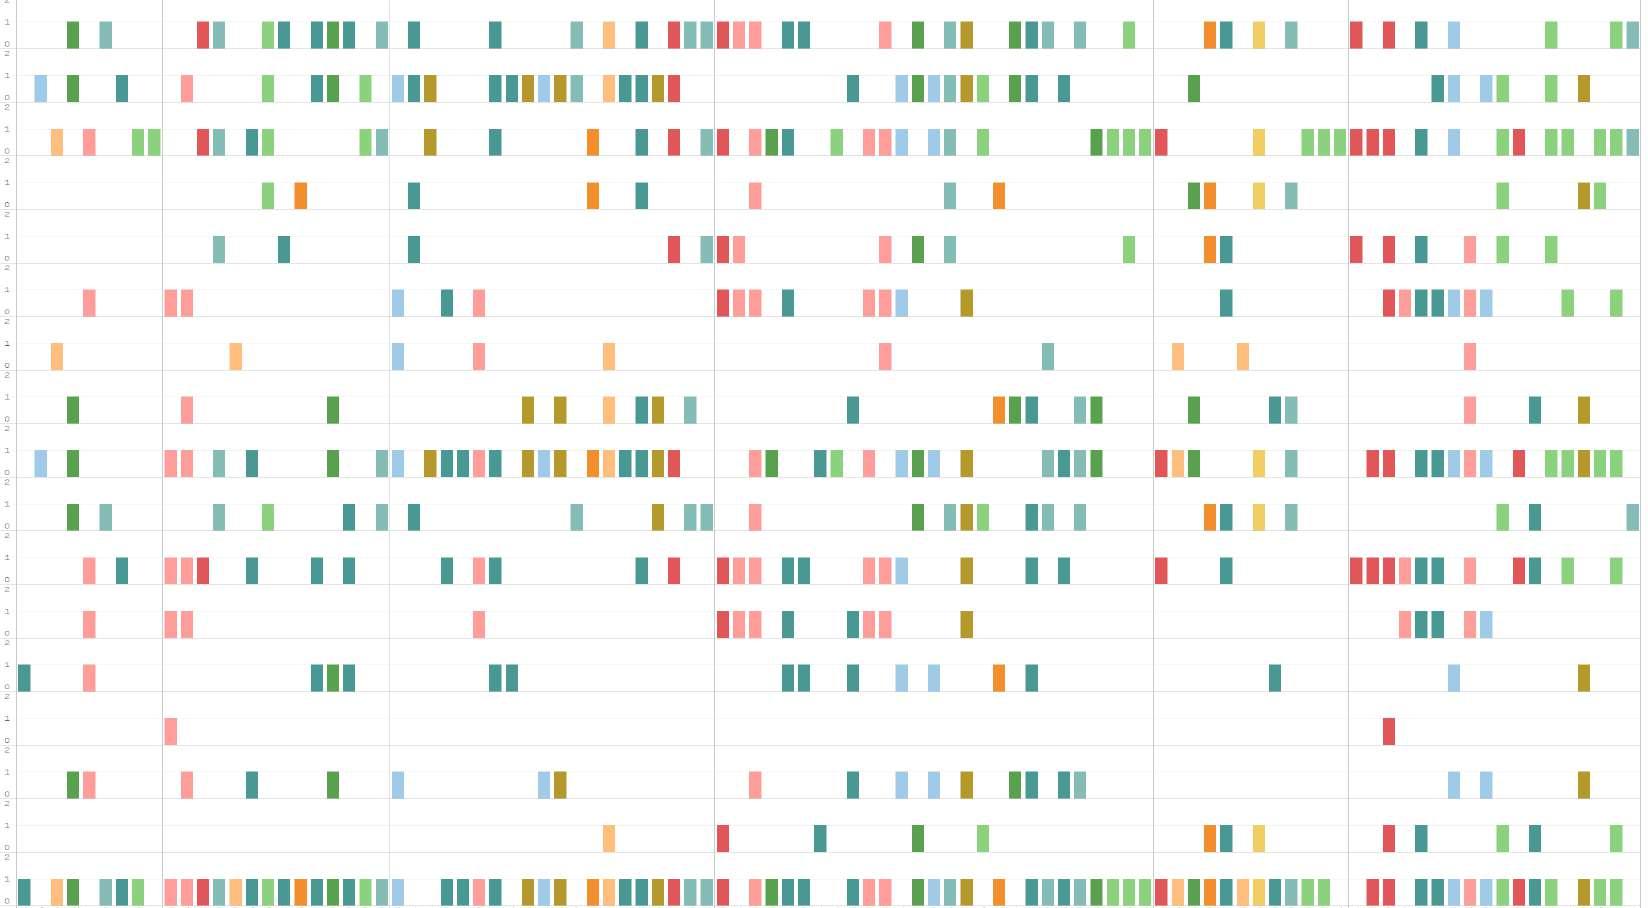
WORLD BANK PROJECT PORTFOLIO
FY20
P160628 P164486 P166170 P166564 P166697 P169779 P172321 P173883 P173927 P157245 P158124 P158733 P162349 P163679 P163896 P164686 P165543 P168076 P170052 P170940 P171440 P173799 P174120 P158418 P160594 P162043 P162929 P163673 P164260 P166302 P166303 P166305 P166941 P167634 P168280 P168481 P169117 P169624 P169913 P170185 P170267 P170343 P173911 P156880 P157043 P157575 P157715 P159351 P159710 P162594 P163255 P164588 P165055 P165695 P165973 P166187 P166279 P167416 P167455 P167996 P168911 P169505 P170223 P170329 P170728 P171190 P172863 P173767 P173773 P173805 Goal 17 Goal 16 Goal 15 Goal 14 Goal 13 Goal 12 Goal 11 Goal 10 Goal 9 Goal 8 Goal 7 Goal 6 Goal 5 Goal 4 Goal 3 Goal 2 Goal 1 THE WORLD BANK SUSTAINABLE DEVELOPMENT BONDS & GREEN BONDS | IMPACT REPORT 2020 24
Africa East Asia & Pacific Europe & Central Asia Latin America & the Caribbean
applies automated text mining software to match each project to the SDG targets they potentially contribute to. To do this, SEI developed a set of keywords related to the topics of all 169 SDG targets. Then, using the KH coder software 11 , SEI recorded the occurrence of SDG keywords in the World Bank
project details – if one or more SDG keywords appear in the text, then that project is mapped to the related SDG. SEI developed this methodology based on its NDC-SDG Connections Tool 12 which visualizes potential synergies between the SDGs and countries’ climate actions towards their Nationally Determined Contributions.
Agriculture, Fishing & Forestry
Education
Energy & Extractives
Financial Sector
Health
Industry, Trade & Services
Information & Communications
Public Administration
Social Protection
Transportation
Water, Sanitation & Waste
Management
The aim of this work is to explore methodologies to provide a lens through which investors can see indicative contributions of World Bank-financed projects to the SDGs and to share the preliminary results to support other issuers and investors in connecting project results or investments to the SDGs. A more detailed version of the methodology will be published later in 2021.
As a test case, the methodology has been applied to the 100 new IBRD projects that began disbursing in FY20 and were subsequently added to the World Bank SDB project portfolio. The visualization below presents the identified links between World Bank-financed projects and the SDGs. The codes of the projects are presented along the bottom horizontal axis and the colors of the bars indicate the related World Bank sector. An additional visualization of the SDG mapping results is available in the Projectby-Project Reporting section of this report.
/Notes: The mapping methodology developed by SEI represents one of the many solutions available for indicative mapping of investments to the SDGs. Differences between the methodology presented in this report and other approaches, include but are not limited to:
(a) the criteria and methodology used to identify the links to the SDGs;
(b) graduation of the strength of identified links to the SDGs and their relative importance (e.g. based on the intensity of their contribution or on the project’s commitment);
(c) the framework selected for the mapping (e.g. mapping World Bank projects and sectors directly to SDGs or World Bank themes or Global Practices).
For these reasons, different methodologies are likely to result in distinct, and perhaps slightly divergent, mapping results.
11 Higuchi, K (2001) KH coder. Available at: http://khcoder.net/en/
12 www.sei.org/publications/the-sustainable-development-goals-viewed-through-a-climate-lens/
g g g g g
g g g g g g
P160224 P162454 P162835 P167619 P168147 P168273 P168425 P168580 P170669 P173945 P173972 P173994 P147864 P157141 P157929 P158119 P158502 P161402 P163533 P164704 P165129 P166373 P166732 P166923 P167523 P167581 P168310 P173836 P173867 P173943 F y 20 WOR l D BA n K PROJEC t POR t FO li O | lOOK ing tHRO ug H A n s D g lE ns 25
Middle East & North Africa
South Asia
PROMOTING SUSTAINABLE CAPITAL MARKETS
Engaging Stakeholders to Build Sustainable Capital Markets
A key priority for the World Bank’s capital markets engagement is building strategic partnerships with investors and other market participants and working groups to promote the importance of private sector financing in sustainable development. The World Bank is a founding member of the Green Bond Principles coordinated by the International Capital Market Association and in June 2020, was reconfirmed
as a member of the executive committee of the Green, Social, Sustainability and SustainabilityLinked Bond Principles. This cooperation includes serving on working groups that provide practical guidance to the market on impact reporting, social bonds, just transition, climate transition finance and sustainability-linked bonds. The World Bank is also an observer to the Network for Greening the Financial System where we
contributed to “A sustainable and responsible investment guide for central banks’ portfolio management”
Over the past year, we have had opportunities to contribute to the discussion on mainstreaming ESG and building sustainable capital markets, highlighting key development challenges, to direct more capital to sustainable use. Here are some highlights of these activities:
2020 Awards & Recognition
Most Impressive SSA Issuer Funding Strategy During COVID-19 Pandemic
SSA Bond of the Year: US$8 billion five-year Sustainable Development Bond
Niche-Market Bond: A$1.65 billion Dual-Tranche Sustainable Development Bond
Kangaroo Issuer of the Year
SSA Kangaroo Bond Deal of the Year: A$1.1 billion 0.5% May 2026 & A$550 million 1.1% November 2030 Bond
Kauri Issuer of the Year
Kauri Bond Deal of the Year: NZ$1 billion 0.75% June 2026 & NZ$300 million 1.25% December 2030 Bond
the
Supranational Dollar Bond of
Year
Bond of the Year
Risk-Free Rate
GlobalCapital IFR KangaNews THE WORLD BANK SUSTAINABLE DEVELOPMENT BONDS & GREEN BONDS | IMPACT REPORT 2020 26
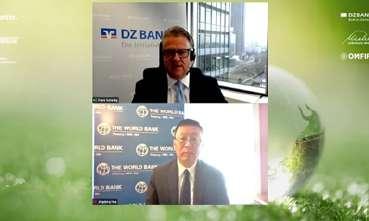
The Role of Capital Markets in Implementing the Global Sustainability Agenda
March4th,2021
Jingdong Hua, Vice President and Treasurer of the World Bank, speaks to Frank Scheidig, Global Head of Senior Executive Banking at DZ Bank, at a global round table hosted by DZ Bank, the Official Monetary and Financial Institutions Forum (OMFIF) and Maleki on how the World Bank connects global savings to development highlighting the World Bank’s support for countries to respond to the COVID pandemic.
World Bank Treasury Heads on Sustainable Finance Outlook


October15th,2020
World Bank’s Head of Investor Relations and Sustainable Finance, Heike Reichelt and Head of Funding, Andrea Dore, speak with Bloomberg’s Sonali Basak at the Canadian Fixed Income event on the World Bank’s funding program, its COVID response and engagement with investors on ESG and specific themes and development challenges.
Fighting Food Loss and Waste in the Nordics
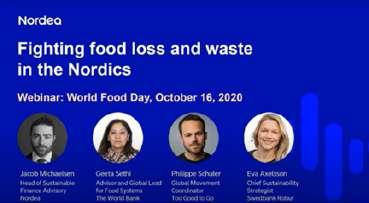
October16th,2020
In honor of the 75th anniversary of World Food Day, Nordea’s Head of Sustainable Finance Advisory Jacob Michaelsen hosted a special webinar to help put the spotlight on issues of food waste, food insecurity and climate change. Geeta Sethi, Advisor and Global Lead for Food Systems at the World Bank, joined the conversation. This event was part of World Bank investor outreach in Scandinavian markets.
MTN-i
SSA - Deal of the Year:
SEK11.5 billion 0.25% Sustainable Development Bond due December 2022
SRI: Green/Social/ Sustainable - Deal of the Year:
• SEK11.5 billion 0.25% Sustainable Development Bond due December 2022
• US$485 million Multi-Tranche
Mexico Catastrophe Bonds due April 2024
LIBOR Transition - Deal of the Year: US$700 million SOFR FRN due August 2027
Local Currencies - Deal of the Year: SEK11.5 billion 0.25% Sustainable Development Bond due December 2022
Private Benchmarks - Deal of the Year:
• US$700 million SOFR FRN due August 2027
• US$485 million Multi-Tranche

Mexico Catastrophe Bonds due April 2024
14th Americas Structured Notes Awards
• Callable Issuer of the Year
• Deal of the Year: US$1 billion
2.3% 5NC3M/3M Fixed Rate MTNs due October 2020
PROMO ting sustA in AB l E CAP itA l MARKE ts | Eng A ging s tAKEHO l DER s t O Buil D s ustA in AB l E C AP itA l M ARKE ts 27
PROGRAM SUMMARY
Sustainable Development Bonds
 Photo Credit: @ / Adobe Stock
DEVELOPMENT
Fiscal Year Results
599 Projects13
supported by Sustainable Development Bonds are helping member countries make progress toward national priorities and the SDGs. Results achieved14 include:
Sustainable & Inclusive Growth
3.0 Million People
Provided with enhanced access to transportation services
2,514 MW
Constructed or rehabilitated of energy generation capacity
Provided new or improved electricity service for
8.0 Million People
679,000 Farmers
Reached with agricultural assets & services
377,384 Farmers Supported to adopt improved agricultural technology
132,200 Hectares
Provided of new or improved irrigation or drainage services
3.1 Million People
Benefitted with job-focused interventions
280,000 People
Provided with access to internet (ICT)
Provided financial services to

500,721 People
Covered with social safety net programs

1.1 Million Beneficiaries
Completed at the primary/ secondary level
12 Learning Assessments
Human Capital Resilience
Reduced net greenhouse gas emissions by
12.5 Million tCO2 eq. annually
3.8 Million People
Provided with access to improved water sources People
635,510 Provided with access to improved sanitation services
2.5 Million Cars off the road for one year* equivalent to
5.0 Million People
Provided with improved urban living conditions
Projected energy or fuel savings of
2.09 x 10⁷ MWh/
7.53 x 10¹⁰ MJ
Total Electricity consumed in Azerbaijan in 2018** equivalent to the
SUSTAINABLE
BONDS | PROGRAM SUMMARY
*Source: US Environmental Protection Agency Greenhouse Gas Equivalencies Calculator, CIA World Factbook. ** Source: US Energy Information Administration. THE WORLD BANK SUSTAINABLE DEVELOPMENT BONDS & GREEN BONDS | IMPACT REPORT 2020 30
Issuance Highlights
Annual Issuance
$75 Billion
in bonds issued across
Structured / Risk Transfer Notes
Other Plain Vanilla Bonds Benchmark / Global Bonds
349 Transactions and
FY20 Issuance by Currency
13 The IBRD project portfolio comprises 520 active projects and 79 projects which closed during FY20.
14 The results presented above include outcomes and outputs of World Bank (IBRD)-supported activities. Results are reported for active operations and those that closed within the reporting period. The results reported are those achieved by client countries, with support from the World Bank. It should be noted that these results represent a subset of results. Results are dynamic from year to year and annual data may fluctuate significantly due to the size or number of projects reporting data during a given fiscal year. These “Tier 2” World Bank results are mainly drawn from CRIs, which are sector outcome or output indicators that can be measured and monitored at the project level and aggregated across operations and countries. CRIs are integrated in the results frameworks of individual operations. CRIs can be supplemented by customized, projectspecific results indicators. More information on the definition of each “Tier 2” indicator can be found at https://scorecard.worldbank.org/
80 70 60 50 40 30 20 10 0
US$ Billions
27 Currencies supported member countries’ progress toward national priorities and the SDGs.
62% US$ Other EUR 14% GBP 9% 15%
2016 2017 2018 2019 2020 issuance highlights sustA in AB l E DEVE l OPME nt BO n D s | PRO g RAM su MMAR y | issu A n CE H ig H lig H ts 31
Commitments & Allocations
By Sector:
9% Social Protection
13% Public Administration
20% Transportation <1% Information & Communications
12% Water, Sanitation & Waste Management 7% Health
5% Agriculture, Fishing & Forestry 5% Education 15% Energy & Extractives 7% Financial Sector 7% Industry Trade & Services
Notes: Amounts may not add up due to rounding.
/a Committed Amount indicates the World Bank (IBRD) aggregate loan amount net of cancellations in US$ equivalent billions. Loans denominated in other currencies are converted to US$ equivalents using the exchange rate as of the month end prior to the negotiation date. Similarly, cancellations of loans denominated in other currencies are converted to US$ equivalents using the exchange rate on the value date of the cancellation.
/b Allocated Amount indicates the total World Bank (IBRD) bond proceeds in US$ equivalent billions allocated to support the financing of disbursements to eligible projects. Disbursements of loans denominated in other currencies are converted to US$ equivalents using the exchange rate on the value date of the transactions under the loan.
SUSTAINABLE
DEVELOPMENT BONDS | PROGRAM SUMMARY
THE WORLD BANK SUSTAINABLE DEVELOPMENT BONDS & GREEN BONDS | IMPACT REPORT 2020 32 Committed /a Allocated /b Sector US$eq. billion A griculture, Fishing & Forestry 6.9 2.4 Education 6.0 2.6 Energy & Extractives 19.0 11.7 Financial Sector 8.4 5.2 Health 8.3 3.4 Industry, Trade & Services 9.0 4.9 Information & Communications 0.3 0.1 Public A dministration 15.7 11.7 Social Protection 10.9 7.3 Transportation 24.6 15.1 Water, Sanitation & Waste Management 15.5 7.7 Total 124.5 72.3
By Region:
sustA in AB l E DEVE l OPME nt BO n D s | PRO g RAM su MMAR y | C OMM it ME nts & All OCAti O ns 33 LAC 23% SAR 16% EAP 21% ECA 19% MNA 15% AFR 6% Committed /a Allocated /b Region US$eq. billion Africa (AFR) 15 7.8 5.2 East Asia & Pacific (EAP) 26.2 15.6 Europe & Central Asia (ECA) 23.7 14.5 Latin America & Caribbean (LAC) 27.9 17.9 Middle East & North & Africa (MNA) 18.5 10.5 South Asia (SAR) 20.4 8.6 Total 124.5 72.3
15 IBRD lends to middle-income and creditworthy low-income countries. The International Development Association (IDA) lends to low-income countries including many in Africa.
Featured Project
57,000 People benefitting from reduced flood risk
13 provided with essential PPE and medical supplies to respond to COVID-19
Hospitals
THE WORLD BANK SUSTAINABLE DEVELOPMENT BONDS & GREEN BONDS | IMPACT REPORT 2020 34
AGRICULTURE, FISHING FORESTRY
Saramacca Canal System Rehabilitation Project in Suriname
Suriname is one of the most vulnerable countries in the world to the impact of flooding and disaster risks. The major floods that afflicted the country highlighted the population’s vulnerability to adverse natural shocks. Flooding severely affected the coastal region, which includes Paramaribo, where the bulk of Suriname’s population lives and where most of the country’s physical assets are concentrated.
The Saramacca Canal System Rehabilitation Project aims to reduce flood risk for people and assets in the greater Paramaribo area and improve the operation of the Saramacca Canal System. The project includes a Contingency Emergency
Response Component (CERC) of US$410,000 to finance eligible disaster emergency relief and recovery expenditures. In response to the rapidly evolving COVID-19 emergency, Suriname was among the first clients in the region to activate the CERC to prepare the national health system to restrain the spread of the virus in the country.
The prompt response resulted in the a timely purchase of PPE for medical workers and medical supplies and consumables that
• Project #: P165973
were distributed among key hospitals assigned to respond to COVID-19. As a result, Suriname’s national health system was prepared to deal with the crisis immediately after the first infection cases were recorded in the country. A quick disbursement under the CERC mechanism and the client’s proactiveness and efficiency have contributed to reducing the risk and containing the COVID-19 epidemic more effectively, thus limiting human and economic losses in Suriname.
• IBRD Commitment: US$ 35 million
• Total Project Cost: US$ 35 million
• Approval Date: February 14, 2019
• Project Status: Active (closing December 31, 2024)
World
F EAtu RED P ROJEC t | sustA in AB l E DEVE l OPME nt BO n D s | su R in AME 35
Photo Credit: @ Abbas Farzami / Rumi Consultancy /
Bank
SUSTAINABLE DEVELOPMENT BONDS | SURINAME
COVID-19 Emergency Response and Health Systems Preparedness Project in Sri Lanka
When the COVID-19 pandemic hit, Sri Lanka was extremely vulnerable to the spread of the virus because of its thriving tourism industry and large expatriate population. Already facing fiscal constraints, the pandemic placed additional resource demands on the country. The challenge was to quickly coordinate the mobilization of financial, technical and procurement support to contain
• Project #: P173867
the pandemic. The World Bank responded quickly, leveraging the dedicated COVID-19 Fast-Track Facility, to mobilize resources and prepare the COVID-19 Emergency Response and Health Systems Preparedness Project.
The project is supporting the government’s ‘test, track, isolate and treat’ strategy to control the pandemic by providing a steady supply of essential medical necessities, testing kits
• IBRD Commitment: US$ 35 million
• Total Project Cost: US$ 215.8 million
• Approval Date: April 2, 2020
• Project Status: Active (closing December 31, 2023)
and PPE, supporting contact tracing efforts, and maintaining 32 quarantine centers. It is also working to strengthen the health system to better manage health emergencies in future while providing additional financial resources in the form of cash transfers to high-risk populations including the elderly and disabled and patients with chronic diseases. The project will also strengthen mental health services and services for victims of gender-based violence at the community level especially during emergency situations.
Photo Credit: @ Sk Alauddin Ali / Adobe Stock THE WORLD BANK SUSTAINABLE DEVELOPMENT BONDS & GREEN BONDS | IMPACT REPORT 2020 36
HEALTH SUSTAINABLE DEVELOPMENT BONDS | SRI LANKA
Featured Project
17 with COVID-19 diagnostic equipment, test kits, and reagents
Additional Laboratories
1,000
Health Staff trained in infection prevention and control
2 Million Beneficiaries provided with cash and in-kind transfers in response to COVID-19
11,000 Women utilizing gender-based violence services
F EAtu RED P ROJEC t | sustA in AB l E DEVE l OPME nt BO n D s | s R i l A n KA 37
Featured Project
4 Designated Public Hospitals
with fully equipped and functional ICUs for COVID-19 patients
70,000
Vulnerable Households receiving temporary cash benefits
800,000
PPE Purchased THE WORLD BANK SUSTAINABLE DEVELOPMENT BONDS & GREEN BONDS | IMPACT REPORT 2020 38
HEALTH & SOCIAL PROTECTION
Emergency COVID-19 Response Project in Georgia
COVID-19 poses serious social and economic challenges to Georgia and represents a severe risk of eroding important gains in the fight against poverty achieved during the past decade. In the absence of immediate mitigation measures, the COVID-19 health crisis is likely to be most severe for vulnerable households.
The purpose of the Emergency COVID-19 Project is to help the government’s efforts to mitigate and address the health and social impacts of the COVID-19 pandemic. The goal is to finance
measures that help prevent, detect and respond to the threat posed by the COVID-19 pandemic and provide immediate social protection support to the most vulnerable. It is expected to benefit the population at large, and especially infected people and at-risk groups such as the elderly and people with chronic conditions, as well as medical and emergency personnel. Health-related
• Project #: P173911
emergency COVID-19 response measures include case detection and confirmation, increased testing, as well as health system strengthening for case management. In addition, the project will provide income support to poor and vulnerable households by scaling-up of the Targeted Social Assistance program and providing temporary cash transfers to workers who lost jobs due to the pandemic.
• IBRD Commitment: US$ 80 million
• Total Project Cost: US$ 180 million
• Approval Date: April 30, 2020
• Project Status: Active (closing April 30, 2022)
F EAtu RED P ROJEC t | E MER g E n C y COV i D-19 R E s PO ns E P ROJEC t in gEOR gi A 39
Photo Credit: @Givi Pirtskhalava / World Bank
SUSTAINABLE DEVELOPMENT BONDS | GEORGIA
/Notes: The projects featured here are for illustrative purposes only. No assurance can be provided that disbursements for projects with these or similar characteristics will be made by the World Bank in the future. The net proceeds from the sale of any World Bank bonds are not committed or earmarked for the lending to, or financing of, any particular projects, programs or activities. Returns on World Bank bonds are not linked to the performance of any particular projects, programs or activities.
Green Bonds PROGRAM SUMMARY
 Photo Credit: @Arne Hoel / World Bank
Cumulative & Fiscal Year Results 111
SDG 7
51,462 GWh in annual energy savings
16
CUMULATIVE RESULTS
Total Electricity consumed in Greece in 2018**
Million Cars off the road for one year*
GWh
7,316 in annual energy produced from renewable resources
2,342 in renewable capacity from solar, wind, and hydro technologies
560,000 People provided with access to cleaner energy sources in schools/ educational establishments
MW
equivalent to equivalent to equivalent to
876,000 Homes’ electricity use for one year*
202 Million Smartphones charged*
FY20 RESULTS
206,800 Additional Passenger Trips per day + Travel time on public transport reduced by 23 minutes
52,000 People benefitting from reduced travel time and greater access to the city center + 100 new bus stops constructed
16 The project impact highlights of this report include selected results from projects included in the Green Bond project portfolio that are completed and have a Implementation Completion Report available. The results are aggregated where possible and do not represent all countries or regions where the World Bank supports the financing of projects. Project impact highlights should not be considered a comprehensive accounting of results and may represent results for one or a small number of projects. Additional project results are presented in the Project-by-Project section of the report and the full set of project results can be found at http://projects.worldbank.org
17 The figure reflects the historic number of projects in the World Bank Green Bond project portfolio since 2008 including project P110849 that has been fully repaid. While project P110849 has been removed from the current green bond program and is no longer included in current commitments and allocations, the project remains included in historic commitments and cumulative impact highlights of the Green Bond project portfolio.
GREEN BONDS | PROGRAM SUMMARY
17
7.9 THE WORLD BANK SUSTAINABLE DEVELOPMENT BONDS & GREEN BONDS | IMPACT REPORT 2020 42
World Bank projects eligible for green bond financing
884,932 Hectares of forests restored or reforested
11.5 Million Tons of CO₂ emissions reduced annually due to sustainable forest management practices/activities
RESULTS

1.2 Million Soccer Fields equivalent to
2.3 Million Cars off the road for one year* equivalent to
764,000 Residents benefitting from secured water supply
CUMULATIVE RESULTS
1.2 Million Hectares with new, rehabilitated or restored irrigation services
FY20 RESULTS
8.5 Million People provided with access to improved water sources
58 53
CUMULATIVE
SDG 15 SDG 6
*Source: US Environmental Protection Agency Greenhouse Gas Equivalencies Calculator, CIA World Factbook. ** Source: US Energy Information Administration. g REE n BO n D s | PRO g RAM su MMAR y | Cu M ul Ati VE & Fis CA l yEAR R E sults 43
active projects with projects completed with
Photo Credit: Simone D. McCourtie / World Bank
new projects added in FY20 completed in FY20
Issuance Highlights GREEN BONDS | ISSUANCE HIGHLIGHTS, COMMITMENTS & ALLOCATIONS $14.4 Billion 164 Green Bonds across 22 Currencies $1.0 Billion 7 Currencies in bonds issued18 since 2008 with including eq. in bonds issued in FY20 in 18 Approximately US$6.5 billion in World Bank Green Bonds were outstanding as of June 30, 2020. An amount equal to the net proceeds of the issue of the Notes is credited to a special account that supports IBRD’s lending for Eligible Projects. So long as the Notes remain outstanding and the special account has a positive balance, periodically and at least at the end of every fiscal quarter, funds are deducted from the special account and added to IBRD’s lending pool in an amount equal to all disbursements from that pool made during such quarter in respect of Eligible Projects. THE WORLD BANK SUSTAINABLE DEVELOPMENT BONDS & GREEN BONDS | IMPACT REPORT 2020 44
Historic Commitments & Allocations $17.6 111 Projects $11.7 Billion 32 Countries since 2008, accounting for allocated net of repayments through FY20 across has been committed19 across 19 This figure represents the historic amount committed to projects part of the World Bank Green Bond project portfolio since 2008, including the project P110849, which was fully repaid. ISSUANCE HIGHLIGHTS, COMMITMENTS & ALLOCATIONS g REE n BO n D s | PRO g RAM su MMAR y | issu A n CE H ig H lig H ts , COMM it ME nts & A ll OCAti O ns 45 Billion
GREEN BONDS | ISSUANCE, COMMITMENTS & ALLOCATIONS
Current Commitments & Allocations20
By Sector:
8% Resilient Infrastructure, Built Environment & Other
15% Agriculture, Land Use, Forests & Ecological Resources <1% Solid Waste Management
36% Renewable Energy & Efficiency 11% Water & Wastewater
4% Biodiversity
Notes: Amounts may not add up due to rounding.
/a Aggregate committed amount net of cancellations for eligible projects for which the loans are disbursing.
/b Total green bond proceeds allocated to support financing of disbursements to eligible projects net of loan repayments. Not adjusted for matured bonds that were not replaced with new green bonds.
27% Clean Transportation
THE WORLD BANK SUSTAINABLE DEVELOPMENT BONDS & GREEN BONDS | IMPACT REPORT 2020 46 Committed US$eq. billion/a Allocated & Outstanding US$eq. billion/b Sector Mitigation A daptation Total R enewable Energy & Energy Efficiency 6.1 0.1 6.2 4.6 Clean Transportation 4.4 0.2 4.6 3.5 Water & Wastewater 0.3 1.5 1.8 0.8 Solid Waste Management 0.1 0.0 0.1 0.1 Biodiversity 0.1 0.5 0.6 0.5 Agriculture, Land Use, Forests & Ecological Resources 0.6 1.9 2.5 1.1 Resilient Infrastructure, Built Environment & Other 0.5 0.8 1.3 1.2 Total 12.2 4.9 17.1 11.7 Percentage 71% 29% 100%
By Region:
ISSUANCE HIGHLIGHTS, COMMITMENTS & ALLOCATIONS g REE n BO n D s | PRO g RAM su MMAR y | issu A n CE H ig H lig H ts , COMM it ME nts & A ll OCAti O ns 47 SAR 23% MNA 6% ECA 14% EAP 33% AFR 1% Committed /a Allocated & Outstanding /b Region US$eq. billion Africa (AFR) 0.2 0.0 East Asia & Pacific (EAP) 5.7 4.0 Europe & Central Asia (ECA) 2.4 1.7 Latin America & Caribbean (LAC) 3.8 3.2 Middle East & North & Africa (MNA) 1.1 0.8 South Asia (SAR) 3.9 2.0 Total 17.1 11.7
LAC 22%
20 These figures represent the commitments and allocations of the current Green Bond project portfolio. Project P110849, has been fully repaid and was therefore removed from current commitments and allocations figures and the current Green Bond portfolio.
Featured Project
Million People
15 benefitting from sustainable groundwater resources
Hectares
with reduction in water consumption
States
7 with improved groundwater monitoring and data disclosure THE WORLD BANK SUSTAINABLE DEVELOPMENT BONDS & GREEN BONDS | IMPACT REPORT 2020 48
200,000
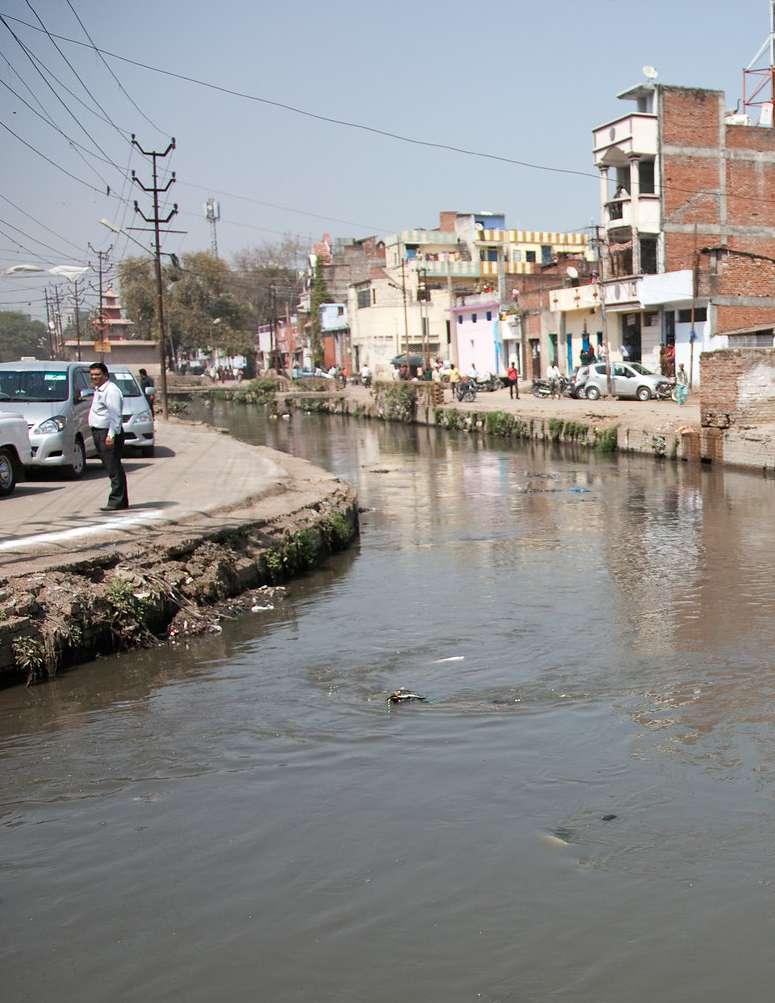
Improving National Groundwater Management in India
Water security is key for India’s economic growth and poverty reduction. India has 18 percent of the world’s population, but only 4 percent of global renewable water resources within its territory and water scarcity in India is already classified as ‘high’. The country has extensive groundwater resources, estimated at 30-40 percent of its annual usable renewable water resources. Yet, they are under threat from overexploitation, pollution and climate change. Intensive and unregulated groundwater pumping in many areas has caused rapid and widespread
groundwater decline; pollution is degrading ground water quality; and climate change will exacerbate current pressures on groundwater resources with users increasingly turning to groundwater as surface water supplies become unreliable.
The National Groundwater Management Improvement Project aims to enhance the Government of India’s
• Project #: P158119
management of groundwater resources by: incentivizing states to apply improved planning and implementation of investments and groundwater management actions to arrest the decline of groundwater levels and strengthen groundwater institutions at all levels; and demand-side measures and improved groundwater data availability, sharing, and use.
• IBRD Commitment: US$ 450 million
• Total Project Cost: US$ 1 billion
• Approval Date: June 5, 2018
• Project Status: Active (closing September 28, 2025)
F EAtu RED P ROJEC t | g REE n BO n D s | in D i A 49
WATER & WASTEWATER MANAGEMENT
GREEN BONDS | INDIA
Photo Credit: Graham Crouch / World Bank
Featured Project
50,764
Hectares with new or improved irrigation or drainage services
17,312
Users provided with improved irrigation services
15% Increase in irrigation efficiency
THE WORLD BANK SUSTAINABLE DEVELOPMENT BONDS & GREEN BONDS | IMPACT REPORT 2020 50
AGRICULTURE, LAND USE, FORESTS AND ECOLOGICAL RESOURCES
Irrigation Modernization in Turkey
Turkey has 28 million hectares of arable land, and while the agricultural sector accounts for about two-thirds of the country’s water use, its overall contribution to GDP has steadily declined from 18 percent in 1990 to 8 percent in 2014. Despite large investments in irrigation expansion, Turkey has yet to reach its full efficiency and agricultural productivity potential.
Most irrigation schemes are based on open channels, where water losses from leakage and evaporation are high. Significant water loss occurs also at the field-level, since almost 90 percent of the irrigation area in Turkey has widespread use of inefficient surface irrigation
methods. Poor on-farm water management practices, land fragmentation, and inefficient crop patterns are some of the constraints in translating irrigation provision into higher agricultural productivity and farmer incomes. Moreover, almost 59 percent of the agriculture land in Turkey is affected by degradation caused by unsuitable agriculture practices and inappropriate irrigation. Since agriculture consumes the most water in Turkey, improving irrigation efficiency and productivity will contribute directly
• Project #: P158418
to enhancing resilience and resource sustainability in this very important sector.
The Turkey Irrigation Modernization Project will focus on rehabilitating and modernizing the older, deteriorated, and underperforming irrigation schemes responsible for reduced the quantity and quality of irrigation delivery. The modernization investments and associated services will not only lift the incomes of the farmers engaged in low-value agriculture, but also contribute to general economic growth in these areas.
• IBRD Commitment: US$ 252 million
• Total Project Cost: US$ 254 million
• Approval Date: January 22, 2019
• Project Status: Active (closing February 27, 2026)
F EAtu RED P ROJEC t | g REE n BO n D s | tu RKE y 51
PROJECT #: XXXXXX
Photo Credit: Arne Hoel / World Bank
GREEN BONDS | TURKEY
Strengthening Disaster Risk Management Policies in the Dominican Republic
Geological and climaterelated disasters pose major challenges for the sustainable growth and resilient development of the Dominican Republic. Unplanned urban growth, land degradation, and weak enforcement of building codes and zoning regulations has exacerbated the country’s vulnerability to hydrometeorological and geophysical hazards. Climate change is likely to increase the frequency and severity of these threats in the country, reinforcing the need to actively strengthen climate and disaster risk
management policies to ensure a sustainable development.
The project supported the Dominican Republic in developing a holistic approach to disaster risk management by strengthening the responsible institutions and the regulatory framework needed for improving climate and disaster
• Project #: P159351
resilience. Reforms have resulted in public investment projects that adhere to resilience-building technical standards; updated technical regulations for new construction works and compulsory building permits; and the inclusion of hazard- and climate-related contingent liabilities in the national medium-term debt strategy.
• IBRD Commitment: US$ 150 million
• Total Project Cost: US$ 150 million
• Approval Date: September 28, 2017
• Project Status: Closed (February 28, 2021)
THE WORLD BANK SUSTAINABLE DEVELOPMENT BONDS & GREEN BONDS | IMPACT REPORT 2020 52
RESILIENT INFRASTRUCTURE
RESILIENT INFRASTRUCTURE
| DOMINICAN REPUBLIC
GREEN BONDS
Photo Credit: Simone D. McCourtie / World Bank
Featured Project
975 assessed for disaster risk assessed for disaster risk and requiring an intervention are rehabilitated and/or retrofitted.
292 Public Schools
Public Schools Identified RiskProne Areas
50 with improvements in water management
/Notes: The projects featured here are for illustrative purposes only. No assurance can be provided that
projects with these or similar characteristics
any
lending to, or financing
any particular
on
to
performance
particular
F EAtu RED P ROJEC t | g REE n BO n D s | DOM ini CA n REP u B li C 53
disbursements for
will be made by the World Bank in the future. The net proceeds from the sale of
World Bank bonds are not committed or earmarked for the
of,
projects, programs or activities. Returns
World Bank bonds are not linked
the
of any
projects, programs or activities.
Projectby-Project Reporting
 Photo Credit: @Neeraz Chaturvedi / Shutterstock
PROJECT-BY-PROJECT REPORTING Sustainable Development Bonds Results + Committed & Allocated Amounts for Projects Approved and Disbursing in FY20 Agriculture, Fishing & Forestry 56 Education 58 Energy & Extractives ������������������������������������������������ 60 Financial Sector �������������������������������������������������������� 62 Health ������������������������������������������������������������������������ 64 Industry, Trade & Services �������������������������������������� 70 Information & Communications Technology 72 Public Administration 74 Social Protection 84 Transportation ��������������������������������������������������������� 88 Water, Sanitation & Waste Management �������������� 90 PROJEC t-B y-PROJEC t REPOR ting | s ustA in AB l E D EVE l OPME nt B O n D s 55 Notes: Results should be read in conjunction with the Resources section, which describes the reporting approach. The net proceeds from the sale of any World Bank bonds are not committed or earmarked for the lending to, or financing of, any particular projects, programs or activities. Returns on World Bank bonds are not linked to the performance of any particular projects, programs or activities.
Agriculture, Fishing & Forestry
# Link to More Information Project Name (Number | Year/s Loans Approved) and Description
1 Agricultural Productivity Program for Southern Africa - Angola & Lesotho (P164486 | FY19): increase the availability of improved agricultural technologies in participating countries in the Southern Africa Development Community (SADC) region.
2 Odisha Integrated Irrigation Project for Climate Resilient Agriculture (P163533 | FY20): intensify and diversify agricultural production, and enhance climate resilience in selected districts of Odisha.
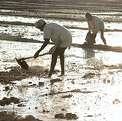
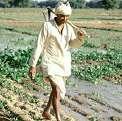
3 Integrated Project for Source Sustainability and Climate Resilient Rain-fed Agriculture in Himachal Pradesh (P165129 | FY20): improve upstream watershed management and increase agricultural water productivity in selected Gram Panchayats in Himachal Pradesh.
4 Second Rural Economic Development Initiative (REDI II) Project (P166279 | FY20): enhance access to markets and to Climate Resilient Approaches for targeted beneficiaries.
5 Saramacca Canal System Rehabilitation Project (P165973 | FY19): reduce flood risk for the people and assets in the greater Paramaribo area and improve the operation of the Saramacca Canal System. The project includes a Contingency Emergency Response Component that was activated to respond to the rapidly evolving COVID-19 emergency and to prepare the national health system to restrain the spread of the virus in the country.
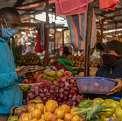
THE WORLD BANK SUSTAINABLE DEVELOPMENT BONDS & GREEN BONDS | IMPACT REPORT 2020 56
Country Project Life /a
Eastern Africa 25
India 20
India 20
Jamaica 30
Suriname 36
Green Bond Impact Report
COVID-19 Project Fragile & Conflict-Affected Situations
• 100 technologies made available to farmers and other end users.
• 30 technologies generated or promoted by the Project in one participating country, that are released in another participating country.
• 50,000 farmers reached with agricultural assets or services.
• 50 technologies generated.
• 3 research centers rehabilitated or equipped.
• 28,800 farmers adopting improved agricultural technology.
• 20% increase in productivity of selected agricultural commodities supported by the project produced by female beneficiaries.
• 72,805 ha provided with new/improved irrigation or drainage services.
• 200 government staff trained through project support.
• 30% increase in farm area using less water demanding crops.
• 12,000 ha under sustainable landscape management practices.
• 200 ha of new farm area brought under higher efficiency irrigation through project support in targeted Gram Panchayats in Himachal Pradesh.
• 50% of participating farmers adopting climate smart agriculture practices.
• 5 reforms recommended by institutional assessments that are implemented.
• 20,000 farmers reached with agricultural assets or services.
• 10,000 farmers adopting improved agricultural technology.
• 1,500 ha provided with new/improved irrigation or drainage services.
• 100% of 200 participating rural enterprises accessed new markets.
• 210 targeted beneficiaries reached with project-supported climate resilient approaches.
• 80% of participating rural enterprises operating on or above their business plan projections.
• 4,300 jobs directly created by the project.
• 9,000 participants from rural enterprises taking part in capacity development activities.
• 40% participants from rural enterprises taking part in Climate Resilient Approches training.
• 30% participants from rural enterprises taking part in market access training.
• Risk-based maintenance system introduced for the drainage of the Saramacca Canal System.
• 57,000 people benefitted from reduced flood risk for a 10-year return period. Engineering design completed to improve the Saramacca Canal ’s capacity to discharge water into the Suriname and Saramacca Rivers.
• Guidelines and operational procedures updated for managing flood control and navigation of the Saramacca Canal drainage system.
• 13 hospitals supplied with protective gear to fight the COVID-19 pandemic.
PROJEC t-B y-PROJEC t REPOR ting | sustA in AB l E DEVE l OPME nt BO n D s | Ag R i C ultu RE , Fis H ing & F ORE st R y 57
Results /b Committed US$ mil /c IBRD share /d Allocated US$ mil /e SDGs /f
Target
25.0 50% 0.1 SDG 9 SDG 2
165.0 70% 0.7 SDG 2 SDG 6 SDG 9
80.0 80% 1.8 SDG 2 SDG 6 SDG 9
40.0 95% 0.1 SDG 17 SDG 2 SDG 9
35.0 100% 1.6 SDG 6 SDG 2 SDG 13
Agriculture, Fishing & Forestry
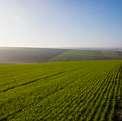
Education
THE WORLD BANK SUSTAINABLE DEVELOPMENT BONDS & GREEN BONDS | IMPACT REPORT 2020 58
# Link to More Information Project Name (Number | Year/s Loans Approved) and Description Country Project Life /a 6 Irrigation Modernization (P158418 | FY19): improve irrigation delivery, through rehabilitation and modernization of distribution infrastructure in selected schemes, and through strengthening of capacity of Water Users Associations. Turkey 30 7 Accelerating Private Investment in Agriculture Program (P166941 | FY19): alleviate select constraints to increased participation of the private sector, in particular SMEs, in agricultural input and output markets of Ukraine. Ukraine 23
# Link to More Information Project Name (Number | Year/s Loans Approved) and Description Country Project Life /a 8 Improving Inclusion in Secondary and Higher Education (P168911 | FY19): reduce dropout rates in basic and higher education among the most vulnerable and strengthen the Borrower’s education evaluation systems. Argentina 39 9 Innovation, Inclusion and Quality (P168481 | FY19): expand access to preschool education and improve the quality of education and learning environments. Georgia 39 10 Realizing Education’s Promise: Support to Indonesia’s Ministry of Religious Affairs for Improved Quality of Education Project (P168076 | FY19): improve the management of primary and secondary education services under the Ministry of Religious Affairs. Indonesia 21 11 Education Support Program (P167619 FY19): establish an enabling environment for quality Early Childhood Education service delivery, support improved teaching practices in primary and secondary education, and strengthen management capacity and accountability along the education service delivery chain in the program areas. Morocco 30
Green Bond Impact Report
COVID-19 Project
Fragile & Conflict-Affected Situations
• 50,764 ha provided with new/improved irrigation or drainage services.
• 17,312 users provided with improved irrigation service.
• 15,911 tCO 2 eq. emissions avoided annually.
• 15% increase in irrigation efficiency.
• 1,521 km of modernized irrigation network.
• 80% of grievances addressed within stipulated timeframe.
• 60% of state support funds allocated to agricultural SMEs.
• 60% of food businesses newly registered as exporters of food from animal origins are SMEs.
• 50% of ultimate Program beneficiaries are women.
• 85% of Program received improved service provisions.
• Dropout rate of ASISTIRE (early dropout prevention program) in schools in selected provinces reduced to 9%.
• Vulnerable youth remaining in higher education for the first two years increased to 17%.
• Academic certification system for basic education students implemented.
• 3 large-scale primary/secondary learning assessments completed.
• 92% of 5 to 6-year old children enrolled in School Readiness Programs.
• 116,000 beneficiary students with access to improved learning environments in project-supported schools.
• 265,647 students benefiting from direct interventions to enhance learning.
• 3 large-scale primary/secondary learning assessments completed.
• 60 rehabilitated general education schools.
• 40% increase in school-based National Education Standards achievement.
• 12,000 peer learning groups with improved access to in-service training materials.
• 150,000 teachers and education personnel trained.
• 4th grade test materials revised and validated.
• 150 classrooms for which data on quality of Early Childhood Education environment is collected and published by Regional Academies for Education and Training.
• Established criteria and approval process for existing preprimary educator ’s professional development programs.
• 20,000 pre-school educators completed an in-service training program approved by the Ministry of Education.
• 30% in-service teachers receive and access personalized professional development opportunities, 30% receive face-to-face teacher training and 30% benefit from distance learning.
• 1,010,742 additional children age 4 and 5 enrolled in pre-primary education.
• 60% parent participation in the development and implementation of school improvement projects.
PROJEC t-B y-PROJEC t REPOR ting | sustA in AB l E DEVE l OPME nt BO n D s | E D u CAti O n 59
Results /b Committed US$ mil /c IBRD share /d Allocated US$ mil /e SDGs /f
Target
252.0 99% 10.9 SDG 9 SDG 6 SDG 2
200.0 15% 0.5 SDG 2 SDG 15 SDG 17
Results /b Committed US$ mil /c IBRD share /d Allocated US$ mil /e SDGs /f
Target
341.0 100% 60.9 SDG 4 SDG 8 SDG 13
102.7 80% 0.6 SDG 4 SDG 9 SDG 17
250.0 99% 4.3 SDG 4 SDG 17
500.0 100% 173.4 SDG 4 SDG 17 SDG 1
Energy & Extractives

THE WORLD BANK SUSTAINABLE DEVELOPMENT BONDS & GREEN BONDS | IMPACT REPORT 2020 60
# Link to More Information Project Name (Number | Year/s Loans Approved) and Description Country Project Life /a 12 Renewable Energy and Battery Storage Promotion Project (P163679 | FY19): promote the integration and use of renewable energy through the deployment of battery storage systems and innovative applications of renewable energy. China 36 13 Network Reinforcement and Access Project (P166170 | FY19): improve the reliability of electricity supply and increase access to electricity services in targeted areas. Eswatini 35 14 Energy Supply Reliability and Financial Recovery (P169117 | FY19): increase electricity supply reliability in the western part of Georgia, achieve the financial viability of Georgian State Electrosystem, and help it access long-term commercial financing. Georgia 39 15 Basra Electricity Dissemination and Development Project (P162454 | FY19): improve the reliability and operational and commercial efficiency of electricity services in the selected project areas. Iraq 19 16 Energy Sector Improvement Project (P168273 | FY19): strengthen Tunisia’s electricity transmission system and improve Tunisian Company of Electricity and Gas commercial performance. Tunisia 40
Green Bond Impact Report
COVID-19 Project
Fragile & Conflict-Affected Situations
• 300 GWh increase in renewable energy absorption by the grids.
• 235 MW of installed capacity of Distributed Renewable Energy.
• 1,100 GWh of renewable energy produced by innovative applications.
• 800,000 tCO₂ eq. reduced annually.
• 116,000 kVA of increased capacity to transfer power to targeted areas.
• 25% increase in households using electricity services in targeted areas.
• Annual power outages in HV/MV network at Hluthi and Nhlangano decreased to 738.
• 87 km of transmission lines constructed.
• 159,892 people provided with new or improved electricity service.
• 4 transmission substations constructed or expanded.
• 20 distribution feeders or lines constructed or rehabilitated.
• Technical loss in targeted areas reduced by 3%.
• Number of end-user outages caused by failures of 500 kV Overhead Lines in the western part of Georgia decreased to zero.
• Average annual duration of end-user outages decreased to 0 minutes in the western part of Georgia.
• Georgian State Electrosystem rehabilitation regime ended.
• US$100,000,000 of long-term commercial financing mobilized.
• Cash deficit of Georgian State Electrosystem reduced to US$0 .
• 50% increase in the efficiency of Transmission and Distribution Network infrastructure.
• 15% reduction in technical losses.
• 1,720,000 kVA of new substations capacity constructed in the South Electricity Transmission Network Reinforcement component and 750,000 kVA in the SED Network Reconstruction and Reinforcement and Electricity Sales Revenue Management Improvement component.
• 2,000,000 people provided with new or improved electricity service.
• 20% increase in women-owned businesses reporting increased income due to improved electricity services.
• 20% increase in jobs.
• Cash recovery index increased to 92%.
• Transmission capacity along the South-North corridor increased to 3,090 MW.
• 100% of high and medium voltage customers provided with a smart meter.
• 284 km of transmission lines constructed.
• 3 substations constructed and/or reinforced.
• Bill collection of private customers increased to 99%.
PROJEC t-B y-PROJEC t REPOR ting | sustA in AB l E DEVE l OPME nt BO n D s | En ER gy & Ext RAC ti VE s 61
Target Results /b Committed US$ mil /c IBRD share /d Allocated US$ mil /e SDGs /f
300.0 40% 12.1 SDG 7 SDG 17
40.0 89% 0.1 SDG 3 SDG 7 SDG 17
70.7 41% 0.2 SDG 9 SDG 17 SDG 1
200.0 100% 0.5 SDG 7 SDG 9 SDG 17
151.0 100% 25.4 SDG 7 SDG 17
Financial Sector

THE WORLD BANK SUSTAINABLE DEVELOPMENT BONDS & GREEN BONDS | IMPACT REPORT 2020 62
# Link to More Information Project Name (Number | Year/s Loans Approved) and Description Country Project Life /a 17 Growth and Inclusion DPF (P166564 | FY20): achieve more sustainable and inclusive growth, through a macro-financial and institutional environment that is conducive to private-sector led growth; and financial and social inclusion. Angola 40 18 Catalyzing Entrepreneurship for Job Creation (P162835 | FY19): foster job creation and improve other economic opportunities for targeted beneficiaries. Egypt, Arab Republic of 40 19 First Financial Sector Reform Development Policy Financing (P170940 | FY20): support financial sector reforms that will assist the Government of Indonesia in achieving a deep, efficient and resilient financial sector. Indonesia 19 20 COVID-19 Financial Access DPF (P172863 | FY20): contribute to the government’s efforts to support liquidity in the financial sector, and establish instruments for improved financial access. Mexico 19 21 OECS MSME Guarantee Facility Project (P157715 | FY18): facilitate additional financial intermediation for MSMEs by supporting the establishment of a regional partial guarantee corporation. OECS Countries 25 22 First Economic Management Development Policy Loan (P169505 | FY20): improve the enabling conditions for more resilient, private sector-led growth; promote economic growth that is more environmentally sustainable and resilient to climate-induced shocks; and increase resilience through more efficient and accountable management of public resources. Paraguay 40 23 Competitiveness and Sector Diversification (P166187 | FY20): support sector governance improvements and increase competitiveness in targeted industries in Suriname. Suriname 36
Green Bond Impact Report
COVID-19 Project
Fragile & Conflict-Affected Situations
• 4 quarterly fiscal accounts published per calendar year, with lags no longer than 45 days for each quarter.
• 90% of total deposit accounts insured by a Deposit Guarantee Fund.
• Government transfers to State-owned Enterprises (operational subsidies, capital transfers) as a share of GDP decreased to 2%.
• Implementation of new fuel pricing: implementation of utility tariff setting mechanism in line with revenue requirement.
• FDI (Foreign Direct Investment) inflows (non-oil sector) as a share of GDP increased to 1%.
• 800,000 poor households registered and receiving cash transfers in the Cadastro Único.
• 85,200 entrepreneurs receiving financing through the project.
• 100,000 jobs created.
• US$89,000,000 of risk capital mobilized by private sector entities for innovative startups and high-growth SMEs.
• Adults stating distance is the foremost barrier to opening a transaction account reduced to 10%.
• Short-term investments (cash, bank deposits) in pension fund portfolios reduced to 16%.
• 400 financial product marketing violations detected annually.
• 40 payment service providers facilitating Quick Response payments.
• 75 commercial banks complying with sustainable finance practices.
• Pooling fund utilized in disaster response.
• 1,200,000 minors ages 15 to 17 that own a bank account.
• 100% of licensed Electronic Payment Funds Institutions in compliance with transparency and disclosure rules on contracts.
• 60% of women benefitting from state development banks’ financial access programs.
• 100% of schools incorporating financial education in their official curriculum.
• 400 guaranteed loans.
• US$10,000,000 of outstanding guaranteed loans.
• 45 loan officers trained in MSME credit assessment.
• 400 MSMEs receiving guaranteed loans.
• 30% of guarantees issued to women owned or managed MSMEs.
• Average number of days to register a business decreased to 18.
• Average time for customs clearance decreased to 132 hours.
• Data on land use change is publicly available in online data portals.
• US$5 million of loans extended for commercial forest plantations.
• Report on risks of money laundering from tax evasion is completed.
• 50% of mining concessions subject to formal inspections following good international practice.
• 15% increase in revenue of SMEs benefitting from project support.
• 14 regulatory or policy reforms adopted to strengthen governance and competitiveness in targeted industries.
• 160 SMEs benefitting from capacity upgrading support.
• A system for transparent assessment and collection of revenues from the mining sector established.
PROJEC t-B y-PROJEC t REPOR ting | sustA in AB l E DEVE l OPME nt BO n D s | Fin A n C i A l sEC t OR 63
Results /b Committed US$ mil /c IBRD share /d Allocated US$ mil /e SDGs /f
Target
500.0 100% 500.0 SDG 10 SDG 1 SDG 2
200.0 100% 32.9 SDG 2 SDG 9 SDG 17
600.0 100% 300.0 SDG 9 SDG 17 SDG 1
1000.0 100% 2.5 SDG 9 SDG 3 SDG 8
2.0 17% 0.8 SDG 3 SDG 9 SDG 17
200.0 100% 200.0 SDG 15 SDG 1 SDG 2
23.0 100% 0.1 SDG 2 SDG 17 SDG 1
Health
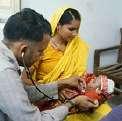
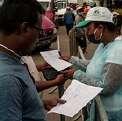
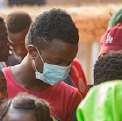


THE WORLD BANK SUSTAINABLE DEVELOPMENT BONDS & GREEN BONDS | IMPACT REPORT 2020 64
# Link to More Information Project Name (Number | Year/s Loans Approved) and Description Country Project Life /a 24 COVID-19 Emergency Response Project (P173767 | FY20): strengthen preparedness and response efforts against the COVID-19 pandemic and national systems for public health preparedness in Argentina. Argentina 39 25 COVID-19 Emergency Response Project (P173773 | FY20): prevent and respond to the threat posed by COVID-19 and strengthen national systems for public health preparedness. Ecuador 39 26 COVID-19 Emergency Response Project (P173883 | FY20): prevent, detect and respond to the threat posed by COVID-19 and strengthen national systems for public health preparedness in Eswatini. Eswatini 35 27 COVID-19 Strategic Preparedness and Response Project (P173927 | FY20): prevent, detect and respond to the threat posed by COVID-19 and strengthen national systems for public health preparedness in Gabon. Gabon 13 28 Tamil Nadu Health System Reform Program (P166373 | FY19): improve quality of care, strengthen management of non-communicable diseases and injuries and reduce inequities in reproductive and child health services in Tamil Nadu. India 40 29 Andhra Pradesh Health Systems Strengthening Project (P167581 | FY19): improve the quality and responsiveness of public health services and increase access to an expanded package of primary health services. India 36
Green Bond Impact Report
COVID-19 Project
Fragile & Conflict-Affected Situations
• 90% of suspected cases of COVID-19 reported and investigated per approved protocols.
• 90% of diagnosed cases treated per approved protocols.
• 80% of acute healthcare facilities with increased isolation capacity.
• 19 laboratories conducting COVID-19 sample testing.
• 90% of public hospitals with Intensive Care Units strengthened.
• 80% of public hospitals with Intensive Care Units received training according to approved protocols.
• 90% of participating hospitals provided with personal protective equipment and infection control products and supplies.
• 80% of prioritized ICU units fully equipped and operational.
• 10 public health campaign audiovisual materials developed and disseminated.
• 80% of ICU beds in prioritized ICU units fully equipped and operational.
• 95% of reported suspected cases that are tested according to national guidelines.
• 14 public hospitals with COVID-19 triage capacity.
• M&E system established to monitor the COVID-19 preparedness and response plan.
• 4,410 additional health staff trained in COVID-19 infection prevention and control per Ministry of Health-approved protocols.
• 3 hospital with fully equipped ICU beds.
• 5 designated laboratories with COVID-19 diagnostic equipment, test kits, and reagents.
• 60% of suspected COVID-19 cases reported and investigated per approved protocol.
• 70% of diagnosed cases treated per approved protocol.
• 80% of health staff equipped with appropriate PPE for infection prevention and control per Ministry of Health-approved protocols.
• 60,000 suspected COVID-19 cases tested per Ministry of Health-approved protocols at the 5 designated laboratories equipped to conduct COVID-19 diagnosis.
• M&E system established to monitor COVID-19 preparedness and response plan.
• 3,600,000 children immunized.
• Antenatal Care increased to 41% and fully immunization increased to 70% to support utilization of reproductive and child health services.
• 5% increase in the average patient reported experience score.
• 2% increase in patients at risk of hypertension and diabetes diagnosed and managed as per protocol at the Subcenter or Primary Health Center.
• 11 districts with at least 90% of pregnant women receiving full ante-natal care.
• 1,400 health facilities with an operational integrated online patient management system.
• 6% increase in the percentage of patients accessing their individual Electronic Medical Records.
• 67% of the adult population screened and stratified by risk as per clinical protocols for hypertension and diabetes.
PROJEC t-B y-PROJEC t REPOR ting | sustA in AB l E DEVE l OPME nt BO n D s | H EA lt H 65
Target Results /b Committed US$ mil /c IBRD share /d Allocated US$ mil /e SDGs /f
35.0 100% 15.8 SDG 3 SDG 17
20.0 100% 10.1 SDG 3 SDG 1 SDG 5
6.0 100% 3.9 SDG 3 SDG 17
9.0 100% 6.2 SDG 3
287.0 5% 52.7 SDG 3 SDG 2 SDG 4
328.0 10% 31.6 SDG 3 SDG 9 SDG 6
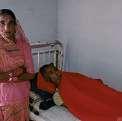
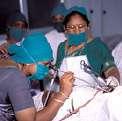
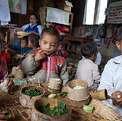
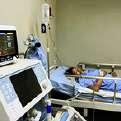


THE WORLD BANK SUSTAINABLE DEVELOPMENT BONDS & GREEN BONDS | IMPACT REPORT 2020 66
# Link to More Information Project Name (Number | Year/s Loans Approved) and Description Country Project Life /a 30 Program Towards Elimination of Tuberculosis (P167523 | FY19): improve the coverage and quality of TB control interventions in the private and public sector in targeted states of India. India 24 31 COVID-19 Emergency Response and Health Systems Preparedness Project (P173836 | FY20): prevent, detect and respond to the threat posed by COVID-19 and strengthen national health systems for preparedness in India. India 24 32 Investing in Nutrition and Early Years (P164686 | FY18): increase simultaneous utilization of nutrition interventions by 1,000-day households in priority districts. Indonesia 20 33 COVID-19 Emergency Response Project (P173994 | FY20): improve the availability of selected essential, life-saving medical equipment for COVID-19 response. Iran, Islamic Republic of 16 34 COVID-19 Emergency Response (P173972 | FY20): prevent, detect and respond to the threat posed by COVID-19 and strengthen the national health system for public health preparedness. Jordan 40 35 COVID-19 Emergency Response and Health System Preparedness Project (P173799 | FY20): strengthen Mongolia’s capacity to prevent and respond to the COVID-19 outbreak and strengthen national systems for public health preparedness. Mongolia 35
Health
Green Bond Impact Report
COVID-19 Project
Fragile & Conflict-Affected Situations
• 800,000 private notifications in targeted states annually.
• 77% and 60% of tuberculosis patients notified by, respectively, public and private providers receiving 1st Nikshay Poshan Yojana payment in targeted states annually.
• 56% increase in beneficiaries receiving financial support through Direct Benefit Transfer in targeted states.
• 70% of district hospitals with isolation capacity.
• Government activated their One Health coordination mechanism for COVID-19.
• 70% of district health centers/district hospitals with personal protective equipment and infection control products and supplies, without stock-outs in preceding two weeks.
• 70% of states with sufficient COVID-19 testing capacity within 4 weeks of project implementation.
• 70% of states issuing school closures with state-level distance learning strategies for primary and secondary school students.
• 80% of district hospital doctors and nurses who are trained on WHO standards of clinical treatment for COVID-19 within 8 weeks of project implementation.
• 70% of states with Emerging Infectious Disease Contingency Plans in place with dedicated budget.
• 308 commitments of Priority District leaders to accelerate stunting prevention.
• The districts' performance in targeting priority nutrition interventions increased to 77%.
• 300 Priority Districts delivery of nutrition-sensitive professional development program for Early Childhood Education and Development Teachers.
• 308 villages empowered to identify 1,000-day households and converge intervention delivery.
• 90% of beneficiaries receiving food assistance program (BNPT) in Priority Districts.
• 100% of selected health facilities provided with essential life-saving medical equipment for COVID-19 response.
• 32 hospitals that comply with COVID-19 case management per WHO protocol.
• 1,500 health and non-health staff trained in infection and prevention control per Ministry of Health-approved protocols.
• 2 newly renovated health facilities fully equipped with medical equipment and commodities for COVID-19.
• M&E system established to monitor COVID-19 preparedness and response plan.
• 5 designated laboratories with COVID-19/SARI (Severe acute respiratory infection) diagnostic capacities established per Ministry of Health guidelines.
• 100% of priority population vaccinated, based on the targets defined in national plan.
• 20 mass media messages disseminated on COVID-19.
• 200 ventilators provided to hospitals.
• 80% of provincial and district general hospitals with personal protective equipment and infection control products and supplies, without stock-outs in preceding two weeks.
• 500 health staff trained in infection prevention and control per Ministry of Healthapproved protocols.
PROJEC t-B y-PROJEC t REPOR ting | sustA in AB l E DEVE l OPME nt BO n D s | H EA lt H 67
Target Results /b Committed US$ mil /c IBRD share /d Allocated US$ mil /e SDGs /f
400.0 30% 41.0 SDG 3 SDG 17 SDG 1
1000.0 100% 502.5 SDG 3 SDG 9 SDG 17
400.0 2% 32.4 SDG 3 SDG 2 SDG 10
50.0* 100% 51.4* SDG 3
20.0 100% 5.9 SDG 3 SDG 17
13.8 51% 0.0 SDG 3 SDG 2 SDG 17
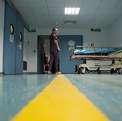
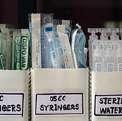
THE WORLD BANK SUSTAINABLE DEVELOPMENT BONDS & GREEN BONDS | IMPACT REPORT 2020 68
# Link to More Information Project Name (Number | Year/s Loans Approved) and Description Country Project Life /a 36 Public Health Sector Strengthening (P167996 | FY19): strengthen the public primary health care micro-networks and expand access to quality primary health care services for the population covered by the Ministry of Public Health and Social Welfare. Paraguay 40 37 COVID-19 Emergency Response Project (P173805 | FY20): strengthen the national health system for emergency preparedness and response to the COVID-19 pandemic in the Republic of Paraguay. Paraguay 40 38 Integrated Health Networks (P163255 | FY19): improve the resolutive capacity and quality of public First-Level Health Services in Lima Metropolitan Area and Prioritized Regions; and increase the capacity of the Single Health Information System and the public sector’s pharmaceutical products and medical supplies provision system. Peru 17 39 COVID-19 Emergency Response and Health Systems Preparedness Project (P173867 | FY20): prevent, detect and respond to the threat posed by COVID-19 and strengthen national systems for public health preparedness in Sri Lanka. Sri Lanka 35 40 COVID-19 Response Project (P173945 | FY20): improve COVID-19 detection and infection control in Tunisia by increasing the availability of COVID-19 equipment and supplies. Tunisia 18
Health
Green Bond Impact Report
COVID-19 Project
Fragile & Conflict-Affected Situations
• 40% of the population covered by the Ministry of Public Health and Social Welfare with access to Primary Health Care through the Family Health Care Center.
• 152 new Family Health Care Centers built.
• 2,500 health staff trained.
• 9 Clinical Practice Guidelines revised.
• 60% of municipalities implementing social accountability actions.
• Health Information System for medicine stock control developed.
• 19,115 people who have received essential health, nutrition, and population services.
• 70% of suspected cases of COVID-19 reported and investigated per approved protocols.
• 70% of public hospitals reequipped to apply response plans per Ministry of Public Health and Social Welfare Guidelines.
• 80% of public hospitals equipped with personal protective equipment and infection control products and supplies.
• 28 ambulances delivered and operative.
• 100% of RIS (Integrated Health Network) that offer an expanded range of health services in Lima Metropolitan Area and prioritized regions.
• MINSA (Ministry of Health) is able to trace pharmaceutical products in real time throughout the reception, storage and distribution processes in Lima Metropolitan Area and prioritized regions.
• 51 modules and components of the Single Health Information System are developed, integrated and operational.
• 8 clinical practice guidelines for the most relevant chronic and non-communicable diseases approved and published through an online or mobile application.
• 3 MINSA data center locations operational.
• 60% of IPRESS (Health Facility) in Lima Metropolitan Area that evidence optimal availability of essential medicines.
• Emergency Operations Centre for COVID-19 and pandemic responses established.
• 17 additional designated laboratories with COVID-19 diagnostic equipment, test kits, and reagents.
• 6 Infectious Disease Hospitals with isolation facilities established.
• 1,000 health staff trained in infection prevention and control per Ministry of Healthapproved protocols.
• Guidelines to engage private health facilities in supporting pandemic response defined.
• 2,000,000 beneficiaries provided with cash and in-kind transfers in response to COVID-19.
• 11,000 women utilizing gender-based violence services through the Mithuru Piyasas.
• 228 health facilities and laboratories provided with personal protective equipment.
• 600,000 tests conducted for COVID-19 using Polymerase Chain Reaction machines.
PROJEC t-B y-PROJEC t REPOR ting | sustA in AB l E DEVE l OPME nt BO n D s | H EA lt H 69
Target Results /b Committed US$ mil /c IBRD share /d Allocated US$ mil /e SDGs /f
115.0 100% 0.3 SDG 3 SDG 2 SDG 10
20.0 100% 0.1 SDG 3 SDG 17
125.0 79% 1.0 SDG 3 SDG 9
35.0 27% 0.1 SDG 3 SDG 1 SDG 9
20.0* 100% 20.5* SDG 3 SDG 17
Industry, Trade & Services
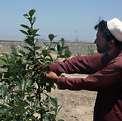
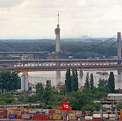
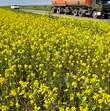
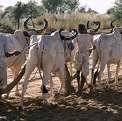

THE WORLD BANK SUSTAINABLE DEVELOPMENT BONDS & GREEN BONDS | IMPACT REPORT 2020 70
# Link to More Information Project Name (Number | Year/s Loans Approved) and Description Country Project Life /a 41 Ceara Rural Sustainable Development and Competitiveness Phase II (P167455 | FY20): enhance access to markets and access to water and sanitation, adopting climate resilient approaches, by targeted beneficiaries in selected areas of the State of Ceará. Brazil 30 42 State of Maharashtra’s Agribusiness and Rural Transformation Project (P168310 | FY20): support the development of inclusive and competitive agriculture value chains, focusing on smallholder farmers and agri-entrepreneurs in Maharashtra. India 20 43 Competitive Agriculture Project (P167634 | FY20): improve agri-food market linkages for targeted beneficiaries. Serbia 15 44 Accelerating Innovation and Growth Entrepreneurship (P170185 | FY20): improve the relevance and excellence of scientific research, innovative entrepreneurship and access to finance for enterprise growth as a way of contributing to Serbia’s growth and competitiveness. Serbia 15 45 Ferghana Valley Rural Enterprise Development Project (P166305 | FY19): support the expansion of rural enterprise activity and job creation in Ferghana Valley. Uzbekistan 30
Green Bond Impact Report
COVID-19 Project Fragile & Conflict-Affected Situations
• 94,500 people provided with access to improved water sources.
• 19,845 people provided with access to improved sanitation services.
• 7,000 farmers adopting improved agricultural technology.
• 13,000 farmers reached with agricultural assets or services.
• 390 subprojects for strengthening organizations for enhanced market access and enabling sustainability.
• 200 households with water reuse systems implemented for agricultural production.
• 40% technologies implemented and/or hydro-environmental activities undertaken to improve the efficiency and/or resilience of the system.
• 165 Water Supply Systems implemented/rehabilitated in operation.
• 5,250 household sanitary kit implemented.
• 60% of beneficiaries' organizations strengthening existing market and/or accessing new marketing channels.
• 9,700 full time equivalent jobs generated in beneficiary firms.
• 1,900,000 farmers reached with agricultural assets or services.
• US$58,500,000 private sector finance mobilized.
• 2,000 project-supported enterprises making incremental investments.
• 1,230 new formal contracts signed between beneficiaries and buyers of their products/services.
• 20% increase in the value of beneficiaries’ production.
• 5,500 farmers reached with agricultural assets or services.
• 1,230 beneficiaries reached with financial services.
• 1,100 scientific publications in top 10% of internationally recognized journals annually.
• US$4,000,000 of external investments generated by participating companies.
• 150 collaborative applied research projects.
• 50 new or improved innovative products or services introduced to the market.
• 100 enterprises completing the acceleration program.
• 20,000 additional jobs generated by enterprises supported by the project.
• 2,000 enterprises supported.
• US$200,000 increase in total revenues of enterprises supported by the project.
• 5,000 beneficiaries trained.
• Rural business development services delivered in 36 districts.
• 100 new business startups.
PROJEC t-B y-PROJEC t REPOR ting | sustA in AB l E DEVE l OPME nt BO n D s | i n D ust R y, tRADE & sERV i CE s 71
Target Results /b Committed US$ mil /c IBRD share /d Allocated US$ mil /e SDGs /f
100.0 65% 5.3 SDG 6 SDG 2 SDG 9
210.0 70% 0.9 SDG 2 SDG 9 SDG 17
50.0 100% 0.1 SDG 2 SDG 17 SDG 9
48.0 100% 0.1 SDG 2 SDG 8 SDG 9
200.0 83% 12.9 SDG 2 SDG 8 SDG 9
Industry, Trade & Services
Information & Communications Technology
THE WORLD BANK SUSTAINABLE DEVELOPMENT BONDS & GREEN BONDS | IMPACT REPORT 2020 72
# Link to More Information Project Name (Number | Year/s Loans Approved) and Description Country Project Life /a 47 Digital Transformation for User-Centric Public Services (P168425 | FY19): improve equitable access to and the quality and accountability of selected Social Protection and Education services through a GovTech approach. Tunisia 41
# Link to More Information Project Name (Number | Year/s Loans Approved) and Description Country Project Life /a 46 Western Balkans Trade and Transport Facilitation (P162043 | FY19): reduce trade costs and increase transport efficiency in Albania, North Macedonia, and Serbia. Western Balkans 30
Green Bond Impact Report
COVID-19 Project Fragile & Conflict-Affected Situations
• Total annual costs to export and import for all shipments of Albania, North Macedonia, and Serbia decreased to US$201,059,449.
• Cost to export and import decreased, respectively, to US$261 and to US$338.
• Average freight transport time on targeted corridors decreased to 11 hours.
• 3 Intelligent Traffic Systems deployed.
• 3 recommended border regulations adopted.
• Average time to import and export decreased, respectively, to 27 hours and to 25 hours.
• 600 firms benefit from reformed custom/border services.
• Increased access to the targeted Social Protection Services (Social Assistance and Social Security), measured as 600,000 households eligible for social assistance and 70,000 new social security affiliations among the target population.
• Increased access of “target vulnerable groups“ to digitized access points measured as an increase by 20,700 in the number of transactions made by vulnerable populations.
• 90% of students with school identifier.
• 4,000,000 people with new social protection/universal health care cards.
• 80% of primary and secondary students enrolled for the school year through the education management platform.
• 3,670 civil servants (in education, social protection, digitized access points) who are trained on new GovTech methods.
• 20,000 parents who have an active account on the education management platform.
• Online learning applications for students developed.
PROJEC t-B y-PROJEC t REPOR ting | sustA in AB l E DEVE l OPME nt BO n D s | i n D ust R y, tRADE & sERV i CE s 73
Target Results /b Committed US$ mil /c IBRD share /d Allocated US$ mil /e SDGs /f
100.0 100% 8.1 SDG 4 SDG 3 SDG 9 Target Results /b Committed US$ mil /c IBRD share /d Allocated US$ mil /e SDGs /f
90.0 100% 2.4 SDG 2 SDG 3 SDG 9
Public Administration
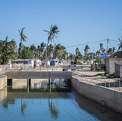
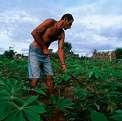
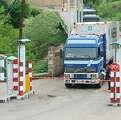
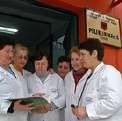
THE WORLD BANK SUSTAINABLE DEVELOPMENT BONDS & GREEN BONDS | IMPACT REPORT 2020 74
# Link to More Information Project Name (Number | Year/s Loans Approved) and Description Country Project Life /a 48 Gender Equality in Access to Economic Opportunities (P160594 | FY20): support the Government of Albania’s efforts to enhance the policy framework for gender equality in access to economic opportunities. Albania 30 49 Development Policy Operation (P169624 | FY20): support the government’s actions to strengthen economic, fiscal, and public sector governance. Armenia 41 50 Mato Grosso Fiscal Adjustment and Environmental Sustainability DPL (P164588 | FY19): support the State of Mato Grosso to regain fiscal sustainability and increase institutional capacity for sustainable agriculture, forest conservation and climate change mitigation. Brazil 20 51 Disaster Risk Management Development Policy Financing with Cat DDO (P160628 | FY19): strengthen the institutional and legal framework to ensure riskinformed sectoral and territorial planning; and increase the financial capacity to manage impacts associated with disaster and climate-related shocks. Cabo Verde 28 52 Multipurpose Cadaster Project (P162594 | FY19): establish the multipurpose cadaster in the selected municipalities to strengthen tenure security, and provide access to cadaster information. Colombia 38
Green Bond Impact Report
COVID-19 Project
Fragile & Conflict-Affected Situations
• Increased access to affordable legal assistance to ensure property titles recognize the rights of vulnerable women.
• Registration process for both new and existing immovable properties with female owners or co-owners accelerated.
• Increased awareness and compliance with legislation on gender equality in employment practices, including the equal work for equal pay provisions of the labor code, and strengthened awareness for gender equality principles in the private sector.
• Constraints on women’s ability to access, and succeed in, the labor market alleviated.
• Monitoring of gender equality policies and programs improved.
• 20 laws and regulations with potential significant economic impact subject to RIA and timely public consultation.
• 100% of action items under the Anti-corruption Strategy and its Action Plan have commenced and 60% are on track.
• 100% of the planned action items under the Judicial Strategy and its accompanying Action Plans have commenced as envisioned and at least 60% are on track.
• 10% increase in eligible civil cases to which the streamlined procedures for small claims are applied.
• 60 institutions included in the civil service performance management.
• Current savings as a percentage of adjusted net current revenue increased to 5%.
• Revenues recovered by the State Fiscal Equilibrium Fund increased to R$400 million.
• Annual revenues raised from State Fund for Transport and Housing ’s commodities increased to R$1,350 million.
• Annual deforestation in Mato Grosso’s portion of the Amazon biome reduced to 1,241 km 2
• 20 million ha of land for which Rural Environmental Registry information has been validated by the State Secretariat of the Environment.
• 50% of Integrated Touristic Areas have Tourist Development Plans that incorporate disaster and climate-related risk management considerations.
• Allocation to the National Emergency Fund included annually in national budget (for 20192022 annual budgets).
• All 22 new municipal plans incorporate climate-related risk management considerations.
• 1,500,000 ha within project municipalities with cadastral and property information updated.
• 37 municipalities with access to, and capacity to use, the cadaster data for planning and other purposes.
• 67,000 people with titles issued.
• 90% of the National Cadaster System redesigned and in operation.
• 13 registry offices with information in digital format.
• 70% of processes and operations supported by the Cadaster-Registry Master Data Repository.
PROJEC t-B y-PROJEC t REPOR ting | sustA in AB l E DEVE l OPME nt BO n D s | Pu B li C A DM inist RAti O n 75
Target Results /b Committed US$ mil /c IBRD share /d Allocated US$ mil /e SDGs /f
10.0* 20% 10.2* SDG 1 SDG 4 SDG 10
50.0* 100% 51.1* SDG 17 SDG 2 SDG 9
248.9 71% 248.9 SDG 2 SDG 13 SDG 15
5.0 63% 5.0 SDG 17 SDG 13
100.0 100% 1.0 SDG 9 SDG 16
Public Administration
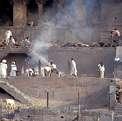
THE WORLD BANK SUSTAINABLE DEVELOPMENT BONDS & GREEN BONDS | IMPACT REPORT 2020 76
# Link to More Information Project Name (Number | Year/s Loans Approved) and Description Country Project Life /a 53 Institutional Strengthening for Territorial Development DPF (P170728 | FY20): strengthen institutions for regional planning, resource allocation, coordination and investment prioritization, and enhance the efficiency of land management in rural and urban areas. Colombia 40 54 DRM Development Policy Loan with a Cat DDO (P159351 | FY18): support the Government of the Dominican Republic in strengthening institutions for improved climate and disaster resilience in priority sectors; and establishing mandatory regulations for climate and disaster risk reduction in public investment and construction works. Dominican Republic 31 55 Economic Management and Competitiveness Development Policy Operation (P169913 | FY20): support the Government’s program of reforms to sustain rapid growth, and ensure greater inclusion, job creation and resilience. Georgia 39 56 DRM Development Policy Loan with CAT DDO II (P159710 | FY19): help strengthen Guatemala’s legal, institutional and financial framework to manage the impact of adverse natural events and climate risk. Guatemala 35 57 Uttarakhand Public Financial Management Strengthening Project (P166923 | FY19): enhance accountability in public finances and increase effectiveness of revenue management systems in Uttarakhand. India 16
Green Bond Impact Report COVID-19 Project
Fragile & Conflict-Affected Situations
• 4 Territorial Pacts subscribed.
• COP43,302 million to fund environmental activities.
• 100% of the budget of the territorial governments (department and municipal governments) formulated and tracked using the new harmonized budget classification system.
• 17 sub-national entities manage their own cadaster.
• 10 territorial entities that use the methodological instruments for the incorporation of disaster risk analysis and adaptation to climate change aspects in public infrastructure projects financed by royalties.
• 15% of public schools assessed for disaster risk (of 6,500 of total schools).
• 30% of public schools assessed for disaster risk and requiring an intervention are rehabilitated and/or retrofitted.
• 50 out of the 140 identified risk-prone areas (35% of total) in main watershed basins have been prioritized, by hydrological and hydrometeorological studies, to undergo improvements in water management.
• 25 out of 164 health facilities have been given an operating permit following the approval of technical regulations assessed using the Hospital Safety Index.
• 80% construction works with a building permit have been supervised and inspected following updated regulations.
• More than 14 municipalities submitting financial statements to State Audit Office for audit within 3 months after end of the financial year.
• 40% of public investment projects are screened, appraised and selected in compliance with the Public Investment Management Guideline requirements.
• 10 RIA completed on laws and regulations.
• 55% of teachers with full work load.
• 2 investment funds established.
• 2 new financial instruments established in line with the Disaster Risk Financing Strategy.
• 29% of municipalities have included disaster risk reduction activities in their local development plans.
• 220 educational facilities constructed in compliance with the technical criteria adopted by the Ministry of Education about safe location and seismic-resistant infrastructure.
• 25 local communities with environmental risk evaluations completed, disseminated and trained to protect strategic ecosystems and the livelihoods provided by them.
• 30% increase in property tax collections of participating ULBs.
• New generation Integrated Financial Management Information System with enhanced controls and processes implemented.
• E-Governance application for excise function implemented.
• Improved cash and debt management practices institutionalized.
• 2 household surveys completed.
PROJEC t-B y-PROJEC t REPOR ting | sustA in AB l E DEVE l OPME nt BO n D s | Pu B li C A DM inist RAti O n 77
Target Results /b Committed US$ mil /c IBRD share /d Allocated US$ mil /e SDGs /f
400.0 100% 400.0 SDG 2 SDG 9 SDG 11
150.0 100% 150.0 SDG 6 SDG 11 SDG 3
98.5 100% 48.7 SDG 2 SDG 8 SDG 9
200.0 100% 200.0 SDG 1 SDG 11 SDG 13
31.6 80% 2.2 SDG 17 SDG 11 SDG 10
Public Administration
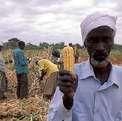
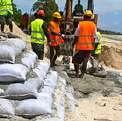
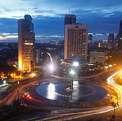
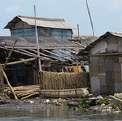
62 Inclusive Growth and Fiscal Management DPO 2 (P172321 | FY20): crowd in private investment and financing for affordable housing; enhance farmer incomes and food security; create fiscal space to support the government’s inclusive growth agenda; and crowd in private investment and leverage digitization to support the government’s inclusive growth agenda.
THE WORLD BANK SUSTAINABLE DEVELOPMENT BONDS & GREEN BONDS | IMPACT REPORT 2020 78
# Link to More Information Project Name (Number | Year/s Loans Approved) and Description Country Project Life /a 58 Jharkhand Municipal Development Project (P158502 | FY19): provide improved access to basic urban services and management capacity in participating Urban Local Bodies in Jharkhand. India 30 59 Institutional Strengthening for Improved Village Service Delivery (P165543 | FY19): strengthen institutional capacity for improved quality of spending in participating villages. Indonesia 20 60 National Urban Development Project (P163896 | FY19): increase the number of participating cities carrying out integrated planning and prioritizing their capital investments. Indonesia 21 61 First Economic Resilience DPL (P170223 | FY20): support fiscal sustainability and inclusion, enhance fiscal and financial resilience against natural disaster risks, and improve the investment climate for sustainable growth. Jamaica 30
Kenya 39
Green Bond Impact Report COVID-19 Project
Fragile & Conflict-Affected Situations
• 350,000 people provided with improved urban living conditions.
• 10 participating ULBs with increased own source revenues.
• 156,600 people provided with access to improved water sources.
• 8 participating ULBs implementing reforms in municipal budgeting and creditworthiness.
• 90,000 people provided with access to all-season roads within a 500m range.
• 2,000 officials and staff receiving training in new skills and knowledge.
• 150 km of new/improved drainage services provided.
• E-learning platform for needs-based capacity building for village apparats and institutions established and fully operational.
• 80% of villages have access to technical service providers.
• 1,300 villages exceeding project performance criteria and receiving supplementary incentive.
• 70% of villages where key village apparat and BPD (Village Council) members completed core training modules.
• Community learning platform established and accessible.
• 300 districts developed capacity building plan to mainstream the program approach.
• 80% of city ’s long-term spatial planning reflects the spatial development framework approach.
• National Urban Infrastructure Strategy Plan completed.
• Inter-ministerial Coordination Team for Urban Development annual work program developed.
• 80% of cities with key planning datasets available.
• 90% of cities with city capacity assessment completed.
• Project management support systems established and operational.
• 60% of cities with integrated data platform established.
• 80% of cities with integrated land use and transport plan developed.
• 80% of cities with spatial development framework developed.
• 60% of cities with priority area development plans developed.
• The Fiscal Council is adequately staffed and issues regular fiscal assessment reports (that include debt sustainability analysis).
• 85% of all new Programme of Advancement Through Health and Education beneficiaries are rural.
• 63% of self-financing public bodies compliant with submitting an Annual Report within four months after the end of the financial year.
• The Annual Fiscal Policy Paper has a section quantifying disaster-related risks.
• National Natural Disaster Reserve Fund capitalized with J$3.1 billion.
• 5 post-natural disaster sources of financing available to ministries, departments and agencies with documented emergency procedures.
• 30% of active fishers are licensed.
• 20,000 Affordable Housing units constructed with private investment under the government supported Affordable Homes Program, 50% of which are owned by women.
• 150,000 farmers benefitting from e-vouchers, 50% of which are female.
• VAT and income tax revenues as a share of GDP increased to 12.1%.
• Average credit growth to the private sector increased to 14%.
• 55 investment projects registered by the Kenya investment Authority.
PROJEC t-B y-PROJEC t REPOR ting | sustA in AB l E DEVE l OPME nt BO n D s | Pu B li C A DM inist RAti O n 79
Target Results /b Committed US$ mil /c IBRD share /d Allocated US$ mil /e SDGs /f
147.0 49% 2.9 SDG 6 SDG 11 SDG 17
300.0 86% 5.2 SDG 17 SDG 1 SDG 5
49.6 100% 2.6 SDG 11 SDG 17 SDG 9
70.0 100% 70.0 SDG 1 SDG 17 SDG 2
250.0 25% 250.0 SDG 2 SDG 11 SDG 17
Public Administration
THE WORLD BANK SUSTAINABLE DEVELOPMENT BONDS & GREEN BONDS | IMPACT REPORT 2020 80
# Link to More Information Project Name (Number | Year/s Loans Approved) and Description Country Project Life /a 63 Disaster Risk Management Development Policy Loan with a Catastrophe Deferred Drawdown Option (P168580 | FY20): strengthen the country’s institutional capacity and institutional framework to deal with the adverse financial impacts and risk management of disasters and climate-related shocks. Morocco 28 64 Municipal Performance Program (P168147 | FY20): improve the institutional and service delivery performance of participating municipalities. Morocco 30 65 Competitive and Livable City of Karachi Project (P161402 | FY19): improve urban management, service delivery and the business environment in Karachi. Pakistan 30 66 Promoting Competitiveness and Enhancing Resilience to Natural Disasters Sub-program 1 DPL (P170052 | FY20): support the Government of the Philippines in promoting competitiveness, enhancing fiscal sustainability and strengthening financial resilience to natural disasters and climate change. Philippines 19 67 Third Disaster Risk Management Development Policy Loan (P171440 | FY20): strengthen the policy and institutional capacity of the Government of the Philippines to reduce disaster risk, respond to and recover from natural disasters. Philippines 40
Green Bond Impact Report COVID-19 Project
Fragile & Conflict-Affected Situations
• 90% of local officials of the Ministry of Interior responsible for the administration of the register, trained on the registration procedures.
• Government deployed an online platform for the registration of people affected by a catastrophic event.
• Government developed a specific outreach and communication mechanism to inform the population of the registration procedures for people affected by a catastrophic event, with a focus on women.
• 4 provinces covered by an integrated flood risk management information system.
• 90% of participating municipalities meet the minimum mandatory conditions.
• 10,000 people from participating municipalities provided with access to improved citizen services through the deployment of the Citizen Services Portal.
• The digital platform for issuing building permits and commercial licenses is operational and publicly accessible in at least 50% of the participating municipalities.
• 80% of participating municipalities included gender oriented objectives and indicators in their planning process.
• Integrated revenue management system implemented in at least 70% of participating municipalities.
• Participating municipalities' revenue increased to 6%.
• 42,000 business registrations and licenses secured annually through the Sindh Business Portal.
• 3,036,000 people provided with improved urban living conditions.
• 200,000 ha with reduced water consumption.
• 6 Karachi Districts where a comprehensive property survey for Property Tax was completed.
• 5 local councils with updated Infrastructure Maps and Asset Inventories.
• 50% of solid waste collection contracts in full compliance with agreed collection targets.
• Property Tax bills being generated online and accessible to taxpayers in Karachi Districts.
• Gap between domestic and international price of rice reduced to less than 50%.
• Number of days to start a business reduced to less than 8 and number of procedures reduced to less than 20.
• Electronic payment transactions among all (retail) payments increased to more than 25%.
• Tax revenue as share of GDP increased to more than 15.2%.
• More than 60% of public assets included in the asset registry for 5 key agencies.
• More than 4 pre-arranged or improved financial mechanisms for disaster response in place.
• Through a Cabinet Directive, the Government has directed all its departments and agencies to use integrated hazard and risk analysis in physical planning and evidencebased policy-making.
• The Government has operationalized an Earthquake Resiliency Program for Greater Metro Manila Area through the issuance of the Department of Public Works and Highways Department Order.
• The Government has adopted a Philippine Disaster Rehabilitation and Recovery. Planning Guide for timely and effective disaster recovery and reconstruction by National Government and Local Government Units.
• The Department of Social Welfare and Development has issued guidelines for implementation of the Emergency Cash Transfer program as part of its social protection reforms for faster and more effective post-disaster recovery.
PROJEC t-B y-PROJEC t REPOR ting | sustA in AB l E DEVE l OPME nt BO n D s | Pu B li C A DM inist RAti O n 81
Target Results /b Committed US$ mil /c IBRD share /d Allocated US$ mil /e SDGs /f
275.0 100% 272.0 SDG 17 SDG 8 SDG 13
300.0 39% 74.4 SDG 17 SDG 1 SDG 5
230.0 96% 4.2 SDG 11 SDG 17 SDG 9
400.0 100% 400.0 SDG 2 SDG 13 SDG 1
500.0 100% 500.0 SDG 1 SDG 10 SDG 11
Public Administration

THE WORLD BANK SUSTAINABLE DEVELOPMENT BONDS & GREEN BONDS | IMPACT REPORT 2020 82
# Link to More Information Project Name (Number | Year/s Loans Approved) and Description Country Project Life /a 68 Strengthening Disaster Risk Management Project (P166302 | FY19): enhance the resilience of critical disaster and emergency response infrastructure and strengthen the Borrower’s institutional capacities in disaster risk reduction and climate change adaptation. Romania 14 69 Disaster Risk Management Development Policy Loan with a Catastrophe Deferred Drawdown Option (P166303 | FY18): strengthen Romania’s institutional and legal framework to effectively manage the physical, social and fiscal impacts of natural disasters and climate change. Romania 40 70 Tax Administration Modernization Project (P163673 | FY19): improve effectiveness of tax collection and lower the compliance burden for taxpayers. Serbia 20 71 Medium-Size Cities Integrated Urban Development Project (P162929 | FY19): improve selected urban infrastructure, public spaces and assets, and access to services in participating cities; and strengthen the institutional capacity of the Borrower’s relevant agencies to deliver and manage local infrastructure. Uzbekistan 35
Green Bond Impact Report COVID-19 Project
Fragile & Conflict-Affected Situations
• 25 disaster and emergency response facilities upgraded to be resilient.
• 1,000 rescue personnel, emergency and disaster management staff, volunteers and administrative staff with access to disaster resilient buildings.
• 3,000 project beneficiaries in areas covered by resilient emergency and disaster response facilities.
• 10 newly constructed emergency and response buildings with resilient structures and systems.
• 10 public awareness campaigns.
• 15 emergency and response buildings retrofitted to improve structural resilience.
• 1,000 direct project beneficiaries.
• The Government of Romania has reported on progress achieved under the international Sendai Framework for Disaster Risk Reduction (1 Report).
• 3 reports are available annually on the impact of disasters in Romania (for 2018, 2019 and 2020).
• Strengthen the national building code for seismic risk in existing buildings.
• 3 disaster risk reduction action plans are prepared and approved by the relevant responsible authorities.
• VAT gap reduced to 8%.
• Time required to comply with taxes (World Bank Doing Business Paying Taxes subindicator) reduced to 202.9 hours.
• Increase by 10% in additional net taxes assessed per audit.
• Tax arrears decreased to 40%.
• 100,000 people provided with access to improved urban services.
• 3 municipalities with asset management system in place and with trained municipal officials to use them.
• 4 public buildings rehabilitated and/or adaptively used (including Cultural Heritage buildings).
• 140 km of water transmission and distribution pipes replaced or laid.
• 10 km of urban roads rehabilitated.
• 26 km of streets with improved street lighting in selected municipalities.
• 10 km of new or rehabilitated pedestrian walkways in selected municipalities.
• 100 people provided with trainings in selected municipalities.
PROJEC t-B y-PROJEC t REPOR ting | sustA in AB l E DEVE l OPME nt BO n D s | Pu B li C A DM inist RAti O n 83
Target Results /b Committed US$ mil /c IBRD share /d Allocated US$ mil /e SDGs /f
60.5 100% 0.2 SDG 13 SDG 9 SDG 17
493.1 100% 437.1 SDG 13 SDG 2
52.0 100% 1.6 SDG 9 SDG 17
100.0 83% 0.9 SDG 11 SDG 6 SDG 9
Social Protection
THE WORLD BANK SUSTAINABLE DEVELOPMENT BONDS & GREEN BONDS | IMPACT REPORT 2020 84
# Link to More Information Project Name (Number | Year/s Loans Approved) and Description Country Project Life /a 72 Strengthening the National Social Protection System Project (Cash Transfer) (P169779 | FY20): provide temporary income support to poor households in selected areas of Angola, and strengthen the delivery mechanisms for a permanent social safety net system. Angola 38 73 Supporting the Electricity Social Tariff Transition in the Province of Buenos Aires (P170329 | FY20): support the transition of the electricity social tariff scheme from the federal to the Buenos Aires provincial level, while strengthening the institutional capacity of the province of Buenos Aires to implement Social Tariff delivery. Argentina 37 74 Guizhou Aged Care System Development Program (P162349 | FY19): increase equitable access to a basic package of aged care services and strengthen the quality of services and the efficiency of the aged care system. China 40 75 Social Safety Net Project (P167416 | FY19): improve the equity, integration and sustainability of selected social safety net programs. Ecuador 40 76 Second Inclusive and Sustainable Growth (P171190 | FY20): protect the vulnerable, remove barriers to private sector development, support economic recovery and promote public sector efficiency and fiscal sustainability post-crisis. Ecuador 39 77 Emergency COVID-19 Response Project (P173911 | FY20): prevent, detect, and respond to the threat posed by the COVID-19 pandemic and strengthen national systems for public health preparedness in Georgia. Georgia 39
Green Bond Impact Report
COVID-19 Project
Fragile & Conflict-Affected Situations
• 70% of cash transfer beneficiary households are among the poorest 40%.
• 5,000,000 beneficiaries of social safety net programs.
• 2,000 households registered in the social registry.
• Communication strategy developed and implemented.
• 100% of Social Tariff users with information on electricity consumption in the integrated database.
• Reduce the number of users with missing identification data to 550,000.
• Reduce the number of users with missing socio-economic data to 560,000.
• Increase the number of Social Tariff users included via social programs to 50%.
• 50 distribution companies updating information on electricity users.
• 402,000 eligible elderly receiving the basic package of aged care services.
• 1,500 aged care facilities complying with the aged care quality standards.
• 37,000 people receiving training and certification in the aged care sector.
• 7,200 communities that use health records for screening the elderly’s needs assessment.
• 1,089,305 beneficiaries of social safety net programs.
• 90% of extreme poor infants receiving cash transfer Bono de Desarrollo Humano Variable.
• 80% of extreme poor infants attending early childhood development services.
• 75% increase in children age 0 to 24 months with complete vaccination schedule.
• 43% of extreme poor elderly receiving caring services.
• 1,000,000 beneficiaries receive emergency transfers by 2021.
• Average time to access unemployment benefits decreased to 7 days.
• US$700 million mobilized by the solidarity fund by 2021.
• 230,000 migrants covered by the migration registry.
• 10,800 new commercial companies registered.
• 100,000 people tested for COVID-19 identification per MoILHSA (Ministry of Internally Displaced Persons from the Occupied Territories, Labor, Health and Social Affairs) protocol..
• 2,000 COVID-19 patients treated per Social Services Agency reimbursement guidelines.
• 45% of the population in the poorest quintile receiving the COVID-19 pandemic related social assistance programs.
• 70,000 vulnerable households receiving temporary cash benefit.
• 4 designated laboratories with COVID-19 diagnostic equipment, test kits, and reagents per MoILHSA guidelines.
• 800,000 PPE purchased.
• 114,000 Targeted Social Assistance beneficiary households.
• 4 designated public hospitals with fully equipped and functional ICUs for COVID-19 patients.
• 4 designated public hospitals with isolation capacity.
PROJEC t-B y-PROJEC t REPOR ting | sustA in AB l E DEVE l OPME nt BO n D s | sOC i A l P RO t EC ti O n 85
Results /b Committed US$ mil /c IBRD share /d Allocated US$ mil /e SDGs /f
Target
320.0 100% 0.8 SDG 10 SDG 1 SDG 17
150.0 100% 46.6 SDG 17 SDG 1 SDG 7
350.0 24% 1.9 SDG 3 SDG 1 SDG 5
350.0 90% 63.3 SDG 1 SDG 17 SDG 3
500.0 99% 500.0 SDG 17 SDG 1 SDG 8
80.0 44% 0.2 SDG 3 SDG 1 SDG 5
Social Protection
THE WORLD BANK SUSTAINABLE DEVELOPMENT BONDS & GREEN BONDS | IMPACT REPORT 2020 86
# Link to More Information Project Name (Number | Year/s Loans Approved) and Description Country Project Life /a 78 Accelerating India’s COVID-19 Social Protection Response Program (P173943 | FY20): strengthen the capability of state and national governments in India to provide coordinated and adequate social protection to the poor and vulnerable from the impacts of the COVID-19 pandemic. India 24 79 Youth, Technology, and Jobs Project (P170669 | FY20): improve digitallyenabled income opportunities and expand digitized government services in Jordan. Jordan 40 80 Social Insurance Administration Project (P170343 | FY20): improve the quality of services in administering social insurance and strengthen the regulatory framework for people with disabilities and hazardous occupations. North Macedonia 15 81 Emergency COVID-19 Response Development Policy Loan (P174120 | FY20): mitigate the impact of COVID-19 on poor and vulnerable households and provide financial relief to affected small and medium enterprises. Philippines 40 82 Sustaining Market Reforms in Uzbekistan Development Policy Operation (P168280 | FY19): sustain Uzbekistan’s economic reforms and transition to a market economy by increasing the role of markets and the private sector in the economy and enhancing social inclusion. Uzbekistan 35
Green Bond Impact Report
COVID-19 Project
Fragile & Conflict-Affected Situations
• Adequacy of benefits provided through the COVID-19 Social Protection Support Program measured as 40% of total household consumption expenditures for the poorest quintile in India.
• 60% of poor households receiving the additional food ratio entitlement for a three month period.
• 25% of low-wage workers withdrawing funds from Employee Provident Fund Accounts citing the COVID-19 pandemic as a reason for withdrawal.
• 60% of low-wage workers in SMEs receiving additional contribution.
• 50% of construction workers registered with Building and Other Construction Workers Fund receiving cash transfers.
• 60% of poor households who have received at least one PMGKY (Pradhan Mantri Garib Kalyan Yojana) benefit.
• 10,000 beneficiaries trained on employable digital skills and reporting new income opportunities.
• 80% of government payment services enabled for digital payments.
• US$20,000,000 new private sector investment mobilized in digital services.
• 15,000 individuals trained by training service providers supported by digital skills development activities.
• 300,000 students (grade 7-12) receiving digital skills curriculum in schools.
• 250 start-ups supported with business matchmaking.
• 6,000 individuals trained on accessing and offering their services on digital platforms.
• 100 new government services digitized.
• Single unified registry of socially insured individuals developed and functional.
• New law on Employment of Persons with Disabilities enacted.
• 3 communication campaigns developed and implemented.
• List of jobs declared as hazardous and arduous revised and enacted.
• Enacted unified methodology for disability assessment and determination.
• Central Coordination Unit for Unified Disability functional.
• Single registry of persons with disabilities developed and functional.
• More than 90% of Pantawid Pamilyang Pilipino Program (4Ps) beneficiaries received top-up cash transfer benefits from the Government’s Emergency Subsidy Program.
• At least 10,000 targeted vulnerable non-4Ps beneficiaries received social assistance through electronic cash transfer system.
• More than 10,000 vulnerable repatriated Overseas Filipino Workers received financial assistance.
• Value of horticultural exports increased to US$960,000,000.
• 13,000 legal entities registered as wholesale trading businesses.
• Increase compliance of banking sector legislation with Basel Core Principles for Effective Banking Supervision.
• At least 1 electricity and 1 cold-water end-user tariff amendments are made in accordance with new methodology.
• An increase in formal employment as evidenced by the number private sector employees registered for payroll tax withholding: 1,952,698 male employees and 1,207,315 female employees.
• A new standardized and systematic national assessment is piloted in at least 2 regions.
PROJEC t-B y-PROJEC t REPOR ting | sustA in AB l E DEVE l OPME nt BO n D s | sOC i A l P RO t EC ti O n 87
Target Results /b Committed US$ mil /c IBRD share /d Allocated US$ mil /e SDGs /f
200.0 27% 200.0 SDG 1 SDG 3 SDG 10
163.1 82% 6.1 SDG 17 SDG 1 SDG 4
15.2 100% 1.1 SDG 1 SDG 8 SDG 10
500.0 100% 500.0 SDG 1 SDG 3 SDG 9
700.0 100% 700.0 SDG 2 SDG 10 SDG 1
THE WORLD BANK SUSTAINABLE DEVELOPMENT BONDS & GREEN BONDS | IMPACT REPORT 2020 88 Transportation # Link to More Information Project Name (Number | Year/s Loans Approved) and Description Country Project Life /a 83 Anhui Rural Road Resilience Program for Results (P158733 | FY19): improve the rural road network connectivity, safety and quality in selected counties in Anhui Province. China 25 84 Enhancing Waterway Connectivity and Water Service Provision in Pazcifico Project (P156880 | FY18): improve waterway transport and coverage and quality of water supply and sanitation services in the participating municipalities. Colombia 15 85 Assam Inland Water Transport Project (P157929 | FY20): improve passenger ferry infrastructure and service in Assam, and improve the institutional capacity and framework for inland water transport in Assam. India 20 86 Rajasthan State Highways Development Program II (P157141 | FY19): build capacity for better management of state highways and improve traffic flows on selected state highways in the state of Rajasthan. India 30 87 Uttar Pradesh Core Road Network Development Project (P147864 | FY19): build capacity for results-focused road safety management in Uttar Pradesh and improve traffic flows and safety for all road users on selected corridors of the state core road network. India 36 88 Greater Beirut Public Transport Project (P160224 | FY18): improve the speed, quality and accessibility of public transport for passengers in Greater Beirut and at the city of Beirut’s northern entrance. Lebanon 40
Green Bond Impact Report
COVID-19 Project
Fragile & Conflict-Affected Situations
• 75% of county and township roads in excellent and good condition.
• 98% of rural roads maintenance coverage rate.
• 5,014 km of rural roads improved with resilience and safety features.
• 8,899 bridges reinforced, demolished and/or reconstructed with resilience and safety features.
• 15 minutes of time saving per 2.5-hour trip using navigation aids and rehabilitated/upgrade docks.
• 9,550 people in urban areas provided with access to improved water sources.
• 7,350 people in urban areas provided with access to improved sanitation facilities.
• Water quality poses no risk for human consumption in selected municipalities.
• 1,910 new piped household water connections.
• 1,080 piped household water connections that are benefiting from rehabilitation works.
• 740 new household sewer connections constructed.
• Ferry service availability increased to 16 hours per day.
• Improved access to climate/weather information and night navigation support available on project supported routes.
• Transport Department has approved/adopted an Intra-State Water Transport Strategy.
• More than 200 private sector country boats made safer and efficient.
• 7 modern, floating and engineered ferry terminals with improved access and socially inclusive design.
• 10,000 km of State Highways actively managed by the Rajasthan State Highway Authority.
• 50% increase in State Road Fund resources earmarked for State Highways.
• 766 km of roads rehabilitated.
• 4 e-PMS (Electronic project management system)developed and operational.
• Speed Management Program implemented for 100 km.
• Road safety strategy developed and adopted.
• Travel time for cars on civil works corridors reduced.
• 20% decrease in fatalities on Highway Police pilot corridors (NH25 and NH2).
• 500 km of roads rehabilitated.
• Uttar Pradesh Highway Police established, equipped and trained.
• Satisfactory post-construction road safety audit.
• 30% of women employed for routine maintenance under Engineering Procurement Construction contracts.
• 300 passengers per weekday using the formal public bus.
• 61% of population residing in Greater Beirut Area with access to Beirut city center within 60 minutes using public transport.
• Average travel time by public transport from Tabarja station to Charles Helou terminal at morning peak hours reduced to 45 minutes.
• 120 operational BRT buses.
• 42 km of the BRT infrastructure constructed.
• 250 operational regular buses.
• 60,000 tCO₂ eq. reduced annually.
PROJEC t-B y-PROJEC t REPOR ting | sustA in AB l E DEVE l OPME nt BO n D s | tRA ns POR tAti O n 89
Results /b Committed US$ mil /c IBRD share /d Allocated US$ mil /e SDGs /f
Target
200.0 72% 50.0 SDG 1 SDG 3 SDG 11
41.9 100% 0.3 SDG 6 SDG 11 SDG 3
88.0 80% 2.3 SDG 3 SDG 6 SDG 5
250.0 59% 0.6 SDG 11 SDG 17 SDG 3
400.0 70% 39.1 SDG 3 SDG 1 SDG 5
225.2 65% 8.2 SDG 11 SDG 3 SDG 9
Water, Sanitation & Waste Management

THE WORLD BANK SUSTAINABLE DEVELOPMENT BONDS & GREEN BONDS | IMPACT REPORT 2020 90
# Link to More Information Project Name (Number | Year/s Loans Approved) and Description Country Project Life /a 89 Local Roads Connectivity Project (P170267 | FY20): improve government capacity to manage local roads and improve access to markets and services. North Macedonia 20 90 Karachi Mobility Project (P166732 | FY19): improve mobility, accessibility and safety along selected corridors in Karachi. Pakistan 33
Transportation
# Link to More Information Project Name (Number | Year/s Loans Approved) and Description Country Project Life /a 91 Utility Efficiency and Quality Improvement Project (P164260 | FY19): improve the quality and efficiency of water and wastewater services, and support the introduction of regional solid waste management. Belarus 21 92 Improving Water Service Access and Security in the Metropolitan Region of São Paulo Project (P165695 | FY19): increase access of vulnerable people to water services and contribute to the reduction of water losses and pollution loads in the Metropolitan Region of São Paulo. Brazil 40 93 Ceara Water Security and Governance (P165055 | FY20): strengthen capacity for water resources management in the Borrower ’s territory, improve reliability of water services in selected municipalities, and improve operational efficiency of water services in the city of Fortaleza. Brazil 30
Green Bond Impact Report COVID-19 Project Fragile & Conflict-Affected Situations
• 65% of municipalities utilizing simple asset management methods developed under the project.
• National policy adopted for local roads.
• 200 markets and services connected by improved, safe and resilient local roads.
• 450 km of roads rehabilitated.
• 100 women trained by municipalities in transport sector roles.
• 100 Roma employed in project works, of which 40% are Roma women.
• Climate resilient design guidelines for local and low volume roads developed.
• 300,000 daily public transport trips on the BRT System.
• Annual number of traffic fatalities along the Yellow Corridor decreased to 50.
• Car travel time during peak hour along the Yellow Corridor decreased to 54 minutes.
• 21 km of roads rehabilitated.
• 150,000 people provided with enhanced water supply services.
• 237,000 people provided with environmentally-sound solid waste disposal services.
• 400,000 people provided with the required level of wastewater treatment.
• 12 utilities that have prepared and implemented Utility Performance Improvement Plans.
• 27 km of water supply pipes constructed/rehabilitated.
• 2 regional waste disposal sites developed and operational.
• 40 km of wastewater collectors laid/replaced.
• 2 landfill gas collection systems developed and operational.
• 800 utility staff benefitting from training to support Performance Improvement Plans.
• 532,000 people provided with access to improved water sources.
• 33 millions m³ of volume of non-revenue water reduced annually.
• 2 million m³ of wastewater removed from the Guarapiranga basin sent to treatment annually.
• 157,150 people provided with access to improved sanitation services.
• 850 km of water distribution mains rehabilitated.
• 80% of strategic water users regularized.
• 90% continuity of water systems supplied with water from Banabuiu - Sertao Central pipeline system.
• 118,490 people benefiting from more reliable water services.
• Non Revenue Water in the city of Fortaleza reduced to 317 liters per connection per day.
PROJEC t-B y-PROJEC t REPOR ting | sustA in AB l E DEVE l OPME nt BO n D s | WAt ER , sA nitAti O n & WA st E M A n A g EME nt 91
Target Results /b Committed US$ mil /c IBRD share /d Allocated US$ mil /e SDGs /f
78.0 100% 17.5 SDG 3 SDG 9 SDG 1
382.0 87% 4.0 SDG 11 SDG 17 SDG 3 Target Results /b Committed US$ mil /c IBRD share /d Allocated US$ mil /e SDGs /f
101.0 100% 0.5 SDG 6 SDG 7 SDG 9
250.0 71% 0.6 SDG 6 SDG 1 SDG 3
139.9 80% 0.7 SDG 6 SDG 9 SDG 3
Water, Sanitation & Waste Management
THE WORLD BANK SUSTAINABLE DEVELOPMENT BONDS & GREEN BONDS | IMPACT REPORT 2020 92
# Link to More Information Project Name (Number | Year/s Loans Approved) and Description Country Project Life /a 94 Green Urban Financing and Innovation Project (P158124 | FY19): increase access to sustainable, long-term financing for selected green urban investments benefitting local governments in the Yangtze River Delta Region. China 36 95 Water Supply and Sanitation Access Project (P166697 | FY20): increase access to improved water supply and sanitation services in targeted areas of Eswatini. Eswatini 35 96 Atal Bhujal Yojana -National Groundwater Management Improvement (P158119 | FY18): improve the management of groundwater resources in selected states. India 10 97 Improvement of Solid Waste Management to Support Regional and Metropolitan Cities (P157245 | FY20): improve solid waste management services for urban populations in selected cities across Indonesia. Indonesia 20 98 Karachi Water and Sewerage Services Improvement Project (P164704 | FY19): improve access to safe water services in Karachi and increase Karachi Water & Sewerage Board ’s financial and operational performance. Pakistan 31
Green Bond Impact Report COVID-19 Project Fragile & Conflict-Affected Situations
• US$800,000,000 of total private direct mobilization of World Bank loan.
• FSC ’s (Shanghai Green Urban Financing and Services Co., Ltd) Green Bond principles certification obtained.
• Credit rating of FSC obtained.
• 20,000,000 beneficiaries of urban environmental investments.
• 90% of total loan portfolio concentrated in three key environmental sectors (water supply, wastewater and waste).
• 18,478 people provided with access to improved water sources.
• 8,000 people provided with access to improved sanitation services.
• 38,233 people reached through hygiene behavior awareness campaigns.
• 32 schools provided with improved water access.
• 32 sanitation facilities constructed in schools.
• 4 health centers provided with improved water access and sanitation services.
• 305 km of water pipeline constructed.
• 7 states with improved groundwater monitoring and disclosure of groundwater data.
• 80 blocks with arrest in the rate of decline of groundwater levels.
• 15,000,000 program beneficiaries relying on sustainable groundwater resources for prosperity and health.
• 200,000 ha with reduction in water consumption.
• 160,000 ha provided with new/improved irrigation and drainage services.
• 5.6 million tCO₂ eq. emissions avoided annually due to reduced groundwater pumping.
• 85% of population in selected urban areas provided with regular household waste collection.
• 16% of solid waste is recycled, composted and/or treated with other techniques to reduce waste disposal volumes.
• 12 cities with high-quality solid waste management implementation plans.
• 50% reduction in marine plastic waste from land-based sources from selected urban populations.
• 2,000,000 people provided with access to drinking water uncontaminated by fecal coliforms.
• 100% coverage of Operation & Maintenance Costs.
• 400,000 piped household water connections affected by rehabilitation works undertaken.
• Wastewater Tariff re-established.
• 160 km of sewerage network rehabilitated.
• 32,000,000 m³ of non-revenue water reduced annually.
PROJEC t-B y-PROJEC t REPOR ting | sustA in AB l E DEVE l OPME nt BO n D s | WAt ER , sA nitAti O n & WA st E M A n A g EME nt 93
Results /b Committed US$ mil /c IBRD share /d Allocated US$ mil /e SDGs /f
Target
200.0 38% 0.5 SDG 6 SDG 11 SDG 9
45.0 100% 0.1 SDG 6 SDG 3 SDG 11
450.0 45% 1.1 SDG 6 SDG 11 SDG 12
100.0 31% 0.8 SDG 6 SDG 11 SDG 17
40.0 40% 1.1 SDG 6 SDG 9 SDG 17
Water, Sanitation & Waste Management
99 Support for the National Indigenous Peoples Development Plan (P157575 | FY18): strengthen the capacity of Indigenous Authorities and the Borrower to jointly plan and implement development investments for Indigenous Territories; and the delivery of selected public services in those Indigenous Territories, as identified in the National Indigenous Peoples Development Plan.
100 Modernization of Water Supply and Sanitation Services (P157043 | FY19): increase access to, and quality of, water and sanitation services in selected areas, and develop the Borrower’s sectoral institutions and participating Public Utility management capacity to provide efficient water and sanitation services.
Notes:
Amounts may not add up due to rounding.
/a Project Life generally indicates the financial life of the project, intended as the sum of the project’s loan term and its grace period.
/b Target results are expected results based on estimates developed at the time of project approval and expected to materialize at the end of the project implementation period (5 years in most cases). The indicators shown are normally a subset of the development impacts contained in project documentation available in the World Bank project website (http:// www.worldbank.org/projects). Results reported are based on the entire project, with the percent shown next to the loan amount corresponding to the proportion of the total financing that is financed by World Bank loans. Actual impacts may be different from these estimates and do not represent the actual results in a specific year. Quantitative estimates are intended to be indicative of the scale of impacts and qualitative results aim to inform about the nature of changes that will be achieved as a result of projects once they are completed and at full capacity.
/c The committed amount is the World Bank loan net of cancellations reported in equivalent US$ millions. Loans denominated in other currencies are converted to US$ equivalents using the exchange rate as of the month end prior to the negotiation date. Similarly, cancellations of loans denominated in other currencies are converted to US$ equivalents using the exchange rate on the value date of the cancellation.
/d The percentage shows the share of the total financing that is provided by World Bank loans. When a project is co-financed, this share could be used to apportion total results to the World Bank.
/e The allocated amount is the amount of World Bank bond proceeds allocated to support the financing of disbursements to eligible projects reported in equivalent US$ millions. Disbursements of loans denominated in other currencies are converted to US$ equivalents using the exchange rate on the value date of the transactions under the loan.
f/ The SDGs noted in the table represent the first three SDGs according to highest frequency of mapping the SDGs to the projects. A more detailed mapping is available in the “Project-Level Mapping of the FY20 World Bank Portfolio to the SDGs” also in the Project-by-Project Reporting section of this document, developed in collaboration with SEI. The selected SDGs are only indicative of how the project contributes to the SDGs and are not meant to provide an exhaustive explanation of the broader impact that a project may have on other SDGs.
* Discrepancies between committed and allocated amounts may be due to the different exchange rates used to convert loans denominated in other currencies to US$ equivalents.
THE WORLD BANK SUSTAINABLE DEVELOPMENT BONDS & GREEN BONDS | IMPACT REPORT 2020 94
# Link to More Information Project Name (Number | Year/s Loans Approved) and Description Country Project Life /a
Panama 31
Peru 24
Green Bond Impact Report COVID-19 Project Fragile & Conflict-Affected Situations
• 85% of water and sanitation systems within beneficiary Indigenous communities reported in the Information System on Rural Water and Sanitation as operational and sustainable.
• 60% of patients provided treatment in accordance with intercultural care protocols for 4 risk areas within beneficiary areas.
• 176 schools in Indigenous Territories implementing the new or expanded Intercultural Bilingual Education.
• Presidential Decree drafted that establishes the National Indigenous People Roundtable as a permanent structure for dialogue and development planning.
• 7 indigenous ethnicities that have intercultural health protocols established.
• 3 regulations drafted and consulted for key Indigenous laws.
• 150 trainings delivered to communities, service providers, and local authorities in water, sanitation, and hygiene.
• 50,000 beneficiaries from infrastructure investments supported by the Project.
• 161,000 people provided with access to improved water sources.
• 93,000 people provided with access to improved sanitation services.
• Working ratio reduced by 6% in selected utilities.
• 6% of non-revenue water reduction achieved in selected utilities.
• 23,239 new piped household water connections.
• 19,418 new household sewerage connections.
PROJEC t-B y-PROJEC t REPOR ting | sustA in AB l E DEVE l OPME nt BO n D s | WAt ER , sA nitAti O n & WA st E M A n A g EME nt 95
Target Results /b Committed US$ mil /c IBRD share /d Allocated US$ mil /e SDGs /f
80.0 94% 2.0 SDG 6 SDG 3 SDG 4
70.0 35% 0.1 SDG 6 SDG 1 SDG 5
Project-by-Project Reporting
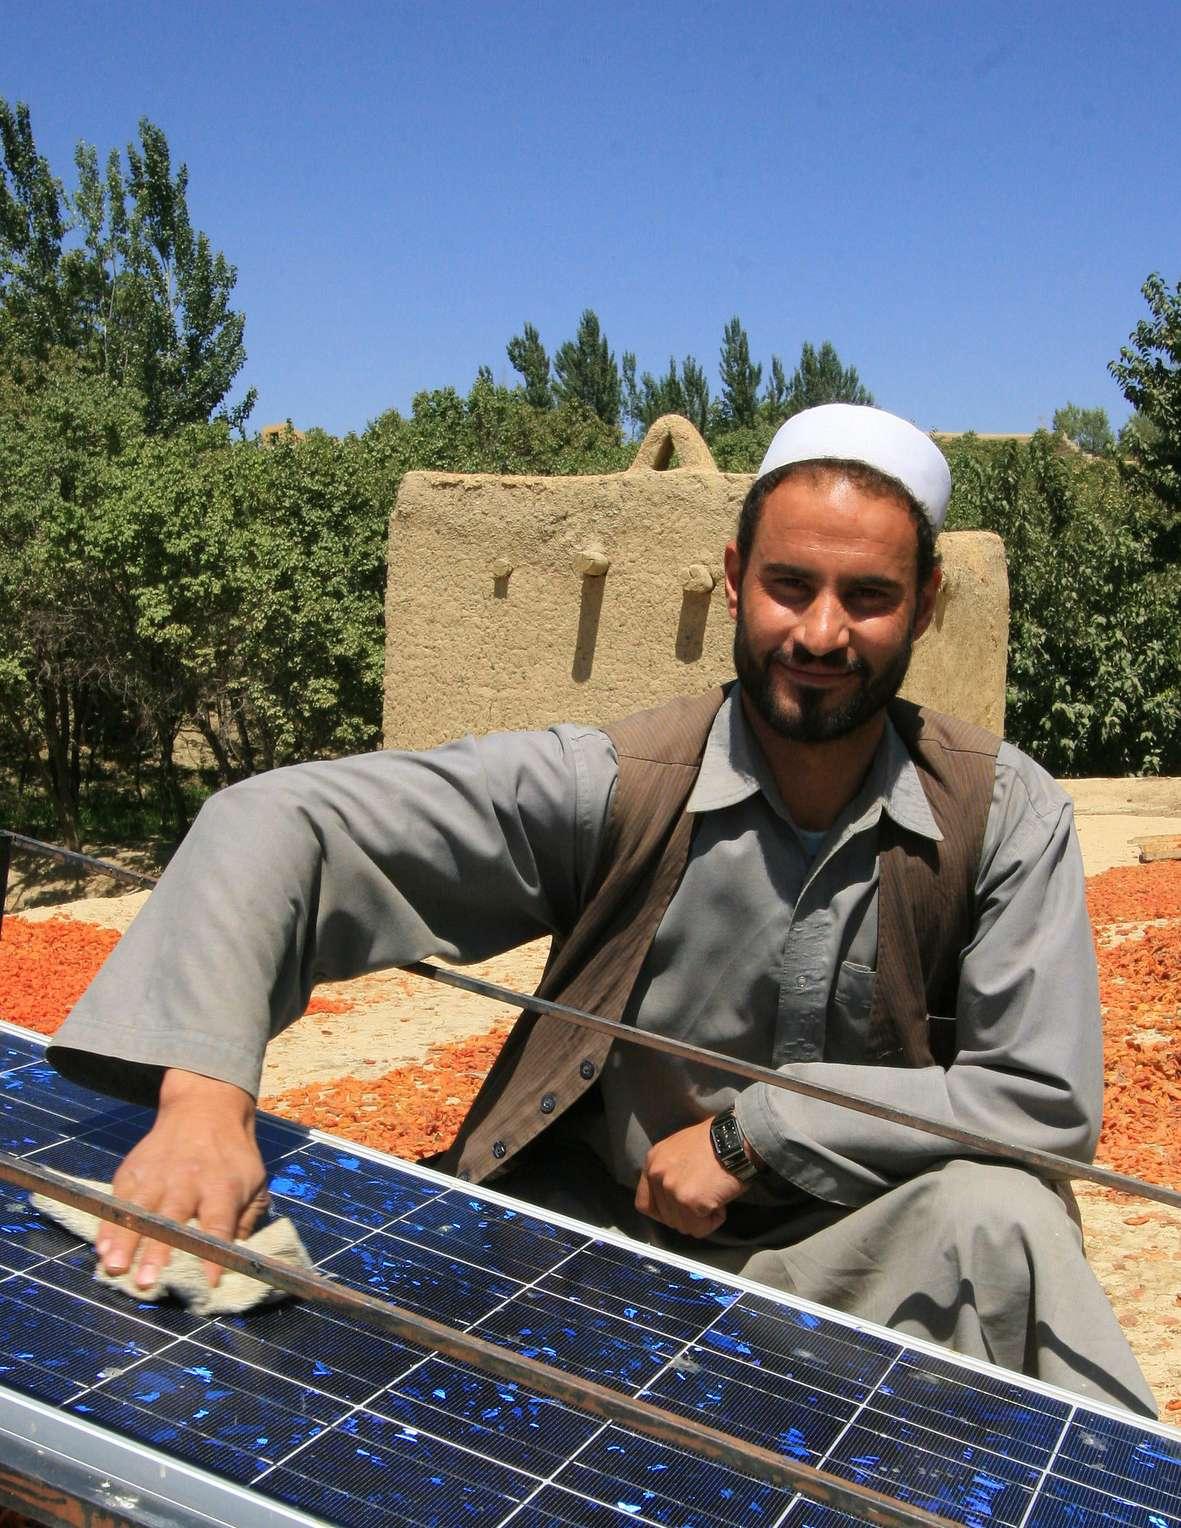
THE WORLD BANK SUSTAINABLE DEVELOPMENT BONDS & GREEN BONDS | IMPACT REPORT 2020 96
Photo Credit: Sofie Tesson / Taimani Films / World Bank
Green Bonds Results + Committed & Allocated Amounts for Projects Approved and Disbursing in FY20 Renewable Energy & Energy Efficiency 98 Clean Transportation 108 Water and Wastewater Management ������������������� 116 S olid Waste Management 122 B iodiversity 124 A griculture, Land Use, Forests, and Ecological Resources ���������������������������������������������������������������� 128 R esilient Infrastructure, Built Environment, and Other 134 PROJEC t-B y-PROJEC t REPOR ting | gREE n B O n D s 97 Notes: Results should be read in conjunction with the Resources section, which describes the reporting approach. The net proceeds from the sale of any World Bank bonds are not committed or earmarked for the lending to, or financing of, any particular projects, programs or activities. Returns on World Bank bonds are not linked to the performance of any particular projects, programs or activities.
PROJECT-BY-PROJECT REPORTING
Renewable Energy & Energy Efficiency
# Link to More Information Project Name (Number | Year/s Loans Approved) and Description
1 Beijing Rooftop Solar Photovoltaic Scale-Up (Sunshine Schools) Project (P125022 | FY13): increase electricity generated from distributed solar photovoltaic systems, and demonstrate the viability of the renewable energy service company model for scaling up the deployment of such systems, in various sectors in Beijing Municipality.*
2 Eco-Farming Project (P096556 | FY09): promote sustainable farming systems and reduce greenhouse gas emissions (from methane and burning coal and firewood) benefiting rural communities with biogas systems.
3 Energy Efficiency Financing (P084874 | FY08, FY12): promote energy conservation in China’s industrial sector supporting intermediary loans for energy efficiency projects in medium and largesized manufacturing companies.
4 Energy Efficiency Financing II Project (P113766 | FY10): promote energy conservation in China’s industrial sector through intermediary loans to energy efficiency projects.
5 Green Energy Schemes for Low-carbon City in Shanghai (P127035 | FY13): promote greener city development with energy efficiency and renewable energy installations in commercial and government buildings.
6 Jiangxi Shihutang Navigation & Hydropower (P101988 | FY09): maximize inland waterway transport capacity as a low-carbon alternative to land transport and generate hydropower.
7 Liaoning Third Medium Cities Infrastructure (P099224 | FY08): improve the energy efficiency and environmental performance of heating and gas services.
THE WORLD BANK SUSTAINABLE DEVELOPMENT BONDS & GREEN BONDS | IMPACT REPORT 2020 98
Country A/M /a Project Life Annual Energy Savings /c MWh
China M 20 N/A
China M 20 N/A
China M 20 21,713,380
China M 20 1,908
China M 20 635,712
China Both 20 N/A
China M 20 2,757,200
Target Results /b
• 5 sectors in which renewable energy service contracts have been signed. The installation capacity by sector is as follows: industry (40 MW), schools (30 MW), commerce and infrastructure (18.4 MW), logistics (10 MW), and agriculture (3.6 MW).
• 560,000 people provided with access to electricity generated in education establishment.
• 470,000 rural households benefit from cleaner biogas-based cooking and heating systems.
• 344,346 clients who adopted an improved agricultural technology promoted by the project, 280,092 of which are female.
• 155,560 new water connections providing households clean water for improved hygiene and sanitary conditions Updated for actual results at project completion.
tce annual energy savings (assuming
subprojects).
• 78,083 tons of coal equivalent of annual energy savings per annum.
• Innovative policies piloted under the Project in relation to green-energy retrofitting of buildings.
for actual results at project completion.
• 4,389 ha of crop land protected from flooding.
• RMB 26.6 million reduction in annual flood losses.
• Shortened travel distance benefitting 150,000 people. Updated for actual results at project completion.
• 8,935 tons of sulphur dioxide avoided per annum.
• 11,659 tons of total suspended particles (local pollutant) avoided per annum.
• Decrease by 31% of fuel consumption annually (from 199.5 kWh/m 2 to 137.9 kWh/m 2 ).
• Decrease by 39% of electricity used for District Heating annually (from 4.4 kWh/m 2 to 2.7 kWh/m 2 ).
• Decrease by 31.25% of make-up water annually (from 115.5 L/m 2 to 79.34 L/m 2 ).
Updated for actual results at project completion.
PROJEC t-B y-PROJEC t REPOR ting | g REE n BO n D s | R E n EWAB l E En ER gy & En ER gy E FF i C i E n C y 99
Project Closed Project Closed in FY20
Active Project COVID-19 Project
Annual Energy Produced MWh Renewable Capacity Added MW Annual GHG Emissions Avoided Tons of CO₂ Eq. /d Other Results /e Committed US$ mil /f IBRD share /g Allocated US$ mil /h 111,510 102 87,992
Updated
83.5 50% 83.5 ~ ~ 785,000
for actual results at project completion.
119.8 27% 119.8 N/A N/A 6,510,000
2,667,000
Updated for actual results at project completion. 300.0 45% 300.0 N/A N/A 607,000
Updated for actual results at project completion. 45.5 66% 45.5
~ 189,946
•
150
•
~
Updated
100.0 41% 100.0 284,000 120 220,000
100.0 31% 100.0 N/A N/A
165.0 51% 165.0
Renewable Energy & Energy Efficiency
THE WORLD BANK SUSTAINABLE DEVELOPMENT BONDS & GREEN BONDS | IMPACT REPORT 2020 100
# Link to More Information Project Name (Number | Year/s Loans Approved) and Description Country A/M /a Project Life Annual Energy Savings /c MWh 8 Shandong Energy Efficiency (P114069 | FY11): improve the energy efficiency and environmental performance of the industrial sector and finance renewable energy production from biomass (corn and wheat stalk). China M 15 2,707,580 9 Urumqi District Heating Project (P120664 | FY11): promote energy efficiency in district heating by replacing dispersed boilers in urban areas with an integrated district heating network. China M 20 1,229,400 10 Power System Development Project IV (P101653 | FY09): expand transmission infrastructure resulting in decreased CO₂ emissions through efficiency gains and transferring surplus hydro energy to power deficit regions. India M 20 8,699,000 11 Rampur Hydropower Project (P095114 | FY08): scale- up access to renewable energy through construction of a run-of-the-river hydroelectric scheme. India M 30 N/A 12 Indonesia Geothermal Energy (P113078 | FY12): increase power generation from renewable geothermal resources. Indonesia M 30 N/A 13 Energy Security and Efficiency Enhancement Project (P112780 | FY11): increase energy efficiency and security by promoting greater participation of renewable energy and gas-based generation in the energy mix. Jamaica M N/A N/A 14 Efficient Lighting and Appliances Project (P106424 | FY11): promote the efficient use of energy and to mitigate climate change by increasing the use of energy efficient technologies in the residential sector. Mexico M 5 1,848,000
~ 623 ~
331,000 tce of energy savings annually.
• 1,626 MW of inefficient coal-fired boilers replaced by combined heat and power district heating network. Updated for actual results at project
• Reduced transmission losses equivalent to between 526-993 MW.
• 1,400 MW of increased interregional power transmission capacity to National Grid.
• Transformation capacity increased by 146,523 MVA.
• 106,804 circuit km of transmission lines’ increased capacity.
• 78,384 GWh power exchange growth between regions.
• 30,303,750 tons of CO ₂ eq. cumulative emission reduction over 30 years.
• 10,000 tons of avoided local air pollution (2,753 tons of NOx,4,923 tons of SO₂, 2,324 tons of TSP) annually.
• New renewable electricity generated by three wind farms, two solar farms, and one hydro plant.
• 600 GWh from renewable resources annually.
• Cumulative over 5 years: -Exchange 45.8 million light bulbs and 1.884 million appliances replaced over a five-year period.
-5.07 million tons of CO₂ eq. emissions reduced. -50-60% electricity saved in residential households. -9,242 GWh in cumulative energy savings.
PROJEC t-B y-PROJEC t REPOR ting | g REE n BO n D s | R E n EWAB l E En ER gy & En ER gy E FF i C i E n C y 101
Annual Energy Produced MWh Renewable Capacity Added MW Annual GHG Emissions Avoided Tons of CO₂ Eq. /d Other Results /e Committed US$ mil /f IBRD share /g Allocated US$ mil /h
~ ~
Updated for actual results
completion. 110.1 47% 110.1 N/A N/A 415,500
Project Closed Project Closed in FY20 Active Project COVID-19 Project Target Results /b
~
•
at project
99.1 29% 99.1 N/A N/A
completion.
Updated for actual results at project completion. 400.0 16% 400.0 1,957,000 412 1,407,700 • Updated for actual results at project completion. 400.0 60% 400.0 1,208,880 (generation projection July 2019) 150 1,010,125
Updated for actual results
completion. 129.0 30% 129.0
at project
Updated
completion. 14.5 100% 14.5 N/A N/A 1,014,800
for actual results at project
250.6 35% 250.6
Updated for actual results at project completion.
Renewable Energy & Energy Efficiency
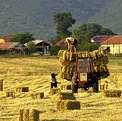
Integrated Energy Services (P088996 | FY08): increase energy access for poor communities using renewable energy (mainly solar and some wind turbines) and to develop a sustainable market for providing energy services in remote rural areas.
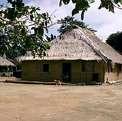
19 Second Rural Electrification (P117864 | FY11): provide electricity to remote communities by extending the conventional electricity grid and financing solar photovoltaic systems.
20 Energy Efficiency (P104266 | FY09): support industrial energy efficiency and co- generation investments by providing financing through intermediaries.
21 Private Sector Renewable Energy and Energy Efficiency Project (P112578 | FY09, FY12): enhance renewable energy access (small hydroelectric and geothermal) and energy efficiency in industries (iron and steel, cement, ceramics, chemicals and textiles).
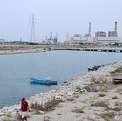
THE WORLD BANK SUSTAINABLE DEVELOPMENT BONDS & GREEN BONDS | IMPACT REPORT 2020 102
# Link to More Information Project Name (Number | Year/s Loans Approved) and Description Country A/M /a Project Life Annual Energy Savings /c MWh
Mexico M 20 N/A
Mexico M 10 45 17 District
Moldova M 30 96,700 18 Energy
Montenegro M 15 7,925
Peru M 20 N/A
15
16 Sustainable Rural Development (and Additional Financing) (P106261 | FY09, FY13): increase the use of energy efficient, waste management and renewable energy technologies in agribusiness.
Heating Efficiency Improvement (P132443 | FY15): improve quality and reliability of heating services by improving the operational efficiency and viability of a new district heating company.
Efficiency (and Additional Financing) (P107992 | FY09, FY14): improve energy efficiency and environmental quality in 27 buildings used for health and education services.
Tunisia M 20 580,000
Turkey M 20 3,023,800
Target Results /b
• 2,235 rural households receive electricity from renewable sources annually.
• 150 new social/productive activities and microbusiness developed.
• Larger long-term national impact with replication throughout rural areas. Updated for actual results at project completion.
• Cumulative over 8.5 years:
-143,450 MWh saved from energy efficiency investments.
-221,624 MWh produced by renewable (biomass) energy.
-6.02 million tons of CO₂ eq. emission avoided over the course of the project.
-1,842 agribusinesses adopted 2,286 environmentally sustainable technologies. Updated for actual results at project completion.
• 34% reduction in heating system breakdowns by year 5.
• 109,000 people with access to more energy efficient cooking and heating.
• 320,109,612 MJ annual fuel savings.
• Cumulative over project life and targeting 27 buildings:
MWh in lifetime energy savings.
metric tons of CO₂ eq. lifetime emissions reduced.
• 42,500 rural households electrified, of which 20,000 served by solar photovoltaic systems from regulated electricity distribution companies.
• 169,000 people benefited.
for actual results at project completion.
PROJEC t-B y-PROJEC t REPOR ting | g REE n BO n D s | R E n EWAB l E En ER gy & En ER gy E FF i C i E n C y 103 Project
Project
Closed
Closed in FY20 Active Project COVID-19 Project
Annual Energy Produced MWh Renewable Capacity Added MW Annual GHG Emissions Avoided Tons of CO₂ Eq. /d Other Results /e Committed US$ mil /f IBRD share /g Allocated US$ mil /h 152 2 139,000
12.0 18% 12.0 26,073 708,235
79.1 48% 79.1 N/A N/A 22,800
Project Completed. 40.5 66% 39.9 N/A N/A 2,766
-118,880
-41,504
Updated
completion. 12.4 100% 12.4
for actual results at project
Updated
43.8 60% 43.8 N/A N/A 205,840
Updated for actual results at project completion. 31.4 91% 31.4 3,728,000 933 3,214,000
Increase country’s renewable energy capacity
31%. Updated for actual results at project completion. 901.8 87% 901.8
•
•
to
Renewable Energy & Energy Efficiency
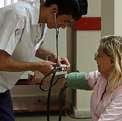

22 SME Energy Efficiency (P122178 | FY13): improve energy efficiency in small and medium enterprises in energy-intensive industries by scaling- up commercial bank lending for energy efficiency investments.
23 Energy Efficiency (P096586 | FY11): improve energy efficiency in order to meet energy intensity reduction targets, decrease dependence on imported gas, and decrease the cost of energy supply.
24 Biomass District Heating (P146194 | FY14): increase energy efficiency in district heating systems and replace natural gas with wood biomass as a renewable energy source.
25 Financing for Air Pollution Control (P154669 | FY16): reduce air pollutants and carbon emissions through lending for energy efficiency and clean energy, with a focus on the Jing-Jin-Ji and neighboring regions.
26
Grid-Connected Rooftop Solar Program (P155007 | FY15): increase solar rooftop capacity to the power grid and incentivize the market for rooftop solar power by way of low cost financing.
27
Shared Infrastructure for Solar Parks Project (P154283 | FY17): increase solar generation capacity through the establishment of large-scale solar parks in the country.
28 Municipal Energy Efficiency Project (P149872 | FY16): promote energy efficiency in street lighting, water use and buildings in 23 municipalities.

29 Montenegro Second Energy Efficiency Project (P165509 | FY18): improve energy efficiency in health sector buildings, and develop and demonstrate a sustainable financing model.
THE WORLD BANK SUSTAINABLE DEVELOPMENT BONDS & GREEN BONDS | IMPACT REPORT 2020 104
# Link to More Information Project Name (Number | Year/s Loans Approved) and Description Country A/M /a Project Life Annual Energy Savings /c MWh
Turkey M 20 536,537
Ukraine M 15 7,721,157
Belarus M 20 236,000
China M 20 1,628,200
India M 25
India M 25 ~
Mexico M 8 127,590
Montenegro M 15 3,981
• Create jobs directly and indirectly through increased cost competitiveness as a result of lower energy intensity.
• Cumulative over 5 years:
MWh energy savings from efficiency investments.
tons of CO₂ eq. emissions reduced.
direct beneficiaries.
tons of particulate emissions (local air pollutants) reduced by EE and RE subprojects financed.
• The 250 MW of capacity of rooftop solar photovoltaics expected to be grid-connected by 5 years with at least another 150 MW to be connected in subsequent years.
• 13 million tons CO₂ eq. in cumulative savings over the project’s 25-year life.
• Market development for rooftop photovoltaic systems in different business models.
• Increase in access roads, water supply and drainage, telecommunications, pooling station inside the solar parks.
• 1,020,714 MWh projected lifetime savings.
• 28 sub-projects designed.
• 18 buildings retrofitted annually.
• 1,200,000 US$ captured energy cost savings annually.
• 220,000 potential patients and 2,000 staff benefiting.
PROJEC t-B y-PROJEC t REPOR ting | g REE n BO n D s | R E n EWAB l E En ER gy & En ER gy E FF i C i E n C y 105
Project
Annual Energy Produced MWh Renewable Capacity Added MW Annual GHG Emissions Avoided Tons of CO₂ Eq. /d Other Results /e Committed US$ mil /f IBRD share /g Allocated US$ mil /h N/A N/A 397,796 • Updated for actual results at project completion. 201.0 67% 201.0 N/A N/A 856,097
Project Closed
Closed in FY20 Active Project COVID-19 Project Target Results /b
Updated for actual results at project completion. 200.0 100% 200.0 1,660,000 106 420,000
-1,180,000
-2,100,000
-78,760
90.0 100% 72.4 N/A N/A 492,200 • 3,600
515.6 100% 302.6 647,200 400 520,000
500.0 55% 375.9 ~ 1,750 951,852
75.0 75% 11.0 5,800 6 7,241
100.0 64% 11.0 N/A 37,333
6.7 82% 2.4
Renewable Energy & Energy Efficiency

30 Clean and Efficient Energy Project (P143689 | FY15): develop the first utility sized photovoltaic plant to more reliably supply solar power to remote regions.
31 Noor Ouarzazate Concentrated Solar Power (P131256 | FY12, FY15): replace fossil fuelbased electricity with renewable energy using concentrated solar power technology.
32 Renewable Energy Integration (P144534 | FY14): assist in meeting increased power demand by strengthening the transmission system and facilitating large- scale renewable energy generation.
33 District Heating Energy Efficiency (P132741 | FY14): improve energy efficiency and quality of service of District Heating companies.
34 Energy Efficiency Facility for Industrial Enterprises, Phase 3 (P165054 | FY18): improve energy efficiency in Industrial Enterprises (IEs) by designing and establishing a financing mechanism for energy saving investments.
Uzbekistan - Advanced Electricity Metering Project (P122773) has been removed from this report. The majority of its loan has been cancelled due to implementation issues.
Notes:
N/A – Indicator is not applicable for this project.
~ – Indicator is not measured/reported for this project.
Amounts may not add up due to rounding.
/a Column indicates whether the project aims to mitigate climate change (“M”), help client countries adapt to the effects of climate change (“A”), or both.
/b Target results are expected impacts based on estimates developed at the time of project approval and materializing at the end of the project implementation period (5 years in most cases). The indicators shown are normally a subset of the development impacts contained in project documentation available in the World Bank project website (http://www. worldbank.org/projects). Results reported are based on the entire project, with the percent shown next to the loan amount corresponding to the proportion of the total financing that is financed by World Bank loans. Actual impacts may be different from these estimates and do not represent the actual results in a specific year. Quantitative estimates are intended to be indicative of the scale of impacts and qualitative results aim to inform about the nature of changes that will be achieved as a result of projects included in the Green Bond program once they are completed and at full capacity.
/c Annual energy savings include reduced energy use for both power and heat, where applicable and calculated by the project’s lifetime when possible (otherwise calculated based on the project’s implementation period).
THE WORLD BANK SUSTAINABLE DEVELOPMENT BONDS & GREEN BONDS | IMPACT REPORT 2020 106
and Description Country A/M /a Project Life Annual Energy Savings /c MWh
# Link to More Information Project Name (Number | Year/s Loans Approved)
Morocco M 25 N/A
Morocco M 30 N/A
Turkey M 20 N/A
Ukraine M 20 524,000
Uzbekistan M 25 122,600
/d Annual GHG Emissions avoided are calculated by the project’s lifetime when possible (otherwise calculated based on the project’s implementation period)
/e For closed projects, “Project Completed” refers to a closed project for which its Implementation Completion Report (ICR) is not available yet. “Updated for actual results at project completion” refers to a closed project where ICR is available, and target results are updated accordingly.
/f The committed amount is the Green Bond eligible portion of the World Bank loan net of cancellations reported in equivalent US$ millions. Loans denominated in other currencies are converted to US$ equivalents using the spot exchange rate on the report date (June 30, 2020).
/g The percentage shows the share of the total financing that is provided by World Bank loans. When a project is co-financed, this share could be used to apportion total results to the World Bank
/h The allocated amount is the amount of Green Bond proceeds allocated to support the financing of disbursements to the project reported in equivalent US$ millions. Loans denominated in other currencies are converted to US$ equivalents using the spot exchange rate on the report date (June 30, 2020).
* indicates that the information has been updated in the FY20 Green Bond Impact Report.
PROJEC t-B y-PROJEC t REPOR ting | g REE n BO n D s | R E n EWAB l E En ER gy & En ER gy E FF i C i E n C y 107
Project
FY20
COVID-19 Project Target Results /b Annual Energy Produced MWh Renewable Capacity Added MW Annual GHG Emissions Avoided Tons of CO₂ Eq. /d Other Results /e Committed US$ mil /f IBRD share /g Allocated US$ mil /h ~ 75 73,512 • 412,000 people benefit from electricity and associated economic opportunities of which 50% are expected to be female. 125.0 79% 74.9 1,638,000 410 522,000 • 1,100,000 direct project beneficiaries, 50% of which are expected to be female. 342.8 15% 186.9 1,734,000 690,000 • 52 km of transmissions lines constructed or rehabilitated. 243.9 63% 225.9 N/A N/A 261,800 • 721,400 consumers served by the participating companies. 160.0 87% 81.2 N/A 158,638 • 70 beneficiary industrial enterprises. • 50 industrial enterprises which adopted energy management system. 200.0 62% 55.6 Total Allocated for Renewable Energy & Energy Efficiency 6,198.15 5,238.5 Cumulative Loan Repayments (673.5) Total Allocated and Outstanding for Renewable Energy and Energy Efficiency 4,565.0
Project Closed
Closed in
Active Project
Clean Transportation
35 Changzhi Urban Transport (P124978 | FY12): improve transport mobility and accessibility while reducing emissions in a safe, energysaving, and efficient manner for all users.
36 Hubei Xiangyang Urban Transport (P119071 | FY12): improve mobility, safety, and efficiency in urban transportation.
37 Nanchang Urban Rail (P132154 | FY13): provide an effective urban mass rapid transit system for a rapidly expanding city to reduce pollution, traffic congestion, and commuting times.
38 Wuhan Second Urban Transport (P112838 | FY10): improve efficiency, coverage and safety of public transport systems in an environmental, sustainable, integrated and safe way.
39 Xi’an Sustainable Urban Transport (P092631 | FY08): improve transport accessibility and mobility and enhance air quality monitoring of the urban transport system.
40 Xinjiang Yining Urban Transport Improvement Project (P126454 | FY12): provide improved access, safety, and efficiency in public transportation in an environmentally sustainable manner.
41 Colombia Integrated Mass Transit Systems (P082466 | FY10) : scale-up the National Urban Transport Project’s physical scope through expanding trunk corridors and feeder routes to meet increased demand and improve associated infrastructure.
million passengertrip per year (40% increase). • 61,000 additional people with access to quality urban transport services.
THE WORLD BANK SUSTAINABLE DEVELOPMENT BONDS & GREEN BONDS | IMPACT REPORT 2020 108
# Link to More Information Project Name (Number | Year/s Loans Approved) and Description Country A/M /a Project Life Pass/km and/or passengers Ton/km and/or tons
China M 25 ~ N/A
China M 25 • 52,000 beneficiaries of
the
N/A
reduced travel times and greater access to
city center.
China M 30 • 206,800 passenger- trips per day. N/A
China M 20 ~ N/A
China M 25 • 52,000 public bicycles with 70 million users annually. N/A
China M 30 •
N/A
105.5
Colombia M 24 ~ N/A
459,000
Target Results /b
• 10% reduction in fuel consumption per passenger-km on project corridors.
• 48% reduction in traffic fatalities.
• Reduced travel times during peak hours.
• 50 new electric buses in use.
• 25 km of roads (non-rural) rehabilitated.
• 25.5 km of bus priority lanes built. Updated for actual results at project completion.
• 40 new and higher quality buses in operation.
• 7 average fatalities and severe injured associated with traffic accidents recorded.
• 100 new bus stops constructed or upgraded. Updated for actual results at project completion.
• 23 minutes of reduced travel time on public transport.
• 100% of stations with barrier-free accessibility to the wheel-chair bound and sight impaired.
• 100% integration of facilities for bus/rail/bike transfer designed and constructed in line with integration plan.
• 506,000 project beneficiaries. Updated for actual results at project completion.
• Establish facilities for pedestrians and cyclists.
• 33% modal share of public transportation on target corridors.
• An average of a 13 minute decrease in travel time at peak hours. Updated for actual results at project completion.
~
• Doubled area of bus terminals.
• 275% increase in average speed of public transportation from 12 to 45 km/hr.
• Air quality monitoring system/facility implemented.
• 31,000 vehicles with emissions tested.
• 320,214 m2 of areas of bus terminals achieved. Updated for actual results at project completion.
• Reduced peak-hour travel times in two integrated corridors.
• Reduced traffic accident fatalities.
• 33.54 km of roads constructed in a new developing area.
• 30.4 km of urban roads improved. Updated for actual results at project completion.
• 81.5 km of segregated trunk-lines constructed.
• 95.5 km of pre-trunk and feeder lines constructed.
• 4 terminals/garages constructed.
• 125 stations constructed.
for actual results at project completion.
PROJEC t-B y-PROJEC t REPOR ting | g REE n BO n D s | Cl EA n tRA ns POR tAti O n 109 Project
Project
in FY20 Active Project COVID-19 Project
Closed
Closed
GHG emissions reduced/ avoided /c Other Results /d Committed US$ mil /e IBRD share /f Allocated US$ mil /g ~
91.5 50% 91.5
~
99.8 47% 99.8 ~
189.5 10% 189.5
100.0 16% 100.0
150.0 36% 150.0
90.9 48% 90.9
295.9 40% 295.9
Updated
Clean Transportation
42 Sustainable Urban Transport (P110371 | FY10): improve government capacity to manage climate friendly urban transport solutions focusing on public and non-motorized transport.
43 Urban Transport Transformation (P107159 | FY10): reduce carbon emissions and transform public transportation efficiency.
44 Lima Metro Line 2 Project (P145610 | FY15): construction of a 35 km subway line and related infrastructure improving transportation in the eastwest axis of the Lima-Callao Metropolitan area.
45 Greening Rio de Janeiro Urban Rail Transit – Additional Financing (P125630* | FY12): provide a more efficient and cleaner suburban rail system.
46 Sao Paulo State Sustainable Transport (P127723 | FY13): improve transport efficiency and safety, increase share of waterway transport, and improve resilience to climate change and natural disasters.
47 HaJia Railway (P117341 | FY14): provide additional railway capacity and reduce transport time for passengers and freight.
48 Heilongjiang Cold Weather Smart Public Transportation System (P133114 | FY14): upgrade the quality, safety and efficiency of public transport service.
49 Jiaozuo Green Transport and Safety Improvement (P132277 | FY14): improve transport safety and efficiency along the selected transport corridors and promote non-motorized trips within the pilot green corridor.
China M 30
100 most critical spots.
• 3 million additional passengers per year.
30% increase in exported biofuel transported by waterway 6 million tons/year freight in the TieteParana waterway (400% increase).
7 million additional freight volume per year.
China M 20
• 38.8 million more bus rides annually due to increased efficiency of bus service.
N/A
China M 30

• 241,500 non-motorized trips per year in the green corridor.
• 32,400 additional bus passengers per year.
N/A
THE WORLD BANK SUSTAINABLE DEVELOPMENT BONDS & GREEN BONDS | IMPACT REPORT 2020 110
# Link to More Information Project Name (Number | Year/s Loans Approved) and Description Country A/M /a Project Life Pass/km and/or passengers Ton/km and/or tons
India M 30 • 5,750 additional passengers per day. N/A
Mexico M 13 ~ N/A
Peru M 17 • 360,000 passengers per day. • 100,000 additional jobs reachable by public transportation within 60 minutes. N/A
Brazil M 30 • 700,000 passengers per day (40% increase since 2009). N/A
Brazil Both 20 • 50% reduction of
in
road fatalities
the
Target Results /b
312,000 tons of CO₂ eq. emissions reduced annually over the first 10 years.
46,842 tons of CO₂ eq. emissions reduced annually.
• 68 new safe sidewalks and cycle tracks.
• 50% public transport trip mode share.
Updated for actual results at project completion.
46,120 tons of CO₂ eq. emissions reduced annually.
• 2.1 integrated mass transit corridors of 15 km each. Updated for actual results at project completion.
34,000 tons of CO₂ eq. reduced annually
• 34% reduction in travel time per trip.
• Benefits 1.6 million people for improved access to jobs. Project Completed.
9,600 tons of net CO₂ reduced annually
• 100 new trains delivered and in operation.
• Upgraded infrastructure.
• Shorter travel and waiting times.
• Bicycle parking facilities in select stations.
• 750 km of roads rehabilitated.
• 40 new automatic stations to monitor climate risk.
• 39 additional municipalities with disaster risk mapping.
• Reduced passenger and freight travel time by respectively 254 and 210 minutes.
• 15 million people benefit including rural poor.
• Reduced pollution from shift to electric railways from road and air transport.
27,382 tons of CO₂ reduced annually.
• 20-30% reduction in fuel use.
• 22-25 km of improved transport corridors developed.
• 320 new cleaner-fuel vehicles procured.
~
• 490,000 beneficiaries of which 241,000 are women.
• Reduced traffic fatalities by 36%.
• 17 km in green corridors exclusively dedicated to pedestrians and cyclists.
• 35.3 km of corridor constructed or improved.
PROJEC t-B y-PROJEC t REPOR ting | g REE n BO n D s | Cl EA n tRA ns POR tAti O n 111
Project Closed Project Closed in FY20 Active Project COVID-19 Project
reduced/ avoided /c Other Results /d Committed US$ mil /e IBRD share /f Allocated US$ mil /g
GHG emissions
88.8 32% 88.8
52.0 6% 52.0
70.0 5% 70.0
519.3 73% 425.8
300.0 70% 248.4
300.0 5% 291.3
154.0 46% 126.6
100.0 50% 70.6
Clean Transportation
# Link to More Information
50 Qinghai Xining Urban Transport Project (P127867 | FY14): provide more efficient, safer and cleaner transportation.
51 Tianjin Urban Transport Improvement Project (P148129 | FY16): leverage the existing metro system and promote walking and biking in the urban core to make transport greener and safer.
52 Urumqi Urban Transport Project II (P148527 | FY16): improve mobility in selected transport corridors and reduce pollution from cars with a bus rapid transit (BRT) system.
53 Yunnan Honghe Prefecture Diannan Center Urban Transport (P101525 | FY14): improve the safety, accessibility, and efficiency of transportation in core urban areas by building new infrastructure, staff training and education campaigns.
54 National Urban Transit Program (P117947 | FY12): reduce carbon emissions and improve public transportation efficiency and safety.
55 Manta Public Services Improvement Project (P143996 | FY14): improve transport services and the quality and sustainability of water and sanitation.
56 Quito Metro Line One (P144489 | FY15): improve urban mobility and serve the growing demand for public transport.
57 Quito Metro Line One (Additional Financing) (P158756 | FY18): improve urban mobility in the city of Quito serving the growing demand for public transport and reduce emissions of pollutants and GHG.
85,000 new metro users per day.
• 135,000 new non-motorized trips per day.
• 645,000 people benefit from direct access to BRT corridors and greener/ more efficient transport.
THE WORLD BANK SUSTAINABLE DEVELOPMENT BONDS & GREEN BONDS | IMPACT REPORT 2020 112
Project
Country A/M /a Project Life Pass/km and/or passengers Ton/km and/or tons
Name (Number | Year/s Loans Approved) and Description
M 30 •
N/A
China
264,000 additional passengers per day.
China
•
M 20
N/A
China
N/A
M 30
China M 25
N/A
• 742,000 people gaining access to urban transport service. • 38 million additional passenger trips annually.
Colombia M 15 ~ N/A
Ecuador M 30 • 505
N/A
average daily cyclist traffic (20% increase). • 3,150 average daily pedestrian traffic (25% increase).
Ecuador M 30 •
per
N/A
* 296,000 passengers
day.
Ecuador M 30 ~ N/A
~
Target Results /b
260 tons of CO₂ reduced annually.
• 20% decrease in travel time.
• Improved accessibility to 189,400 jobs.
• Reduced vehicle pollution.
• 400,000 project beneficiaries.
• 2.8 million trips benefit from improvements each day.
• 50 km of roads rehabilitated, 111 metro stations improved and 5 new bus terminals completed.
110,000 tons of CO₂ reduced.
• 51.7 km of BRT routes operated.
• 45% of commuters using smart cards.
• 450% increase in average passenger boardings per bus/km during peak hours.
~
• Reduced average travel time for public transport users of 10.5-15 minutes.
• Reduced the number of transport related fatalities.
• 15.4 km of roads constructed and/or re-functioned.
10% reduction of PM10 concentration level.
• Reduced average travel time for low income riders from 11.4 to 22.2 minutes.
• Reduced accidents and pollution (including greenhouse gases) associated with bus transport services.
• 25 km of rehabilitated pedestrian public space.
• 71,000 residents benefit from water connection investments.
• Improved mobility and accessibility of street network including pedestrian facilities and cycling paths.
• 24 hours of continuity of water supply service.
• 2,318 and 17,500 piped household water connections respectively constructed and rehabilitated.
* 82,285 tons of CO₂ eq. emissions reduced annually.
• US$14 million in annual fuel savings.
• 40% reduction in average travel time.
• 1,800 jobs created.
• 51% of jobs accessible in 60 minutes of travel time.
• Reporting mechanism for cases of violence against women and girls implemented.
• 20% of technical and professional staff, directly employed by the operator, that is female.
*This project represents the Additional Financing to Quito Metro Line One’s parent project (P144489) and its target results should be read together with those of the parent project.
PROJEC t-B y-PROJEC t REPOR ting | g REE n BO n D s | Cl EA n tRA ns POR tAti O n 113
Project Closed Project Closed in FY20 Active Project COVID-19 Project
GHG emissions reduced/ avoided /c Other Results /d Committed US$ mil /e IBRD share /f Allocated US$ mil /g
30.3 48% 21.5
100.0 45% 24.7
140.0 26% 59.8
150.0 43% 69.4
198.0 25% 153.8
100.0 87% 94.3
205.0 12% 201.8
230.0 36% 184.3
Clean Transportation
58 Eastern Dedicated Freight Corridor - II (P131765 | FY14): increase the capacity and quality of freight rail service.
59
Cebu Bus Rapid Transit (BRT) Project (P119343 | FY15): improve the quality, safety, and environmental performance of urban public transportation.
60 Metro Manila Bus Rapid Transit Line 1 (P132401 | FY17): improve, in an environmentally sustainable manner, the efficiency, effectiveness and safety of the public transport system along the project corridor in Metro Manila.
Notes:
N/A – Indicator is not applicable for this project. ~ – Indicator is not measured/reported for this project. Amounts may not add up due to rounding
/a Column indicates whether the project aims to mitigate climate change (“M”), help client countries adapt to the effects of climate change (“A”), or both.
/b Target results are expected impacts based on estimates developed at the time of project approval and materializing at the end of the project implementation period (5 years in most cases). The indicators shown are normally a subset of the development impacts contained in project documentation available in the World Bank project website (http://www.worldbank.org/projects). Results reported are based on the entire project, with the percent shown next to the loan amount corresponding to the proportion of the total financing that is financed by World Bank loans. Actual impacts may be different from these estimates and do not represent the actual results in a specific year. Quantitative estimates are intended to be indicative of the scale of impacts and qualitative results aim to inform about the nature of changes that will be achieved as a result of projects included in the Green Bond program once they are completed and at full capacity.
/c Annual GHG Emissions avoided are calculated by the project’s lifetime when possible (otherwise calculated based on the project’s implementation period).
/d For closed projects, “Project Completed” refers to a closed project for which its Implementation Completion Report (ICR) is not available yet. “Updated for actual results at project completion” refers to a closed project where ICR is available.
/e The committed amount is the Green Bond eligible portion of the World Bank loan net of cancellations reported in equivalent US$ millions. Loans denominated in other currencies are converted to US$ equivalents using the spot exchange rate on the report date (June 30, 2020).
/f The percentage shows the share of the total financing that is provided by World Bank loans. When a project is co-financed, this share could be used to apportion total results to the World Bank.
/g The allocated amount is the amount of Green Bond proceeds allocated to support the financing of disbursements to the project reported in equivalent US$ millions. Loans denominated in other currencies are converted to US$ equivalents using the spot exchange rate on the report date (June 30, 2020).
* indicates that the information has been updated in the FY20 Green Bond Impact Report.
THE WORLD BANK SUSTAINABLE DEVELOPMENT BONDS & GREEN BONDS | IMPACT REPORT 2020 114
# Link to More Information Project Name (Number | Year/s Loans Approved) and Description Country A/M /a Project Life Pass/km and/or passengers Ton/km and/or tons
India M 22 • N/A 22 tons of freight traffic annually.
M 20 •
N/A
Philippines
275,000 additional passengers using public transportation annually.
Philippines M 28 • 300,000
N/A
direct beneficiaries daily.
Target Results /b
400,000 tons of CO₂ eq. emissions reduced annually.
• 1,133 km of new freight-only rail.
• Axle-load limit raised from 23 to 25 tons increasing speeds.
193,350 tons of CO₂ eq. emissions avoided annually.
• 22% reduction of annual accidents in city.
* 206,892 tons of CO₂ eq. emissions avoided annually.
• Average travel time for public transports users reduced by 52%.
• Constructed 11.5 km of bus lane.
• Improved or upgraded 3,200 meters of pedestrian access facilities.
• Transport user accidents reduced by 94%.
PROJEC t-B y-PROJEC t REPOR ting | g REE n BO n D s | Cl EA n tRA ns POR tAti O n 115
Project Closed Project Closed in FY20 Active Project COVID-19 Project
GHG emissions reduced/ avoided /c Other Results /d Committed US$ mil /e IBRD share /f Allocated US$ mil /g
660.0 67% 493.1
116.0 51% 17.7
40.7 37% 0.1 Total Allocated for Clean Transportation 4571.8 3,711.5 Cumulative Loan Repayments (216.1) Total Allocated and Outstanding for Clean Transportation 3,495.4
Water and Wastewater Management
61 Federal Integrated Water Sector (P112073 | FY12): improve water resource management including assessing how climate change impacts water availability, and improve coordination and capacity of key federal institutions in the water sector.
62 Bengbu Integrated Environment Improvement (P096925 | FY08): improve effectiveness and resilience of urban water supply, treatment services and flood prevention and control systems through improved infrastructure and watershed management.
63 Water Conservation II (P114138 | FY12): improve agriculture water management and increase agriculture water productivity.
64 Xining Flood and Watershed Management (P101829 | FY09): improve sustainable utilization of land and water resources by improved flood control management, wastewater collection and treatment, and watershed management.
65 Emergency Recovery and Disaster Risk Management (P109932 | FY08, FY12): provide infrastructure recovery and strengthen risk management capacity in tropical storm affected areas.
Republic
THE WORLD BANK SUSTAINABLE DEVELOPMENT BONDS & GREEN BONDS | IMPACT REPORT 2020 116
# Link to More Information Project Name (Number
Year/s Loans Approved) and Description Country A/M /a Project Life Annual water savings Annual amount of wastewater treated/ reused/ avoided
|
Brazil A 30 ~ ~
China A 25 Industrial Wastewater Treatment Plant (WWTP) of 20,000 m³/day and Water Treatment Plant (WTP) of 30,000 m³/day.
China A 30 • 22.67 million m³ reduction in water withdrawal.
16.52 million m³ reduction in groundwater overdraft.
5.80 million m³ reduction in groundwater withdrawal. N/A
•
•
China A 30 ~ 4,825,000 tons of
untreated wastewater flowing into rivers avoided annually.
Dominican
A 30
Target Results /b
• 14 water resources management institutions supported by the project.
• Increased water use efficiency and proper management of solid waste.
• Improved quality of water service in both urban and rural areas.
Updated for actual results at project completion.
• 85.5% flood protection of Bengbu’s city land area (131.84 km of storm drainage networks built or upgraded).
• Pollution reduction reached 13%.
• 3 months of water supply reserves.
• 764,300 residents benefiting from secured water supply during dry season.
• 6 storm water drainage pumping stations (with total capacity of 240 m³/s) built.
• 9.2 km of sewer interceptors and secondary sewer collection network built.
• 60 km of wastewater networks completed.
• 2,690 tons per year of COD pollution reduction.
• 90% of wastewater collected and treated increased. Updated for actual results at project completion.
• 15% increase in main crop yields (507,850 metric tons of total yield of main food crops).
• RMB 200 increase in per capita annual agricultural income.
• Reverse the trend of declining water table in groundwater irrigated areas.
• Increase by 0.40kg/m³ in agricultural water productivity.
• 59,420 water users and 59,849 ha provided with new/ improved irrigation and drainage services.
Updated for actual results at project completion.
N/A N/A
• 1,127,000 tons of soil loss avoided annually.
• 434,440 people benefit from reduced vulnerability to flood events.
• 36.22 km2 protected from flooding.
• 87 km of wastewater collection networks built or upgraded.
Updated for actual results at project completion.
• 37,218 ha of damaged irrigation rebuilt.
• 152 km transmission lines restored to “disaster-resistant” standards.
• Santiago waste water operation restored.
• 252 MW of damaged hydropower facilities restored and dam safety standards improved.
Updated for actual results at project completion.
PROJEC t-B y-PROJEC t REPOR ting | g REE n BO n D s | WAt ER A n D WA st EWAt ER M A n A g EME nt 117
Project
Project Closed
Closed in FY20 Active Project COVID-19 Project
Annual amount of raw/untreated sewage sludge treated & disposed of Annual amount of sludge that is reused Other Results /c Committed US$ mil /d IBRD share /e Allocated US$ mil /f
~ ~
16.4 75% 16.4
99.9 45% 99.9 N/A
N/A
76.7 50% 76.7
100.0 53% 100.0
N/A N/A
99.9 100% 99.9
Water and Wastewater Management
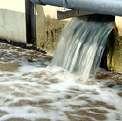
66 Andhra Pradesh Water Sector Improvement (P100954 | FY10): improve irrigation services on a sustainable basis and strengthen the State’s institutional capacity for multisectoral development and of its water resources.
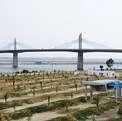
67 Water Resources and Irrigation Management Program 2 (P114348 | FY11): improve infrastructure and government capacity for river basin water resource and irrigation management.
68 Second Water Sector Investment (P095847 | FY09): promote better water management through efficiency improvements in irrigation and increased capacity for watershed management.
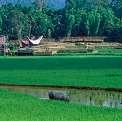
69 Emergency Water Security and Efficiency (P160911 | FY17): to improve availability of water supply in drought vulnerable areas, increase the efficiency of Water Utilities Corporation, and strengthen wastewater management in selected systems.
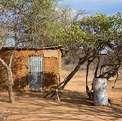
70 Espirito Santo Integrated Sustainable Water Management Project (P130682 | FY14): improve sustainable water resources management and increase access to sanitation.
THE WORLD BANK SUSTAINABLE DEVELOPMENT BONDS & GREEN BONDS | IMPACT REPORT 2020 118
# Link to More Information Project Name (Number | Year/s Loans Approved) and Description Country A/M /a Project Life Annual water savings Annual amount of wastewater treated/ reused/ avoided
India A 30 ~ ~
Indonesia A 25 N/A N/A
Tunisia A 30
Botswana A 20 2,620 m³ of additional wastewater
day
treated per
(956,000 annual).
Brazil Both 25 ~ ~
Target Results /b
~ ~
• Improved irrigation service delivery on a sustainable basis.
• Increased cropping intensity, crop diversity, and productivity of crops, livestock, and fish.
• 788,459 ha provided with new irrigation or drainage services.
• 425,992 water users provided with new/improved irrigation and drainage services. Updated for actual results at project completion.
• Increased crop productivity by providing more efficient and reliable irrigation water.
• 500,000 farmer households from provinces involving 12 river basins benefited.
• 5.1 million people benefiting from the project.
• 395,450 ha provided with new irrigation or drainage services.
• 19,395,000 Rp of losses avoided per year from RIM (river improvement management) activities. Updated for actual results at project completion.
• 24,436 ha rehabilitated with irrigation and drainage systems at closing.
• 21,128 households supplied with new drinking water.
• 21,602 ha provided with drainage systems. Updated for actual results at project completion.
85% of average annual COD removal efficiency from wastewater at WWTP.
• 580,000 direct project beneficiaries.
• 14,500 m³ of additional water made available per day.
• 39,500 m³ of water delivered to consumers per day.
• 75,000 piped household water connections that are benefiting from rehabilitation.
1,590 tons of BOD removed a year. ~
• 2.6 million people benefit.
• 70% of State with disaster warning system.
• 32,897 new household sewer connections.
• 164,000 people with improved sanitation.
• 2,000 ha reforested.
PROJEC t-B y-PROJEC t REPOR ting | g REE n BO n D s | WAt ER A n D WA st EWAt ER M A n A g EME nt 119
Project Closed Project Closed in FY20
Active Project COVID-19 Project
Annual amount of raw/untreated sewage sludge treated & disposed of Annual amount of sludge that is reused Other Results /c Committed US$ mil /d IBRD share /e Allocated US$ mil /f
399.2 46% 399.2
N/A N/A
119.3 74% 119.3 N/A
N/A
16.3 19% 16.3
145.5 91% 13.8
81.1 70% 13.4
Water and Wastewater Management
71 Atal Bhujal Yojana - National Groundwater Management Improvement (P158119 | FY18): improve the management of groundwater resources in the selected states.
72 Lake Qaraoun Pollution Prevention (P147854 | FY16): reduce the quantity of untreated municipal sewage discharged into the Litani River and address pollution around Qaraoun Lake.
73 Can Tho Urban Development and Resilience (P152851 | FY16): reduce flood risk in the urban core area, improve its connectivity to new urban growth areas, and improve the city’s capacity to manage disaster risk.
Notes:
N/A – Indicator is not applicable for this project.
~ – Indicator is not measured/reported for this project. Amounts may not add up due to rounding.
/a Column indicates whether the project aims to mitigate climate change (“M”), help client countries adapt to the effects of climate change (“A”), or both.
/b Target results are expected impacts based on estimates developed at the time of project approval and materializing at the end of the project implementation period (5 years in most cases). The indicators shown are normally a subset of the development impacts contained in project documentation available in the World Bank project website (http://www.worldbank.org/projects). Results reported are based on the entire project, with the percent shown next to the loan amount corresponding to the proportion of the total financing that is financed by World Bank loans. Actual impacts may be different from these estimates and do not represent the actual results in a specific year. Quantitative estimates are intended to be indicative of the scale of impacts and qualitative results aim to inform about the nature of changes that will be achieved as a result of projects included in the Green Bond program once they are completed and at full capacity.
/c For closed projects, “Project Completed” refers to a closed project for which its Implementation Completion Report (ICR) is not available yet. “Updated for actual results at project completion” refers to a closed project where ICR is available.
/d The committed amount is the Green Bond eligible portion of the World Bank loan net of cancellations reported in equivalent US$ millions. Loans denominated in other currencies are converted to US$ equivalents using the spot exchange rate on the report date (June 30, 2020).
/e The percentage shows the share of the total financing that is provided by World Bank loans. When a project is co-financed, this share could be used to apportion total results to the World Bank.
/f The allocated amount is the amount of Green Bond proceeds allocated to support the financing of disbursements to the project reported in equivalent US$ millions. Loans denominated in other currencies are converted to US$ equivalents using the spot exchange rate on the report date (June 30, 2020).
* indicates that the information has been updated in the FY20 Green Bond Impact Report.
THE WORLD BANK SUSTAINABLE DEVELOPMENT BONDS & GREEN BONDS | IMPACT REPORT 2020 120
# Link to More Information Project Name (Number | Year/s Loans Approved) and Description Country A/M /a Project Life Annual water savings Annual amount of wastewater treated/ reused/ avoided
India Both 24 ~ ~
Lebanon A 14 ~ 30,000 m³ of municipal wastewater collected and treated daily.
Vietnam A 29 N/A N/A
Target Results /b
• 7 States with improved groundwater monitoring and disclosure of groundwater data.
• 80 blocks with arrest in the rate of decline of groundwater levels.
• 15,000,000 program beneficiaries relying on sustainable groundwater resources for prosperity and health.
• 200,000 ha with reduction in water consumption (of which 160,000 ha provided with new/improved irrigation and drainage services.
• 5.6 million tons of CO₂ eq. emissions avoided annually due to reduced groundwater pumping.
~
1,250 m³ of trash removed from river banks.
• 50% reduction in pollutant load (nitrogen) to waterways.
• 344,000 of direct beneficiaries.
• 7,300 new household sewer connections.
• 200 km of sewer network constructed in the project area.
• 2,675 ha in urban core land area protected from floods.
• 25-30% reduction in travel time between urban core and Cai Rang center.
• 420,000 people as direct beneficiaries in which 24,000 are from ethnic minorities and 216,000 are female.
• 12 km of new and upgraded sewers/pipe installed.
PROJEC t-B y-PROJEC t REPOR ting | g REE n BO n D s | WAt ER A n D WA st EWAt ER M A n A g EME nt 121
Project Closed Project Closed in FY20 Active Project COVID-19 Project
Annual amount of raw/untreated sewage sludge treated & disposed of Annual amount of sludge that is reused Other Results /c Committed US$ mil /d IBRD share /e Allocated US$ mil /f N/A N/A
450.0 45% 1.1
55.0 92% 7.8 N/A N/A
125.0 39% 10.2 Total Allocated for Water, Wastewater, and Waste Management 1,784.4 974.1 Cumulative Loan Repayments (149.0) Total Allocated and Outstanding for Water and Wastewater Management 825.1
Solid Waste Management
74 Integrated Solid Waste & Carbon Finance (P106702 | FY11): improve treatment and final disposal of municipal solid waste and reduce methane emissions.
75 Solid Waste Sector DPL (P104937 | FY09): enhance the governance of the solid waste sector.
Brazil M 19 9,000 tons per day of waste disposed in environmentally sustainable sanitary landfills.
Morocco M 26 N/A
Notes:
N/A – Indicator is not applicable for this project.
~ – Indicator is not measured/reported for this project.
Amounts may not add up due to rounding.
/a Column indicates whether the project aims to mitigate climate change (“M”), help client countries adapt to the effects of climate change (“A”), or both.
/b Target results are expected impacts based on estimates developed at the time of project approval and materializing at the end of the project implementation period (5 years in most cases). The indicators shown are normally a subset of the development impacts contained in project documentation available in the World Bank project website (http://www.worldbank.org/projects). Results reported are based on the entire project, with the percent shown next to the loan amount corresponding to the proportion of the total financing that is financed by World Bank loans. Actual impacts may be different from these estimates and do not represent the actual results in a specific year. Quantitative estimates are intended to be indicative of the scale of impacts and qualitative results aim to inform about the nature of changes that will be achieved as a result of projects included in the Green Bond program once they are completed and at full capacity.
/c Annual GHG Emissions avoided are calculated by the project’s lifetime when possible (otherwise calculated based on the project’s implementation period).
/d For closed projects, “Project Completed” refers to a closed project for which its Implementation Completion Report (ICR) is not available yet. “Updated for actual results at project completion” refers to a closed project where ICR is available.
/e The committed amount is the Green Bond eligible portion of the World Bank loan net of cancellations reported in equivalent US$ millions. Loans denominated in other currencies are converted to US$ equivalents using the spot exchange rate on the report date (June 30, 2020).
/f The percentage shows the share of the total financing that is provided by World Bank loans. When a project is co-financed, this share could be used to apportion total results to the World Bank.
/g The allocated amount is the amount of Green Bond proceeds allocated to support the financing of disbursements to the project reported in equivalent US$ millions. Loans denominated in other currencies are converted to US$ equivalents using the spot exchange rate on the report date (June 30, 2020).
* indicates that the information has been updated in the FY20 Green Bond Impact Report.
THE WORLD BANK SUSTAINABLE DEVELOPMENT BONDS & GREEN BONDS | IMPACT REPORT 2020 122
(Number
and
Country A/M /a Project Life Waste Prevented, Minimized, Reused Or Recycled
# Link to More Information Project Name
| Year/s Loans Approved)
Description
PROJEC t-B y-PROJEC t REPOR ting | g REE n BO n D s | sO li D WA st E M A n A g EME nt 123
Active
Annual GHG Emissions Reduced /c Other Results /d Committed US$ mil /e IBRD share /f Allocated US$ mil /g • 3 dumps closed. • 7 municipalities made investments to improve recycling and composting activities. Updated for actual results at project completion. 16.7 31% 16.7 N/A • 24,436 ha rehabilitated with irrigation and drainage systems. • 21,128 households supplied with new drinking water. Updated for actual results at project completion. 112.1 100% 112.1 Total Allocated for Solid Waste Management 128.8 128.8 Cumulative Loan Repayments (23.4) Total Allocated and Outstanding for Solid Waste Management 105.4
Project Closed Project Closed in FY20
Project COVID-19 Project Target Results /b
Biodiversity
76
Forest Fire Response (P123923 | FY13): improve forest fire prevention and management and to enhance sustainable forest management.

77
Second Community Agriculture Resource Management and Competitiveness Project (P133705 | FY14): improve pasturebased livestock management in targeted alpine grasslands areas.
78 Belarus Forestry Development Project - Additional Financing (P165121 | FY18): enhance silvicultural management and reforestation and afforestation, increase the use of felling residues and improve the public good contribution from forests in targeted forest areas.
79 Hebei Rural Renewable Energy Development Project (P132873 | FY15): demonstrate sustainable biogas production and utilization to reduce environmental pollution and supply clean energy.
Armenia A 25 110,000 ha of land managed with sustainable practices.
Belarus A 30
3,273,300 ha of new areas managed as biodiversity-friendly.
80
Coral Reef Rehabilitation and Management Program-Coral Triangle Initiative (P127813 | FY14): protect and sustainably manage unique coral ecosystems in selected districts and provinces.
Indonesia A 20 1.4 million ha of marine areas brought under biodiversity protection.
81
Rural Development (P132317 | FY15): improve the resilience of small-scale farmers and fishermen to climate change by helping them recover and increase income-generating activities and strengthening the conservation of coastal and marine resources.
Philippines A 30
THE WORLD BANK SUSTAINABLE DEVELOPMENT BONDS & GREEN BONDS | IMPACT REPORT 2020 124
# Link to More Information Project Name (Number | Year/s Loans Approved) and Description Country A/M /a Project Life Area under Sustainable Management Practices
Russian Federation Both 18 ~
China M 25 N/A
Project Closed Project Closed in FY20
Active Project COVID-19 Project
Target Results /b
4,976,559 tons of CO₂ eq. emissions avoided every year over 20 years.
N/A
• 84% of fires contained within 24 hours following detection in project PAs (Protected Areas).
• 5 ha of fires at detection in project PAs.
• 13 Protected Area fire brigades equipped and trained. Updated for actual results at project completion.
• At least 10,000 pasture users benefit through their membership in Pasture Users’ Cooperatives.
Increase by 262,281 metric tons of CO₂ eq. avoided annually, based on project ’s lifetime.
• 6 nursery lines for container grown seedings of native tree species established with a production of 23.7 million seedlings per year.
• 757 people trained.
• 35,500 direct project beneficiaries.
58,780 tons of CO₂ emissions reduced annually (by 2020).
By 2020:
• 42,000,000 m³ of biogas used annually. 96,100 rural resident households with access to biogas supply.
• Additional biogas used as fuel for public transportation.
• 221,700 tons and 241,600 tons of, respectively, crop residues and livestock manure treated by the project each year.
• Reduce destructive fishing in selected areas.
• 1,140 direct beneficiaries in fishing communities.
• Increase incomes of about 1.9 million farmers and fishermen and the value of their products.
• Average travel time from farm to markets reduced by 30% through 1,265 km of new roads.
PROJEC t-B y-PROJEC t REPOR ting | g REE n BO n D s | Bi OD i VER sity 125
GHG emissions reduced/ avoided /c Other Results /d Biodiversity component share /e Committed US$ mil /f IBRD share /g Allocated US$ mil /h
12% 14.3 33% 14.3
26% 23.0 54% 11.3
100% 13.4 25% 5.0
11% 71.5 47% 47.8 N/A
37% 3.8 89% 2.7 N/A
6% 412.3 75% 331.7
Biodiversity
82 Third South West Indian Ocean Fisheries Governance and Shared Growth Project (SWIOFish3) (P155642 | FY18): improve management of marine areas and fisheries in targeted zones and strengthen fisheries value chains in the Seychelles.
83 Sustainable Management of Natural Resources and Climate Change (P124181 | FY12): improve farm environmental management and reduce greenhouse gas emissions by promoting improved agriculture and livestock management.
Notes:
N/A – Indicator is not applicable for this project.
~ – Indicator is not measured/reported for this project. Amounts may not add up due to rounding.
/a Column indicates whether the project aims to mitigate climate change (“M”), help client countries adapt to the effects of climate change (“A”), or both.
/b Target results are expected impacts based on estimates developed at the time of project approval and materializing at the end of the project implementation period (5 years in most cases). The indicators shown are normally a subset of the development impacts contained in project documentation available in the World Bank project website (http://www.worldbank.org/projects). Results reported are based on the entire project, with the percent shown next to the loan amount corresponding to the proportion of the total financing that is financed by World Bank loans. Actual impacts may be different from these estimates and do not represent the actual results in a specific year. Quantitative estimates are intended to be indicative of the scale of impacts and qualitative results aim to inform about the nature of changes that will be achieved as a result of projects included in the Green Bond program once they are completed and at full capacity.
/c Annual GHG Emissions avoided are calculated by the project’s lifetime when possible (otherwise calculated based on the project’s implementation period).
/d For closed projects, “Project Completed” refers to a closed project for which its Implementation Completion Report (ICR) is not available yet. “Updated for actual results at project completion” refers to a closed project where ICR is available.
/e The biodiversity component share reflects the share of the total project investment that directly support biodiversity work.
/f The committed amount is the Green Bond eligible portion of the World Bank loan net of cancellations reported in equivalent US$ millions. Loans denominated in other currencies are converted to US$ equivalents using the spot exchange rate on the report date (June 30, 2020).
/g The percentage shows the share of the total financing that is provided by World Bank loans. When a project is co-financed, this share could be used to apportion total results to the World Bank.
/h The allocated amount is the amount of Green Bond proceeds allocated to support the financing of disbursements to the project reported in equivalent US$ millions. Loans denominated in other currencies are converted to US$ equivalents using the spot exchange rate on the report date (June 30, 2020).
* indicates that the information has been updated in the FY20 Green Bond Impact Report.
THE WORLD BANK SUSTAINABLE DEVELOPMENT BONDS & GREEN BONDS | IMPACT REPORT 2020 126
# Link to More Information Project Name (Number | Year/s Loans Approved) and Description Country A/M /a Project Life Area under Sustainable Management Practices
A 20 5,000,000
marine
areas.
Seychelles
ha of sustainable-use
protected
Uruguay Both 21
Project Closed Project Closed in FY20
Active Project COVID-19 Project
Target Results /b
N/A
• 44% increase in key demersal indicator species stable or rebuilding in the Mahé Plateau fisheries.
• 40% increase in by-catch landed and sold in the Seychelles resulting in expansion of value chains, job creation and increased revenues in the country.
• Improve water use in irrigation and livestock production systems.
• Improve pasture management and other productivity measures.
• 4,000 family and medium-sized farmers benefitting from the project and 7,500 additional farmers provided with training.
PROJEC t-B y-PROJEC t REPOR ting | g REE n BO n D s | Bi OD i VER sity 127
GHG emissions reduced/ avoided /c Other Results /d Biodiversity component share /e Committed US$ mil /f IBRD share /g Allocated US$ mil /h
25% 4.3 43% 1.4
11% 49.0 89% 49.0 Total Allocated for Biodiversity 591.6 463.3 Cumulative Loan Repayments (9.8) Total Allocated and Outstanding for Biodiversity 453.5
Agriculture, Land Use, Forests, and Ecological Resources
THE WORLD BANK SUSTAINABLE DEVELOPMENT BONDS & GREEN BONDS | IMPACT REPORT 2020 128
# Link to More Information Project Name (Number | Year/s Loans Approved) and Description Country A/M /a Project Life 84 Integrated Forestry Development (P105872 | FY11): increase forest cover to create wind breaks, farmland shelter belts, and conservation schemes, and to train farmers in forest and environmental management. China Both 25 85 Hunan Forest Restoration and Development (P125021 | FY13): increase resilience of forests. China Both 26 86 Ningxia Desertification Control and Ecological Protection (P121289 | FY12): control desertification and land degradation by stabilizing moving sands, revegetating degraded steppe lands and planting shelter belts. China Both 30 87 Forests and Climate Change (P123760 | FY12): support rural communities' sustainable management of forests, and generate additional income from forest products and services and to reduce emissions from deforestation and forest degradation. Mexico Both 13 88 Fourth Northwest
Development
FY11):
Tunisia A 21 89 Guangdong Agricultural
China M 25 90 Integrated Modern
FY14):
China A 25
Mountainous and Forested Areas
(P119140 |
better protect and manage natural resources through conservation of soil and water resulting from improved agriculture and pasture practices and to improve access to potable water for rural communities.
Pollution Control (P127775 | FY14): promote waste management in livestock and crop production (including methane capture and use) and improve soil nutrient, fertilizer, and pesticide use.
Agriculture Development (P125496 |
develop sustainable and climate resilient agricultural production systems by investing in improved irrigation and drainage systems and practices that address climate risk.
Project Closed Project Closed in FY20
Target Results /b
Active Project COVID-19 Project
• 132,600 ha of forests restored or re/afforested: 93,840 ha of new multifaction plantations and 38,450 ha of improved existed plantations.
• 40% increase in vegetative cover plus improved species diversity in degraded forests rehabilitated.
• 324,000 farmers trained in forest management.
Updated for actual results at project completion.
• 61,987 ha of ecological forest plantation areas reforested and rehabilitated.
• 146,103 participants from 2,238 villages, including 8,858 forest farmers below the poverty line.
• 85% of participating farmer households considered the project ’s direct beneficiaries.
• 62,294 beneficiaries trained.
Updated for actual results at project completion.
• 32,351 ha restored or re/ afforested.
• 3,396 metric tons of soil loss caused by wind erosion, avoided every year.
Update for actual results at project completion.
• 92% increase in areas under improved forest management (equivalent to 3,935,984 additional ha).
• Support 2 pilot areas to reduce carbon emissions from deforestation and forest degradation.
• 2,622 communities applied for sustainable management and conservation schemes (not cumulative but reflecting yearly results and this figure reflects what has been achieved at project ’s completion).
• 265,632 project beneficiaries.
• *562,000 tons of CO₂ eq. per year of average reduction from deforestation and forest degradation. Updated for actual results at project completion.
• Reduce erosion and forest degradation: 10,517 ha of erosion-sensitive land protected with soil and water conservation works and infrastructure.
• Build climate change awareness and disseminate climate-appropriate practices to reinforce livelihood and agrosystem resilience: 39,500 ha of additional land under sustainable land and water management (at farm level).
• 12,927 ha of pasture upgraded and sustainably managed and 15,994 ha of trees planted.
• 371 water points constructed and rehabilitated benefitting more than 2,000 households.
• 181 km of newly constructed feeder roads and 815 km of rehabilitated roads.
• 318,000 people benefit.
Updated for actual results at project completion.
• 45,000 tons of annual pollution load to waterways reduced.
• 5,000 tons of annual nutrient load to waterways reduced.
• 28,000 ha with improved soil nutrient, fertilizer and pesticide use.
• 100 tons of total pesticide consumption reduced annually.
• 15,000 clients adopting an improved agricultural technology.
• Reduced water use per ton of rice, wheat and maize produced in target regions.
• 94,000 ha of farmland served with improved irrigation and drainage services.
• 38,500 ha of leveled land and improved soil conditions.
• 380,000 farm households beneficiaries in 33 counties/districts.
PROJEC t-B y-PROJEC t REPOR ting | g REE n BO n D s | Ag R i C ultu RE , lA n D u s E , F ORE sts, A n D E CO l O gi CA l R E s O u RCE s 129
Results /c Committed US$ mil /d IBRD share /e Allocated US$ mil /f
99.1 50% 99.1
80.0 69% 80.0
80.0 /g 70% 68.8
291.6 45% 291.6
29.6 73% 29.6
100.0 48% 67.1
200.0 64% 184.7
Agriculture, Land Use, Forests, and Ecological Resources
Maharashtra Project on Climate Resilient Agriculture (P160408 | FY18): enhance climate resilience and profitability of smallholder farming systems in selected districts of Maharashtra.
92 Meghalaya Community-led Landscapes Management Project (P157836 | FY18): strengthen community-led landscapes management in selected landscapes in the state of Meghalaya.
93 Tamil Nadu Irrigated Agriculture Modernization Project (P158522 | FY18): enhance productivity and climate resilience of irrigated agriculture, improve water management, and increase market opportunities for farmers and agroentrepreneurs in selected sub-basin areas of Tamil Nadu.
94 Strategic Irrigation Modernization and Urgent Rehabilitation Project (P157585 | FY18): improve irrigation services and strengthen accountability of irrigation schemes management in selected areas.
95 Large Scale Irrigation Modernization (P150930 | FY16): expand agriculture through the adoption of irrigation techniques that make more efficient use of water resources, while building better ties between farmers and markets.
96 Additional Financing for Punjab Irrigated Agriculture Productivity Program Project (P157736 | FY18): improve the productivity of water use in irrigated agriculture through scaling up of key activities, and finance a new activity on postharvest processing and value addition.
97 Peru National Agriculture Innovation Program (P131013 | FY14): strengthen the national agricultural innovation system and integrate climate change criteria into project such as adaptive research, seed improvements and skills development, among others.
98 Turkey Irrigation Modernization (P158418 | FY19): improve irrigation delivery, through rehabilitation and modernization of distribution infrastructure in selected schemes, and through strengthening of capacity of Water Users Associations.
THE WORLD BANK SUSTAINABLE DEVELOPMENT BONDS & GREEN BONDS | IMPACT REPORT 2020 130
# Link to More Information Project Name (Number | Year/s Loans Approved) and Description Country A/M /a Project Life
India A 20
India A 10
91
India A 20
Indonesia A 30
Morocco A 25
Pakistan A 20
Peru A 10
Turkey Both 30
• 20% increase in water productivity at farm level: from 0.23 to 0.276 kg per m³.
• Annual reduction of 5,661,644 tCO₂eq.
• 1,320,000 farmers reached with agricultural assets or services.
• 624,000 ha provided with new/improved irrigation or drainage services.
• Improved availability for 83,900,000 m³ of surface water storage capacity for agriculture.
• 31,510 ha of land area under sustainable management practices.
• 12,585 ha of forest area brought under management plans.
• 400 villages provided with capacity-building package to support community-led natural resource management.
• At least 100,000 ultimate project beneficiaries.
• 175,419 net sequestration of CO₂ annually, based on the project economic life.
• 160,000 ha provided with improved irrigation or drainage services.
• Climate-resilient technologies promoted on 75,000 ha.
• 500,000 project beneficiaries.
• 100,000 ha under improved agronomic practices and 25,100 ha under improved fish production.
• Modernized 4,741 tank irrigation systems.
• 284,000 tCO₂eq. avoided annually.
• 276,000 ha provided with new/improved irrigation or drainage services.
• Reduced net annual average emissions by 439,743 tons of CO₂ eq.
• Increase by 20% crop intensity.
• 300,000 farmer households provided with improved irrigation services.
• 9,274 farmers benefit.
• 100% of area with access to water on demand in peak period.
• 20,700 ha with improved irrigation technologies.
• 45% reduction in water losses for 11,550 watercourses improved and 120,000 acres covered by High Efficiency Irrigation System.
• Increased by 100% of improved agricultural practices.
• Avoided 381,377 tons of CO₂ eq. emissions annually.
• Increased by 30% in women benefitting.
• 20,000 small and medium farmers adopting new technologies.
• 61 new technologies demonstrated on farms.
• 450,000 potential farmers beneficiaries.
• 50,764 ha provided with new/improved irrigation or drainage services.
• 17,312 users provided with improved irrigation service.
• 15,911 tons of CO₂ eq. emissions avoided annually.
• 15% increase in irrigation efficiency.
• 1,521 km of modernized irrigation network.
• 80% of grievances addressed within stipulated timeframe.
PROJEC t-B y-PROJEC t REPOR ting | g REE n BO n D s | Ag R i C ultu RE , lA n D u s E , F ORE sts, A n D E CO l O gi CA l R E s O u RCE s 131
Committed US$ mil /d IBRD share /e Allocated US$ mil /f
Project Closed Project Closed in FY20 Active Project COVID-19 Project Target Results /b Results /c
420.0 70% 32.9
48.0 80% 3.0
318.0 70% 79.3
250.0 43% 6.0
150.0 80% 92.9
130.0 63% 33.8
13.0 31% 12.7
249.2 99% 11.3
Agriculture, Land Use, Forests, and Ecological Resources
99 Sustainable Management of Natural Resources and Climate Change (Additional Financing) (P163444 | FY18): support Uruguay ’s efforts to promote farmer adoption of climate smart agricultural and livestock practices and improved natural resource management practices in the project area.
Notes:
Amounts may not add up due to rounding.
/a Column indicates whether the project aims to mitigate climate change (“M”), help client countries adapt to the effects of climate change (“A”), or both.
/b Target results are expected impacts based on estimates developed at the time of project approval and materializing at the end of the project implementation period (5 years in most cases). The indicators shown are normally a subset of the development impacts contained in project documentation available in the World Bank project website (http://www.worldbank.org/projects). Results reported are based on the entire project, with the percent shown next to the loan amount corresponding to the proportion of the total financing that is financed by World Bank loans. Actual impacts may be different from these estimates and do not represent the actual results in a specific year. Quantitative estimates are intended to be indicative of the scale of impacts and qualitative results aim to inform about the nature of changes that will be achieved as a result of projects included in the Green Bond program once they are completed and at full capacity.
/c For closed projects, “Project Completed” refers to a closed project for which its Implementation Completion Report (ICR) is not available yet. “Updated for actual results at project completion” refers to a closed project where ICR is available.
/d The committed amount is the Green Bond eligible portion of the World Bank loan net of cancellations reported in equivalent US$ millions. Loans denominated in other currencies are converted to US$ equivalents using the spot exchange rate on the report date (June 30, 2020).
/e The percentage shows the share of the total financing that is provided by World Bank loans. When a project is co-financed, this share could be used to apportion total results to the World Bank.
/f The allocated amount is the amount of Green Bond proceeds allocated to support the financing of disbursements to the project reported in equivalent US$ millions. Loans denominated in other currencies are converted to US$ equivalents using the spot exchange rate on the report date (June 30, 2020).
g/ The committed amount has been reduced due to a portion of the loan cancelled after the project’s closing date.
* indicates that the information has been updated in the FY20 Green Bond Impact Report.
THE WORLD BANK SUSTAINABLE DEVELOPMENT BONDS & GREEN BONDS | IMPACT REPORT 2020 132
# Link to More Information Project Name (Number | Year/s Loans Approved) and Description Country A/M /a Project Life
Uruguay Both 21
• 8,000 people trained under the project, 2,000 of which are women.
• 7,000 farmers adopting innovative agricultural technology.
• 3,600,000 ha under sustainable landscape management practices.
• 3,500 ha provided with new/improved irrigation or drainage services.
PROJEC t-B y-PROJEC t REPOR ting | g REE n BO n D s | Ag R i C ultu RE , lA n D u s E , F ORE sts, A n D E CO l O gi CA l R E s O u RCE s 133
Project
Active Project COVID-19 Project Target Results /b Results /c Committed US$ mil /d IBRD share /e Allocated US$ mil /f
Project Closed
Closed in FY20
42.0 89% 8.7 Total Allocated for Agriculture, Land Use, Forests, & Ecological Resources 2,500.4 1,101.6 Cumulative Loan Repayments (30.8) Total Allocated and Outstanding for Agriculture, Land Use, Forests and Ecological Resources 1,070.8
Resilient Infrastructure, Built Environment, and Other
River Basin Flood Management and Drainage Improvement (P098078 | FY11): increase resilience of communities to the impacts of climate change, particularly flooding.
101 Second Sustainable Development and Green Growth DPL (P161642 | FY18): support green growth in transport, energy, environmental health and natural resources to improve environmental quality through reducing PM 2.5 in the air, strengthening regulations for sanitation, increasing capacity to reuse and disposing solid waste.
Change Development Policy Loan (P110849 | FY08): mainstream
103 South East Europe and Caucasus Catastrophe Risk Insurance Facility (P110910 | FY11): increase access to catastrophe risk insurance through facilitating the growth of insurance markets.
Serbia
104 Climate Resilient Infrastructure (P127338 | FY15): enhance the resilience of road infrastructure against flood risks and the impacts of climate change.
105
Disaster Risk Management Development Policy Financing with Cat DDO (P160628 | FY19): strengthen the institutional and legal framework to ensure risk-informed sectoral and territorial planning; and increase the financial capacity to manage impacts associated with disaster and climate-related shocks.
Fujian Fishing Ports Project (P129791 | FY14): reduce the vulnerability of fishing communities to extreme weather events.
DRM Development Policy Loan with a Cat DDO (P159351 | FY18): support the Government of the Dominican Republic in strengthening institutions for improved climate and disaster resilience in priority sectors; and establishing mandatory regulations for climate and disaster risk reduction in public investment and construction works.
THE WORLD BANK SUSTAINABLE DEVELOPMENT BONDS & GREEN BONDS | IMPACT REPORT 2020 134
# Link to More Information Project Name (Number | Year/s Loans Approved) and Description Country A/M /a Project Life 100 Huai
China A 25
Colombia M 24 102 Climate
climate
Mexico Both 10
North Macedonia &
A 22
Belize A 25
change considerations into public policy.
Cabo Verde A 28
106
China A 27
107
Dominican Republic A 31
Results /c
Target Results /b
• 9,682 km 2 of flood protection (in rural and urban areas).
• 7,430,000 people benefited.
• RMB 798 million of reduced economic losses (in rural and urban areas).
• 444 km of dike strengthened.
• 1,023 km of river improvements.
Updated for actual results at project completion.
• 31% of passenger journeys done in public and non-motorized transport in 8 cities (Barranquilla, Bucaramanga, Medellín, Bogotá-Soacha, Cali, Cartagena, Pasto, and Montería).
• 24.4% reduction in the mean annual concentration of PM 2.5 in 7 monitoring stations in the cities of Medellín, Itagüí, and Bogotá (488% achieved).
• 19,837 people benefitting from non-conventional energy projects commissioned in areas not covered by the national interconnected system (235% achieved).
• 8,526,403 people provided with access to improved water sources (only in rural areas).
Updated for actual results at project completion.
• 642,000 ha reforested.
• 6,000,000 tons of CO₂ eq. emissions reduced annually due to reforestation.
• Domestic carbon pricing strategy developed.
• 10 cities and 5 states climate action plans developed.
Updated for actual results at project completion.
• Increased catastrophe insurance coverage from 2% to 10% for homeowners, farmers, enterprises, and government entities holding catastrophe insurance policies.
• 6-7 different types of highly affordable catastrophic insurance products provided by local insurance companies to homeowners, farmers and local governments.
Updated for actual results at project completion.
• 30 km of roads rehabilitated and 12 bridges and culverts improved.
• 50% reduction in road interruption due to flooding.
• 170,000 people living near the road networks directly benefit.
• 56% of Integrated Touristic Areas have Tourist Development Plans that incorporate disaster and climate-related risk management considerations.
Allocation to the National Emergency Fund included annually in national budget (for 2019, 2020, 2021 and 2022 budget).
All 22 new municipal plans incorporate climate-related risk management considerations.
• 11,000 fishermen and their families (total 64,000 people) benefit.
• 3,000 fishing vessels protected in ports.
• Improved effectiveness of early warning and emergency systems.
• 15% of public schools assessed for disaster risk (of 6,500 of total schools).
• 30% of public schools assessed for disaster risk and requiring an intervention are rehabilitated and/or retrofitted.
• 50 out of the 140 identified risk-prone areas (35% of total) in main watershed basins have been prioritized, by hydrological and hydrometeorological studies, to undergo improvements in water management.
• 25 out of 164 health facilities have been given an operating permit following the approval of technical regulations assessed using the Hospital Safety Index.
• 80% construction works with a building permit have been supervised and inspected following updated regulations.
PROJEC t-B y-PROJEC t REPOR ting | g REE n BO n D s | R E sili E nt i n FRA st R u C tu RE , Built En V i RO n ME nt, A n D Ot HER 135
Project Closed Project Closed in FY20 Active Project COVID-19 Project
Committed US$ mil /d "IBRD share /e Allocated US$ mil /f
200.0 33% 200.0
500.0 100% 500.0
** ** **
10.0 100% 10.0
30.0 100% 8.4
5.0 50% 5.0
60.0 58% 7.2
150.0 100% 150.0
Resilient Infrastructure, Built Environment, and Other
/a Column indicates whether the project aims to mitigate climate change (“M”), help client countries adapt to the effects of climate change (“A”), or both.
/b Target results are expected impacts based on estimates developed at the time of project approval and materializing at the end of the project implementation period (5 years in most cases). The indicators shown are normally a subset of the development impacts contained in project documentation available in the World Bank project website (http://www.worldbank.org/projects). Results reported are based on the entire project, with the percent shown next to the loan amount corresponding to the proportion of the total financing that is financed by World Bank loans. Actual impacts may be different from these estimates and do not represent the actual results in a specific year. Quantitative estimates are intended to be indicative of the scale of impacts and qualitative results aim to inform about the nature of changes that will be achieved as a result of projects included in the Green Bond program once they are completed and at full capacity.
/c For closed projects, “Project Completed” refers to a closed project for which its Implementation Completion Report (ICR) is not available yet. “Updated for actual results at project completion” refers to a closed project where ICR is available.
/d The committed amount is the Green Bond eligible portion of the World Bank loan net of cancellations reported in equivalent US$ millions. Loans denominated in other currencies are converted to US$ equivalents using the spot exchange rate on the report date (June 30, 2020).
/e The percentage shows the share of the total financing that is provided by World Bank loans. When a project is co-financed, this share could be used to apportion total results to the World Bank.
/f The allocated amount is the amount of Green Bond proceeds allocated to support the financing of disbursements to the project reported in equivalent US$ millions. Loans denominated in other currencies are converted to US$ equivalents using the spot exchange rate on the report date (June 30, 2020).
* indicates that the information has been updated in the FY20 Green Bond Impact Report.
**The project Climate Change Development Policy Loan (P110849) was fully repaid and, therefore, removed from the commitments and allocations of the current green bond portfolio.
THE WORLD BANK SUSTAINABLE DEVELOPMENT BONDS & GREEN BONDS | IMPACT REPORT 2020 136
# Link to More Information Project Name (Number | Year/s Loans Approved) and Description Country A/M /a Project Life 108 Disaster Vulnerability Reduction (P146965 | FY16): enhance the country’s resilience to disaster and climate risk. Jamaica A 29 109 Disaster Risk Management Development Policy Loan with a Catastrophe Deferred Drawdown Option (P168580 | FY20): strengthen the country’s institutional capacity and institutional framework to deal with the adverse financial impacts and risk managements of disasters and climate-related shocks. Morocco A 28 110 Hydrometeorological Services Modernization (P127676 | FY14): enhance capacity to deliver reliable and timely weather, hydrological and climate information. Russian Federation A 18 111 Road Climate Resilience Project (P130975 | FY14): rehabilitate and improve the climate resilience of a road corridor. Timor-Leste A 28
Notes: Amounts may not add up due to rounding.
Target
• Protection of infrastructure (e.g., bridges, storm drains, roads) from floods directly benefitting about 247,000 people.
• Increase the government’s capacity to better prepare for and respond to natural disasters.
• Reduced to 0 the number of days of interrupted traffic due to flooding.
• 8,350 storm drains retrofitted/constructed and 140 bridges retrofitted.
• 313,000 direct project beneficiaries.
• 90% of local officials of the Ministry of interior responsible for the administration of the register trained on the registration procedures.
• The Government has deployed an online platform for the registration of people affected by a catastrophic event.
• The Government has developed a specific outreach and communication mechanism to inform the population of the registration procedures for people affected by a catastrophic event, with a specific focus on women.
• 4 provinces covered by an integrated flood risk management information system.
• >70% accuracy of forecasts for the main administrative centers of Russia.
• > 85-90% accuracy of seasonal river flow forecasts in Volga river basin reservoirs.
• Increased number of sectoral data users data.
• Improved drainage conditions along 110 km road corridor.
• 30% reduction in major road damage events.
PROJEC t-B y-PROJEC t REPOR ting | g REE n BO n D s | R E sili E nt i n FRA st R u C tu RE , Built En V i RO n ME nt, A n D Ot HER 137
Project Closed Project Closed in FY20 Active Project COVID-19 Project
Committed US$ mil /d "IBRD share /e Allocated US$ mil /f
Results /b Results /c
30.0 100% 12.1
282.2 100% 282.2
60.0 43% 42.9
15.0 16% 13.1 Total Allocated for Resilient Infrastructure, Built Environment, and Other 1,342.2 1231.0 Cumulative Loan Repayments (35.5) Total Allocated and Outstanding for Resilient Infrastructure, Built Environment and Other 1195.5
Project-Level Mapping to the SDGs


The figures in the body of the table below represent the number of targets per SDG that were mapped to the 100 new projects in the FY20 World Bank (IBRD) project portfolio. The frequency of mapping is also depicted by the intensity of the color, i.e., the darker the tone, the greater number of SDG targets matched to the project. This table was prepared by SEI in collaboration with the World Bank to develop methodologies for mapping projects to the SDGs to promote sustainable investment.

FY20
WORLD BANK PROJECT PORTFOLIO
Project/SDGs P160594 2 1 0 2 1 0 0 0 0 2 0 0 0 0 0 0 0 P166564 1 1 0 0 0 0 0 1 1 2 0 0 0 0 1 0 1 P169779 1 0 0 0 0 0 0 0 0 2 0 0 0 0 0 0 1 P168911 0 0 0 7 0 0 0 1 0 0 0 0 1 0 0 0 1 P173767 0 0 5 0 0 0 0 0 0 0 0 0 0 0 0 0 2 P170329 1 0 0 0 0 0 1 0 1 1 0 0 0 0 0 0 2 P169624 0 1 0 0 0 0 0 0 1 0 0 0 0 0 0 0 2 P164260 0 0 0 0 0 7 1 0 1 0 1 1 0 0 0 0 1 P167455 2 4 0 0 0 6 0 0 4 2 1 2 0 0 2 0 4 P164588 0 5 0 0 0 0 0 1 0 0 0 1 5 0 4 0 1 P165055 0 0 2 0 0 7 0 0 4 0 1 1 0 0 0 0 2 P165695 2 0 2 0 1 5 1 0 0 0 2 1 0 0 0 0 2 P160628 0 0 0 0 0 0 0 0 0 0 0 0 1 0 0 0 2 P158124 0 1 0 0 0 6 0 1 3 0 4 1 0 0 1 0 1 P162349 2 0 3 0 1 0 0 0 1 1 0 0 0 0 0 0 1 P158733 1 0 1 0 0 0 0 0 0 0 1 0 0 0 0 0 1 P163679 0 0 0 0 0 0 2 0 0 0 0 0 0 0 0 0 1 P156880 1 0 2 0 2 6 0 0 0 0 5 1 0 0 0 1 2 P170728 0 3 0 0 0 0 0 0 3 0 3 0 0 0 1 0 1 P162594 0 0 0 0 0 0 0 0 1 0 0 0 0 0 0 1 0 P159351 1 0 2 0 0 6 0 0 0 0 3 1 1 0 0 0 1 P167416 4 1 2 1 1 0 0 0 0 2 0 0 0 0 0 0 3 P173773 1 0 6 0 1 0 0 0 0 0 0 0 0 0 0 0 1 P171190 1 0 0 0 0 0 0 1 1 1 0 0 0 0 1 0 2 P162835 0 2 0 1 0 0 0 1 2 0 0 0 0 0 0 0 2 P166697 0 0 3 0 0 6 0 0 0 0 1 1 1 0 1 0 0 P173883 0 0 7 0 0 0 0 0 0 0 0 0 0 0 0 0 2 P166170 0 0 1 0 0 0 1 0 0 0 0 0 0 0 0 0 1 P173927 0 0 7 0 0 0 0 0 0 0 0 0 0 0 0 0 0 P173911 4 0 6 0 1 0 0 0 0 1 0 0 0 0 0 0 1 P169913 1 2 1 1 0 0 0 2 2 0 1 0 0 0 0 0 2 P169117 1 1 0 0 0 0 1 1 3 0 0 0 0 0 0 1 3 P168481 0 0 1 5 0 0 0 0 2 0 0 0 0 0 0 0 2 P159710 1 0 0 0 0 0 0 0 0 0 1 0 1 0 0 0 1 P158502 1 0 1 0 1 6 0 0 2 0 4 1 0 0 0 1 3 P165129 0 5 0 0 0 5 0 0 4 0 0 2 0 0 3 0 1 P163533 1 5 1 0 0 4 0 0 2 0 0 0 1 0 1 0 1 P157929 1 0 3 0 2 3 0 0 2 0 1 0 0 1 0 1 1 P168310 0 4 0 1 0 0 0 1 3 0 0 0 2 0 1 0 3 P166373 0 1 7 1 1 0 0 0 0 1 0 0 0 0 0 1 1 P166923 0 0 0 0 0 0 0 1 0 2 3 0 0 0 0 1 5 P167523 1 1 5 0 1 0 0 0 1 0 0 0 0 0 0 0 2 P173836 0 0 6 1 0 0 0 0 2 0 0 0 0 0 0 0 2 Key 1 2 3 4 5 6 7 Indicates Green Bond Project THE WORLD BANK SUSTAINABLE DEVELOPMENT BONDS & GREEN BONDS | IMPACT REPORT 2020 138
Project/SDGs P167581 0 0 5 0 0 1 0 0 2 0 1 0 0 0 0 0 0 P157141 0 0 1 0 0 0 0 0 1 0 4 0 0 0 0 0 2 P158119 0 0 0 0 0 6 0 0 0 0 1 1 0 0 0 0 0 P173943 3 0 2 0 0 0 0 0 0 1 0 0 0 0 0 0 0 P147864 1 0 2 0 1 0 0 0 0 0 1 0 0 0 0 0 0 P157245 0 0 0 0 0 6 0 0 2 0 5 2 0 2 0 0 3 P164686 1 3 5 1 0 0 0 0 0 2 0 0 0 0 0 0 1 P163896 0 0 1 0 0 0 0 0 2 0 3 0 0 0 1 0 3 P170940 1 1 0 0 0 0 0 1 2 0 0 0 1 0 1 0 2 P165543 1 0 0 0 1 0 0 0 0 0 0 0 0 0 0 0 3 P168076 0 0 0 3 0 0 0 0 0 0 0 0 0 0 0 0 1 P173994 0 0 4 0 0 0 0 0 0 0 0 0 0 0 0 0 0 P162454 0 0 0 0 0 0 3 0 3 0 0 0 0 0 0 0 3 P166279 0 4 1 0 0 0 0 0 4 0 0 0 1 0 1 0 5 P170223 2 1 0 0 0 0 0 1 0 1 1 0 1 0 1 0 2 P173972 0 0 6 0 0 0 0 0 0 0 0 0 0 0 0 0 2 P170669 1 0 0 1 0 0 0 1 1 1 0 0 0 0 0 0 2 P172321 0 6 0 0 0 0 0 0 0 0 1 0 0 0 0 0 1 P160224 0 0 1 0 0 0 0 0 1 0 4 0 0 0 0 0 1 P172863 0 0 1 0 0 0 0 1 2 0 0 0 0 0 0 0 1 P173799 0 2 6 0 0 0 0 0 0 0 0 0 0 0 0 0 2 P167619 1 0 0 4 1 0 0 0 0 1 0 0 0 0 0 1 2 P168147 1 0 0 0 1 1 0 0 0 1 1 0 0 0 0 1 3 P168580 0 0 0 0 0 0 0 1 0 0 0 0 1 0 0 0 2 P170267 1 1 2 0 1 0 0 0 2 0 1 0 0 0 0 0 1 P170343 1 0 0 0 0 0 0 1 0 1 0 0 0 0 0 0 1 P164704 0 0 0 0 1 7 1 1 2 0 1 1 0 0 0 0 2 P161402 0 1 0 0 0 1 0 0 2 0 4 1 0 0 0 0 4 P166732 0 0 1 0 0 0 0 0 1 0 4 0 0 0 0 0 2 P157575 1 0 4 3 0 6 0 0 1 1 2 1 0 0 1 0 3 P167996 0 1 7 0 0 0 0 0 0 1 0 0 0 0 0 1 0 P173805 0 0 5 0 0 0 0 0 0 0 0 0 0 0 0 0 2 P169505 1 1 0 0 0 0 0 1 0 0 0 0 0 0 2 0 0 P157043 1 0 0 0 1 7 0 0 0 0 1 1 0 0 0 0 0 P163255 0 0 7 0 0 0 0 0 1 0 0 0 0 0 0 0 0 P170052 1 5 0 0 0 0 0 0 0 0 1 0 5 0 0 0 1 P174120 3 0 2 0 0 0 0 0 1 1 0 0 0 0 0 0 1 P171440 1 0 0 0 0 0 0 0 0 1 1 0 1 0 0 0 1 P166302 1 1 1 0 0 0 0 0 2 0 1 0 5 0 0 0 2 P166303 0 1 0 0 0 0 0 0 0 0 0 0 5 0 0 0 0 P167634 0 4 0 0 0 0 0 1 2 0 0 0 0 0 1 0 3 P170185 0 2 0 0 0 0 0 2 2 1 0 0 0 0 0 0 2 P163673 0 0 0 0 0 0 0 0 1 0 0 0 0 0 0 0 1 P173867 2 0 7 0 0 1 0 0 2 0 1 0 0 0 0 1 2 P165973 0 2 1 0 0 4 0 0 1 0 1 0 2 0 2 0 0 P166187 1 4 0 0 1 0 0 0 1 1 0 0 0 0 0 1 2 P168425 1 0 3 4 0 0 0 0 2 2 0 0 0 0 0 1 2 P173945 0 0 4 0 0 0 0 0 0 0 0 0 0 0 0 0 2 P168273 0 0 0 0 0 0 3 0 0 0 0 0 0 0 0 0 1 P158418 0 2 0 0 0 3 2 0 4 0 0 0 0 0 1 0 1 P166941 0 7 0 0 0 0 0 0 1 0 0 0 0 0 2 0 2 P162929 0 0 0 0 0 2 0 0 1 0 6 0 0 0 0 0 1 P166305 0 4 0 0 0 0 0 2 2 0 0 0 0 0 0 0 2 P168280 1 2 0 0 0 0 0 0 0 2 0 0 0 0 0 0 0 P157715 0 0 1 0 0 0 0 0 1 0 0 0 0 0 0 0 1 P162043 0 1 1 0 0 0 0 0 1 0 0 0 0 0 0 0 0 P164486 0 1 0 0 0 0 0 0 2 0 0 0 0 0 0 0 0
Resources

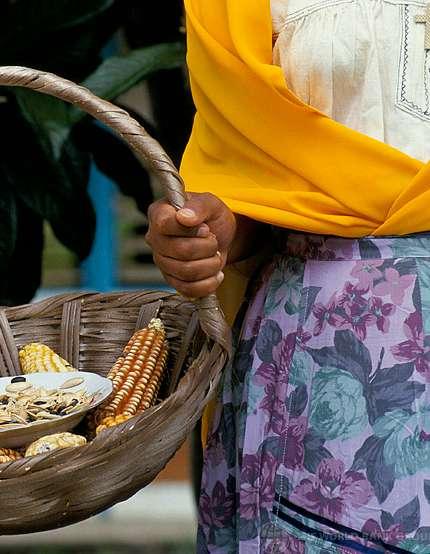 Photo credit: ©Curt Carnemark / World Bank
RESOURCES
Impact Reporting Approach
The intention of impact reporting is to help investors develop a more detailed understanding of the results from World Bank-financed projects eligible for funding through World Bank Sustainable Development Bonds and Green Bonds. Key results indicators have been selected and, where possible, quantified, but it is important to appreciate the inherent limitations of data reported. The main considerations to adequately interpret results for the SDB program and the Green Bond program are described below:
Sustainable Development Bonds
Results Indicators The indicators used in the projects tables of this report have been selected from among other expected development results and are intended to illustrate the type and scale of expected results in a variety of sectors and country contexts. The results indicators presented for aggregated Impact Highlights are drawn from the World Bank Corporate Scorecard, Tier 2 results and Corporate Results Indicators, which are sector outcome or output indicators that can be measured and monitored at the project level and aggregated across operations and countries. More information on the definition of each “Tier 2” indicator can be found at https://scorecard. worldbank.org/
for direct project effects. The project Impact Highlights in this report include selected results that are aggregated where possible and do not represent all countries or regions where the World Bank supports the financing of projects. Project Impact Highlights should not be considered a comprehensive accounting of results. Additional project results are presented in the Project-by-Project section of the report and the full set of project results can be found at http://projects.worldbank.org
portfolios because baselines (and base years) and calculation methods may vary significantly. In addition, the cost structures between countries will also vary, so that developing costefficiency calculations (such as results per dollar invested) could, for example, place smaller countries with limited economies of scale at a disadvantage and will not take into consideration country-specific context.
Omissions and Qualitative Results
Scope of Results
Unless otherwise indicated, reporting is based on ex-ante estimates of impacts at the time of project appraisal and mostly
Uncertainty An important consideration in estimating impact indicators and projecting results is that they are based on assumptions. While technical experts aim to make sound and conservative assumptions that are reasonable based on the information available at the time, the actual impact of the projects generally diverge from initial projections. In general, behavioral changes or shifts in baseline conditions can cause deviations from projections.
Comparability Caution should be taken in comparing projects, sectors, or whole project
Because the selected projects aim to provide social and developmental benefits as well as climate and environmental ones, they will have impacts across a much wider range of indicators than captured in the previous section. Therefore, exclusively focusing on the reported indicators will leave out other important development impacts. Where quantitative data is unavailable, qualitative indicators have been included to illustrate other beneficial impacts. The intention of impact reporting is to help investors develop a more detailed understanding of the results from World Bank-financed
THE WORLD BANK SUSTAINABLE DEVELOPMENT BONDS & GREEN BONDS | IMPACT REPORT 2020 142
projects. Several key results indicators have been selected and, where possible, quantified, but it is important to appreciate the inherent limitations of data reported.
Period of Inclusion in Report
Projects are added to the impact report in the fiscal year that loan disbursements have begun. Due to the size of the dataset, the detailed tables for projects added to the project portfolio in previous fiscal years are available on the World Bank Treasury website
Reporting for Co-Financed Projects
The World Bank often co-finances projects with the client country and/or other lenders. The results for the individual project are based on the total project including all financiers. The World Bank’s share of the total financing is included for each project.
Aggregations of GHG Estimates
When
reported
in the “Project Appraisal”, “Implementation Status and Results”, and/or “Implementation Completion and Results” reports, the GHG emission reductions for projects are reported in tons of CO₂ equivalent. The World Bank, in conjunction with other international finance institutions, developed a harmonized approach for GHG accounting. 21 At the same time, the World Bank developed internally consistent GHG accounting methodologies to track ex-ante gross and net emissions in investment projects
across relevant sectors and over their economic lifetime. Starting in FY19, the World Bank Group began reporting aggregated annual net GHG emissions reductions in the 2019 Corporate Scorecard. Given these recent developments in GHG accounting, the basis for estimating CO₂ equivalent emission reductions for projects approved prior to FY19 may vary.
All Reported Results are from Publicly Available Sources
Reporting is based on publicly available impacts for the projects disclosed in “Project Appraisal”, “Implementation Status and Results”, and “Implementation Completion and Results” reports. To facilitate comparability of the reported results, the reporting units have been converted where such conversion is based on a standard conversion factor. For a broader country context on developmental impacts of projects, view the full set of project documentation available on the World Bank website at http://projects.worldbank.org
Green Bonds
The World Bank issued its first Green Bond Impact Report in 2015 and impact reporting continues to evolve from year to year. The initial reporting template and set of indicators presented were the product of engagement with investors, which benefitted from the efforts of multilateral
development banks to harmonize metrics for GHG accounting and reporting on climate finance activities. The World Bank led a collaborative initiative with other issuers to create the first harmonized template with core indicators for the Renewable Energy and Energy Efficiency sectors that was published in March 2015. The template has since evolved and been adopted by many other issuers. This consultative process of developing harmonized impact reporting templates has advanced under the auspices of the Green Bond Principles and its working groups and continues to evolve to cover other indicators and relevant sectors.
The indicators for this report have been selected among other expected development results and are intended to illustrate the type and scale of expected results in a variety of sectors and country contexts. To better reflect individual country challenges, demands, and resources, the report focuses on presenting a diverse set of countries, projects and sectors rather than cumulative impacts. Because of the limited comparability between projects, sectors and countries impact results are aggregated where possible, such as with regard to “annual energy savings”, “annual energy produced” and “renewable energy capacity added”, which are deemed to be broadly comparable.
21 See the Joint Report on Multilateral Development Banks’ Climate Finance at https://thedocs.worldbank.org/en/ doc/084c1cd630c4a9d3fb5a6d6553443c86-0340022021/original/Joint-Report-on-MDBs-Climate-Finance-2019.pdf RE s O u RCE s | iMPAC t R EPOR ting APPROACH 143
World Bank Green Bond
Eligible Projects This impact report is organized according to the sectors represented in the World Bank’s Green Bond eligible projects portfolio. Where projects cover multiple sectors, the project is included in the main sector only, but target results will include all components of the project.
Renewable Energy and Energy Efficiency
Clean Transportation
Water and Wastewater Management
Solid Waste Management
Biodiversity
Agriculture, Land Use, Forests and Ecological Resources
Resilient Infrastructure, Build Environment and Other
The reporting framework adopted identifies core indicators in the following sectors: (1) Renewable Energy and Energy Efficiency; (2) Clean Transportation; (3) Water and Wastewater; (4) Solid Waste Management; (5) Biodiversity. Where information covering the proposed core indicators is publicly available, it is included. However, for some projects quantitative estimates for these
indicators are either not available or not applicable. A few other indicators that are considered relevant for green bond investors are also provided. The World Bank uses the Handbook: Harmonized Framework for Impact Reporting22 published by ICMA and related templates in its impact report. These templates, organized by sector, are designed for harmonization of impact reporting and the proposed indicators may not fully reflect the purpose of the World Bank-financed projects in the sectors presented above. It is important to view the “other indicators” offered. Moreover, as the consultative process for developing harmonized impact reporting templates advances, the core indicators might be subject to changes. Projects categorized in the remaining sectors are more heterogeneous. The report provides project specific indicators based on available information on the scale of results.
Key Assumptions and Approach
The following key assumptions. The following key assumptions and approach were used in preparing this report.
Ex-Ante Projections: Quantitative estimates for target results represent ex-ante projections developed during project design mostly for direct project impacts once projects are at normal operating capacity. The target results include
expected results for projects approved by the Board but still in the implementation phase. The impact report thus serves as an illustration of expected results made possible through Green Bond eligible projects, but it is not intended to and does not provide actual results achieved in a specific year or reporting period. Target results have been updated with actual results at project completion. Where the amounts are based on actual results this is noted in the preceding tables.
Period of Inclusion in the Report: Impact reporting will be provided for projects for so long as they are part of the World Bank Green Bond project portfolio. This means that projects are added to the impact report once Green Bond proceeds have been allocated to support the financing of disbursements to the project and removed once the client has repaid the respective loan. Projects may also be removed from future reports if the World Bank decides to remove a project from its Green Bond project portfolio. 23 In the latter case, any Green Bond proceeds previously allocated to support the financing of disbursements to that project will be credited back to the Special Account for Green Bond proceeds and allocated to support the financing of disbursements to other Green Bond eligible projects as part of the routine allocation process.
22 https://www.icmagroup.org/assets/documents/Regulatory/Green-Bonds/Handbook-Harmonized-Framework-for-Impact-Reporting-December-2020-151220.pdf
THE WORLD BANK SUSTAINABLE DEVELOPMENT BONDS & GREEN BONDS | IMPACT REPORT 2020 144
23 As part of the World Bank’s due diligence in monitoring projects included in its Green Bond project portfolio, it may elect to remove a project. Possible reasons for removing a project from the Green Bond project portfolio include, but are not limited to, cancellation of the project or significant implementation delays.
Reporting for Co-Financed Projects: The World Bank often co-finances projects with the client country and/or other lenders. The results for the individual project are based on the total project including all financiers. The World Bank’s share of the total financing is included for each project.
Partial Project Eligibility: In cases where a project is only partially Green Bond eligible, the committed amount reported reflects only that portion that is Green Bond eligible. Allocations to support disbursements to such projects are made on a pro rata basis.
Aggregation of GHG Estimates: When reported in the “Project Appraisal”, “Implementation Status and Results”, and/or “Implementation Completion and Results” reports, the GHG emission reductions for projects are reported in tons of CO₂ equivalent. The World Bank, in conjunction with other International Finance Institutions, developed a harmonized approach for GHG accounting. 24 At the same time, the World Bank developed internally consistent GHG accounting methodologies to track ex-ante gross and net emissions in investment projects across relevant sectors and over their economic lifetime. Starting in FY19, World Bank is reporting
aggregated annual net GHG emissions reductions in the 2019 Corporate Scorecard. 25 Given these recent developments in GHG accounting, the basis for estimating CO₂ equivalent emission reductions for projects approved prior to FY19 may vary.
All Reported Results are from Publicly Available Sources: Reporting is based on publicly available impacts for the projects disclosed in “Project Appraisal”, “Implementation Status and Results”, and “Implementation Completion and Results” reports. To facilitate comparability of the reported results, the reporting units have been converted where such conversion is based on a standard conversion factor.
doc/084c1cd630c4a9d3fb5a6d6553443c86-0340022021/original/Joint-Report-on-MDBs-Climate-Finance-2019.pdf
24 See the Joint Report on Multilateral Development Banks’ Climate Finance at https://thedocs.worldbank.org/en/
RE s O u RCE s | iMPAC t R EPOR ting APPROACH 145
25 https://scorecard.worldbank.org/
Photo credit: ©Joao dos Santos / World Bank
ALIGNMENT WITH MARKET STANDARDS
Sustainable Development Bond Process
World Bank Sustainable Development Bonds are consistent with the Sustainability Bond Guidelines26, coordinated by the International Capital Market Association.
Use of Proceeds
World Bank bonds support the financing of a combination of green and social, i.e. “sustainable development” projects, programs, and activities in IBRD member countries. Each project is designed intentionally to achieve both positive social and environmental impacts and outcomes in line with the World Bank Group’s twin goals of eliminating extreme poverty and promoting shared prosperity. The World Bank works in every major area of development in partnership with member governments to find sustainable solutions to local and global development challenges. The list below provides examples of projects that meet the eligibility criteria to be supported by the World Bank’s Sustainable Development Bonds and we have classified projects as social or green to show alignment with the Sustainability Bond Guidelines.
Examples of projects, programs and activities, which can be
classified as “social projects” include, but are not limited to those which aim to:
• Improve health care, nutrition, and childhood development
• Improve equitable access to education, raise students’ retention and completion rates, improve learning conditions in schools, train teachers and improve their foundational skills
• Advance food security
• Strengthen social security, pension, and legal systems
• Improve access for individuals and businesses to affordable financial products and services such as transactions and payment services, savings, credit, and insurance
• Support and improve access to affordable housing through regulatory and policy reform and improving access to finance
• Create more and higherquality jobs, and connect disadvantaged people to jobs by eliminating barriers and building skills
• Improve the effectiveness of formal technical and vocational training, shortterm skills development, and apprenticeship programs
• Provide financial, technical and advisory support for countries that have decided to transition from coal to cleaner sources of energy
Examples of projects, programs and activities which can be classified as “green projects” include, but are not limited to those which aim to:
• Advance climate-smart agriculture, improve agricultural infrastructure and support services, strengthen food value chains, and increase market access for smallholder farmers
• Manage water holistically for sustained water resource utilization, improved delivery of services and building resilience
• Address biodiversity conservation and challenges of pollution and natural resource degradation
THE WORLD BANK SUSTAINABLE DEVELOPMENT BONDS & GREEN BONDS | IMPACT REPORT 2020 146
26 https://www.icmagroup.org/sustainable-finance/the-principles-guidelines-and-handbooks/sustainability-bond-guidelines-sbg
• Help resource-rich developing countries benefit from the increasing demand for minerals and metals, while ensuring mining is managed to minimize the environmental and climate footprint
• Prepare national plans and legislation to protect the environment and manage disaster risk
• Contribute to climate mitigation (solar and wind installations, new technologies that reduce GHG emissions, rehabilitation of power plants and transmission facilities to reduce emissions, clean transportation, sustainable waste management, carbon reduction through reforestation and prevention of deforestation) and climate adaptation (protection against flooding, improvements in food security, climate-resilient agriculture, sustainable forest management, and prevention of deforestation).
The forgoing classification of the examples as either social or green is for convenience only. Many of the projects, programs and activities described above include social and green components by design and will produce a mix of green and social outcomes. Additional
examples of eligible projects, programs, and activities can be found at: https://www. worldbank.org/en/topic
Target populations: World Bank-financed projects aim to protect and empower vulnerable groups, including women and girls, the poor, disabled people, and youth to reduce poverty, improve living standards, and raise income and productivity.
Process for Evaluation and Selection of Eligible Operations
All World Bank Operations are designed to achieve positive environmental and social impacts and outcomes consistent with the World Bank Group’s twin goals. Operations are approved after an extensive internal review process which integrates sustainability policies and environmental and social requirements. This is complemented by comprehensive project disclosure, portfolio management and review processes that are designed to provide timely feedback to enhance, improve and, if necessary, adjust operations to achieve positive impacts in line with desired outcomes.
Management of Proceeds
The proceeds of all World Bank bonds are invested in accordance with IBRD’s liquidity asset management investment policy. Disbursement requests for eligible operations take place in accordance with IBRD’s established policies and procedures. Disbursements are often made over a period of several years, depending on when each project/program milestone is reached. The use of the net proceeds is tracked by IBRD on a continuous basis and IBRD reports on the use of proceeds on an annual basis.
Reporting
The World Bank is committed to producing an annual impact report within one year following the close of the fiscal year (June 30) describing the Operations supported by the financing generated by World Bank bonds issued during the previous fiscal year. This report provides information on allocation of bond proceeds and reports on results across a range of measurable outcomes, highlighting a selection of individual project development indicators. Impact reports are available on the World Bank Treasury website
A lign ME nt W it H MARKE t stA n DARD s | s ustA in AB l E D EVE l OPME nt B O n D P ROCE ss 147
ALIGNMENT WITH MARKET STANDARDS
Green Bond Process
World Bank Green Bonds are consistent with the Green Bond Principles27, coordinated by the International Capital Market Association. The World Bank’s green bond eligibility criteria were independently reviewed by the Center for International Climate and Environmental Research at the University of Oslo (CICERO).
The World Bank Green Bonds are a subset of its Sustainable Development Bond Program. This means that green bonds follow the same rigorous process as all World Bank bonds and are subject to additional step to select green bond eligible projects that promote the transition to low-carbon and/or climate resilient growth in World Bank client countries.
Use of Proceeds
World Bank Green Bonds support the funding of eligible projects that promote the transition to low-carbon and climate resilient growth in IBRD member countries. Eligible projects may include those that target mitigation of climate change including investments in low-carbon and clean technology programs, such as energy efficiency and renewable energy programs and projects or adaptation to climate change, including investments in climate-resilient growth.
Examples of climate mitigation projects include, without limitation:
• Rehabilitation of power plants and transmission facilities to reduce greenhouse gas emissions
• Solar and wind installations
• Funding for new technologies that permit significant reductions in GHG emissions
• Greater efficiency in transportation, including fuel switching and mass transport
• Waste management (methane emission) and construction of energyefficient buildings
• Carbon reduction through reforestation and avoided deforestation
Examples of climate adaptation projects include, without limitation:
• Protection against flooding (including reforestation and watershed management)
• Food security improvement and stress-resilient
agricultural systems which slow down deforestation
• Sustainable forest management and avoided deforestation
Process for Evaluation and Selection of Eligible Operations
Green Bond eligible projects go through a rigorous review and approval process to ensure that they align with the World Bank Group’s mission and meet countries’ development priorities. The process includes: (i) screening to identify potential environmental or social impacts and designing policies and concrete actions to mitigate any such impacts; (ii) approval by the Board of Executive Directors –a resident Board with 25 chairs representing its member countries; and (iii) regular monitoring and evaluation.
27 https://www.icmagroup.org/sustainable-finance/the-principles-guidelines-and-handbooks/green-bond-principles-gbp
THE WORLD BANK SUSTAINABLE DEVELOPMENT BONDS & GREEN BONDS | IMPACT REPORT 2020 148
Additionally, World Bank environmental specialists screen all projects to assess climate co-benefits. This assessment is integral to identifying projects that meet World Bank Green Bond project eligibility criteria.
Management of Proceeds
Green Bond proceeds are credited to a special cash account and invested in accordance with IBRD’s liquidity asset management investment policy until used for the support of the World Bank’s financing of eligible Green Bond Projects. Disbursement requests for eligible projects take place in accordance with IBRD’s established policies and procedures. Disbursements are often made over a period of several years, depending on when each project milestone is reached. As disbursements are made for Green Bond Projects, corresponding amounts from the special account are allocated to the general lending pool at least on a quarterly basis.
Reporting
The Worl d Bank has published an impact report since 2015 and before that used its investor newsletter to report results. The World Bank is committed to producing an annual impact report within one year following the close of the fiscal year (June 30) describing the Operations supported by the financing generated by World Bank Green Bonds issued during the previous fiscal year. This report provides information on allocation of bond proceeds and reports on results across a range of measurable outcomes, highlighting a selection of individual project development indicators. Impact reports are available on the World Bank Treasury website
A lign ME nt W it H MARKE t stA n DARD s | gREE n B O n D P ROCE ss 149
Photo credit: ©Shiv Mer / Adobe Stock
World Bank Annual & Sustainability Reporting
The Annual Report provides insights and financial data on the World Bank’s activities and contributions to development progress for the fiscal year. Information and results are presented thematically and by region and fiscal year data is presented separately for IBRD and IDA.
The Corporate Scorecard provides an overarching view of the results and performance indicators of the World Bank Group’s three institutions: the World Bank (IBRD and IDA), the International Finance Corporation (IFC), and the Multilateral Investment Guarantee Agency (MIGA). The Scorecards are critical tools for monitoring the World Bank Group’s performance in key global and institutional priority areas.
The GRI Index 2020 provides an overview of sustainability considerations within the World Bank’s lending and analytical services as well as its corporate activities. This index of sustainability indicators has been prepared in accordance with the internationally recognized standard for sustainability reporting, the GRI Standards: Core option ( https://www.globalreporting.org). The GRI Index covers activities from fiscal year 2020, July 1, 2019, through June 30, 2020.
The Sustainability Review 2019 provides insights into World Bank activities undertaken between July 1, 2017, and June 30, 2019, to manage the environmental, social, and economic impacts of internal business operations. The content and data in this document relate to IBRD and IDA, together, the World Bank. This Review complements the World Bank GRI Index 2019.
More information on how the World Bank manages its internal operations to safeguard the wellbeing of staff, ecosystems, communities, and economies in which we work is available on the World Bank’s corporate responsibility website.
RESOURCES
THE WORLD BANK SUSTAINABLE DEVELOPMENT BONDS & GREEN BONDS | IMPACT REPORT 2020 150
1 2 3 4 5
RESOURCES Accountability Mechanisms
Several key groups hold the World Bank accountable to its clients and shareholders, ensure the highest performance standards in development effectiveness, protect the integrity of the projects financed, and constantly improve the efficacy of its internal operations.
The Accountability Mechanism (AM) was established by the World Bank’s Board of Directors in 2020. The Accountability Mechanism is independent from Bank Management and reports directly to the Board. The Accountability Mechanism houses both the Inspection Panel (IPN) and the Dispute Resolution Service (DRS) which was also created in 2020. The Accountability Mechanism is headed by a Secretary, who is tasked with overseeing the processing of complaints, which may be addressed through a compliance investigation carried out by the Inspection Panel, or a dispute resolution process facilitated by the Dispute Resolution Service. The Accountability Mechanism provides an avenue for individuals and communities who believe that they have been or are likely to be harmed by a project funded by IBRD or IDA to express their concerns and have them reviewed and addressed. The Inspection Panel’s annual reports are available online.
The Independent Evaluation Group (IEG) aims to strengthen the World Bank Group’s development effectiveness through evaluations that assess results and performance and provide recommendations for improvements. IEG’s evaluations contribute to accountability and learning, helping inform the World Bank Group’s directions, policies and procedures, and country partnership frameworks. IEG reports are available online.
The Integrity Vice Presidency (INT) investigates allegations of fraud, corruption, collusion, coercion, and obstruction in World Bank Group-financed projects, including those involving World Bank Group staff and corporate vendors. INT’s annual report is available online.
The Grievance Redress Service (GRS) is an avenue for individuals and communities to submit complaints directly to the World Bank if they believe that a World Bank-supported project has or is likely to have adverse effects on them, their community, or their environment. The GRS enhances the World Bank’s responsiveness and accountability by helping individuals and communities to engage with the World Bank and borrowing countries to address issues that have not been resolved by project-level grievance mechanisms. The GRS’s annual reports are available online.
The Group Internal Audit (GIA) provides independent, objective, and insightful risk-based assurance and advice to protect and enhance the value of the World Bank Group. GIA provides senior management and the Board with an independent view and reasonable assurance that processes for managing and controlling risks— as well as their overall governance—are adequately designed and functioning effectively. GIA’s annual and quarterly reports are available online.
The World Bank monitors IBRD’s operational performance through the World Bank Corporate Scorecard and regular opportunities to discuss progress on operations with the World Bank’s Executive Directors. The World Bank Corporate Scorecard is available online.
Boards of Directors’ work programs, calendars, and meeting minutes are available online.
RE s O u RCE s | ACCO untAB ility M ECHA nis M s 151
RESOURCES List of Abbreviations
BOD Biological oxygen demand
BRT Bus Rapid Transit
CO ₂ Carbon dioxide
CO ₂ eq. Carbon dioxide equivalent
COD Chemical oxygen demand
COP Colombian peso
ESG Environmental, social and governance
GDP Gross domestic product
GHG Greenhouse gas
GWh Gigawatt-hour
ha Hectare
hr Hour
IBRD World Bank (International Bank for Reconstruction and Development)
ICU Intensive Care Unit
IDA International Development Association
J$ Jamaican dollar
Kg Kilogram
Km Kilometer
Km 2 Square kilometer
kV Kilovolt
kVA Kilovolt ampere
kWh Kilowatt-hour
L Liter
m Meter
M&E Monitoring and evaluation
m 2 Square meter
m ³ Cubic meter
MJ Megajoules
MSME Micro, small and medium enterprises
MVA Megavolt ampere
MW Megawatt
MWh Megawatt-hour
NOx Nitrogen dioxide
PM Particulate matter
PPE Personal Protective Equipment
R$ Brazilian real
RIA Regulatory Impact Assessment
RMB Chinese renminbi
SDGs Sustainable Development Goals
SEI Stockholm Environment Institute
SME Small and medium sized enterprises
SO₂ Sulfur dioxide
SSA Sovereign, supranational and agency
tce Tons of coal equivalent
tCO ₂ eq. Tons of carbon dioxide equivalent
TSP Total suspended particles
ULB Urban Local Body
US$ eq. US dollar equivalent
VAT Value-added tax
WHO World Health Organization
WSS Water Supply System
THE WORLD BANK SUSTAINABLE DEVELOPMENT BONDS & GREEN BONDS | IMPACT REPORT 2020 152
This document has been prepared by the World Bank (International Bank for Reconstruction and Development, IBRD) for information purposes only, and the World Bank makes no representation, warranty or assurance of any kind, express or implied, as to the accuracy or completeness of any of the information contained herein. It is prepared by staff based on reviews of the underlying project documentation. In the event of a discrepancy between the report and the underlying source (project or bond documentation, or other source) the latter prevails.
This document is not an offer for sale of securities of the World Bank (International Bank for Reconstruction and Development, IBRD). Any offering of World Bank securities will take place solely on the basis of the relevant offering documentation including, but not limited to, the prospectus, term sheet and/or final terms, as applicable, prepared by the World Bank or on behalf of the World Bank, and is subject to restrictions under the laws of several countries. World Bank securities may not be offered or sold except in compliance with all such laws.
Any examples provided in this document are provided for illustrative purposes only and no assurance can be provided that disbursements for projects with these specific characteristics will be made by the World Bank during the term of a specific World Bank bond.
Net proceeds of a specific World Bank bond are not committed or earmarked for lending to, or financing of, any particular project, program, or activity and returns on a specific World Bank bond are not linked to the performance of any particular project, program, or activity.
Each recipient of this report is deemed to acknowledge that this is a proprietary document of the World Bank and by receipt hereof agrees not to disclose it, or permit disclosure of it, to third parties without attributing the source or the prior written consent of the World Bank.
All content (including, without limitation, the graphics, icons, and overall appearance of the presentation and its content) are the property of the World Bank, unless otherwise noted. The World Bank does not waive any of its proprietary rights therein including, but not limited to, copyrights, trademarks and other intellectual property rights.. All photos, graphics and content © World Bank, unless otherwise noted.
Disclaimer RE s O u RCE s | Dis C l A i MER 153
Investor Relations & Sustainable Finance Capital Markets & Investments Department The World Bank Treasury 1818 H St NW Washington, DC 20433 USA debtsecurities@worldbank.org +1 (202) 477-2880 treasury.worldbank.org/capitalmarkets E T W
This page intentionally left blank
THE WORLD BANK SUSTAINABLE DEVELOPMENT BONDS & GREEN BONDS | IMPACT REPORT 2020
