PORTFOLIO
ZHANGJINGHAN | SELECTED WORKS
ARCHITECTURE | PROGRAMMING | DESIGN

ZHANGJINGHAN | SELECTED WORKS
ARCHITECTURE | PROGRAMMING | DESIGN


Email: jinghan.jz@gmail.com HP: +65 88899313
Citizenship: Singapore PR / China Citizen
Aug 2018 - Jun 2023
National University of Singapore
• Master of Architecture
• Bachelor of Arts (Architecture) with Honours (Distinction)
• Cumulative Average Point (CAP): 4.33/5.00
• Date of Graduation: June 2023
Jan 2016 - Dec 2017
National Junior College
• Science stream student, distinction (A) in GP and all H2 and H3 (Economics) subjects in A-levels
• School subject top in A-levels for Chinese Language and Literature
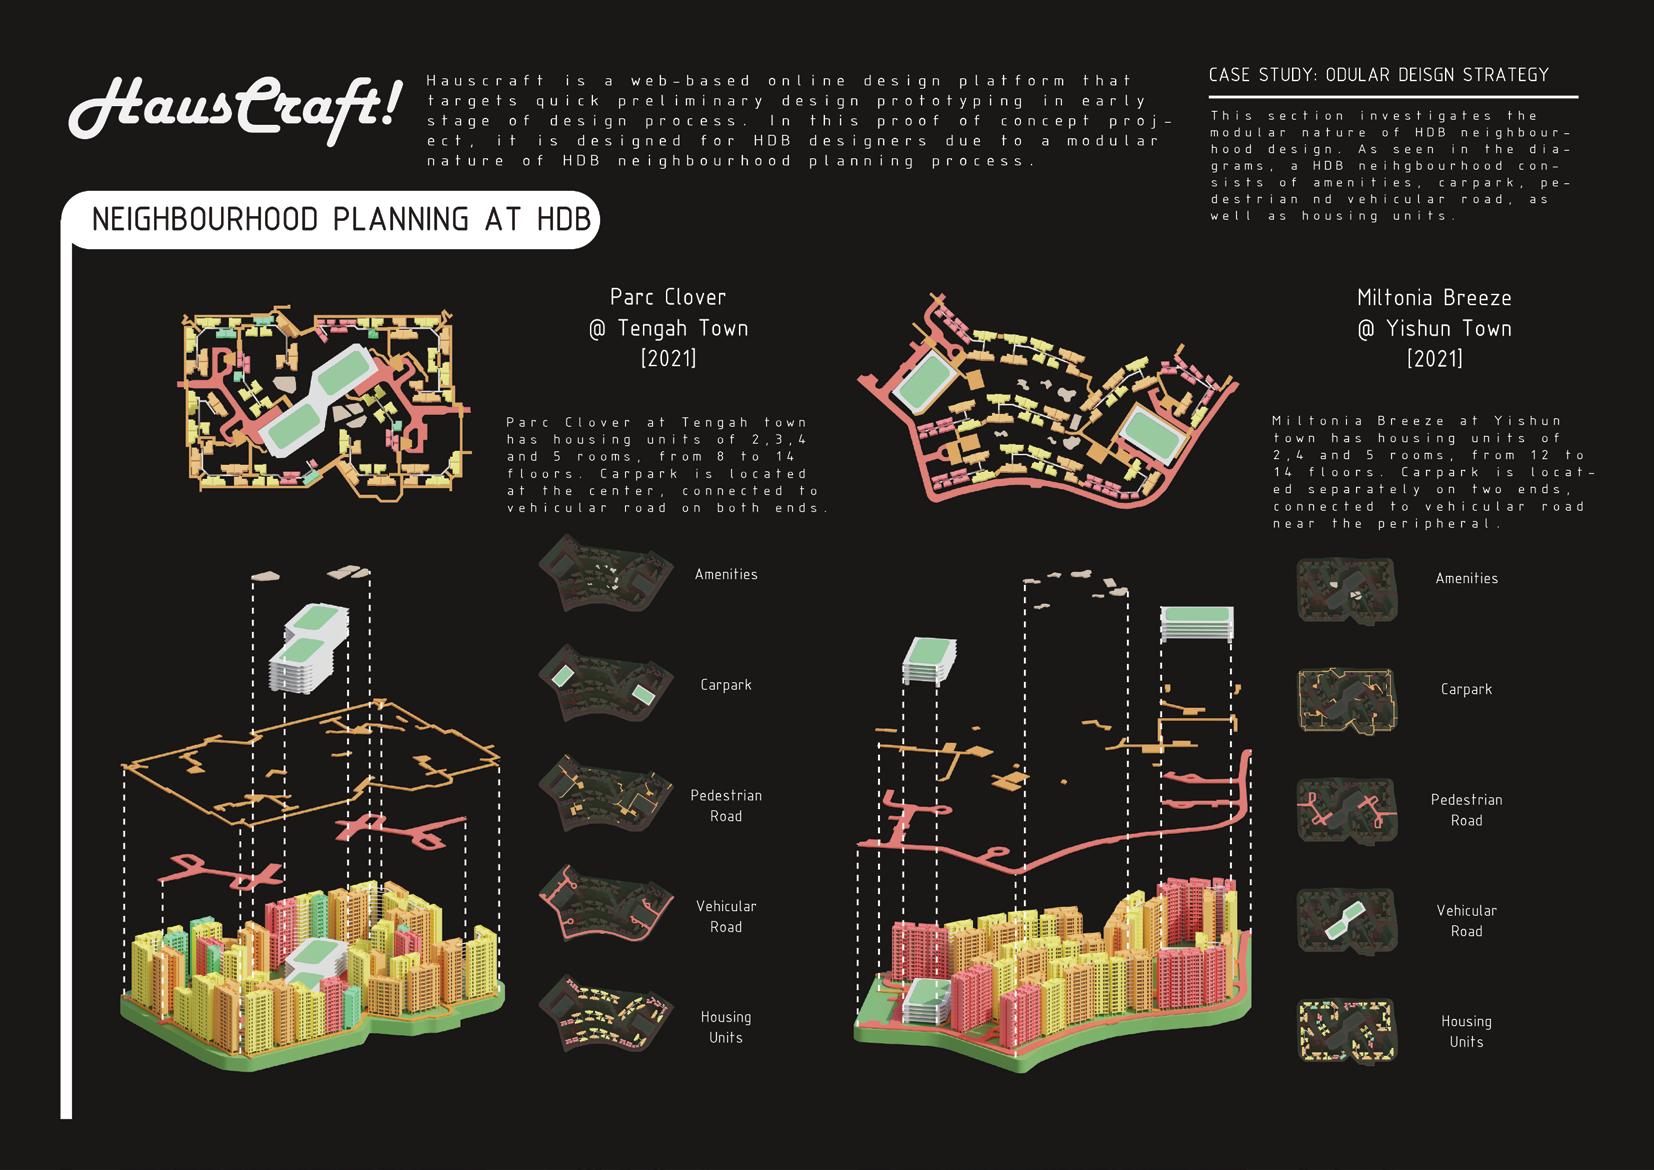
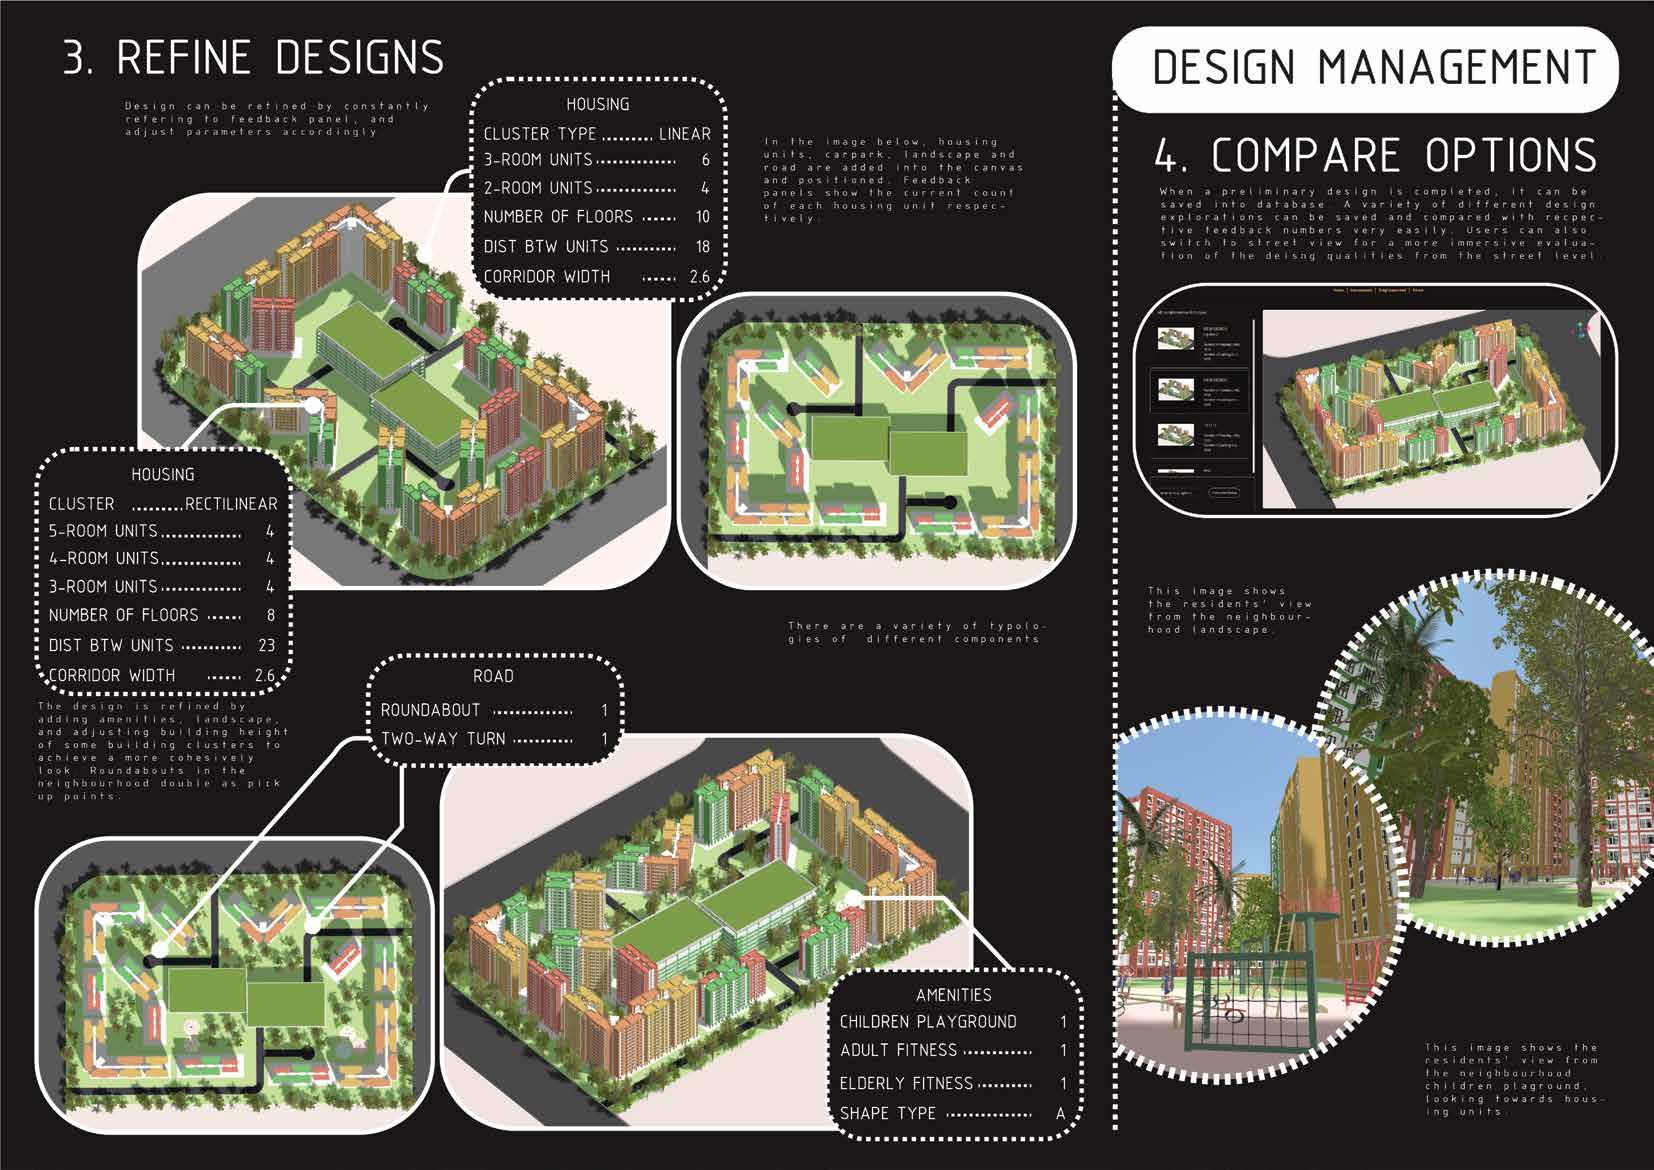
HausCraft, Web-Based Design Tool Mockup for HDB (2023)
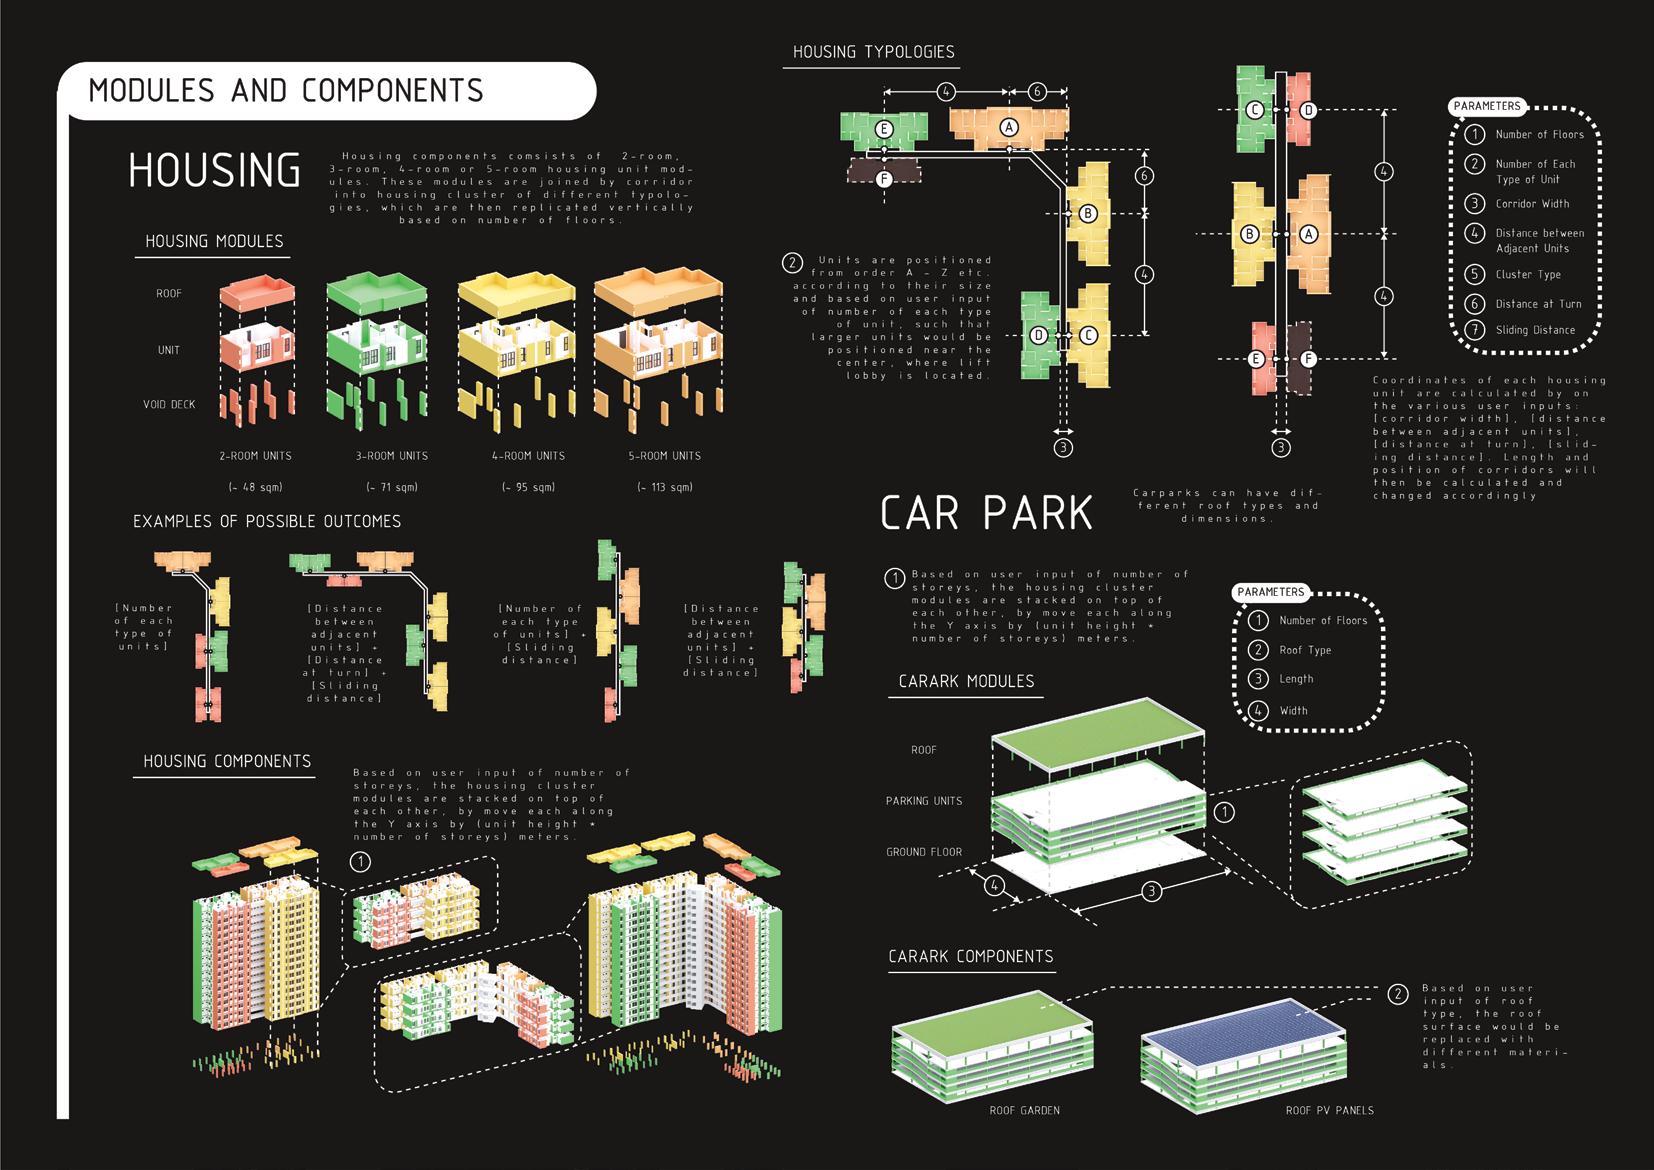
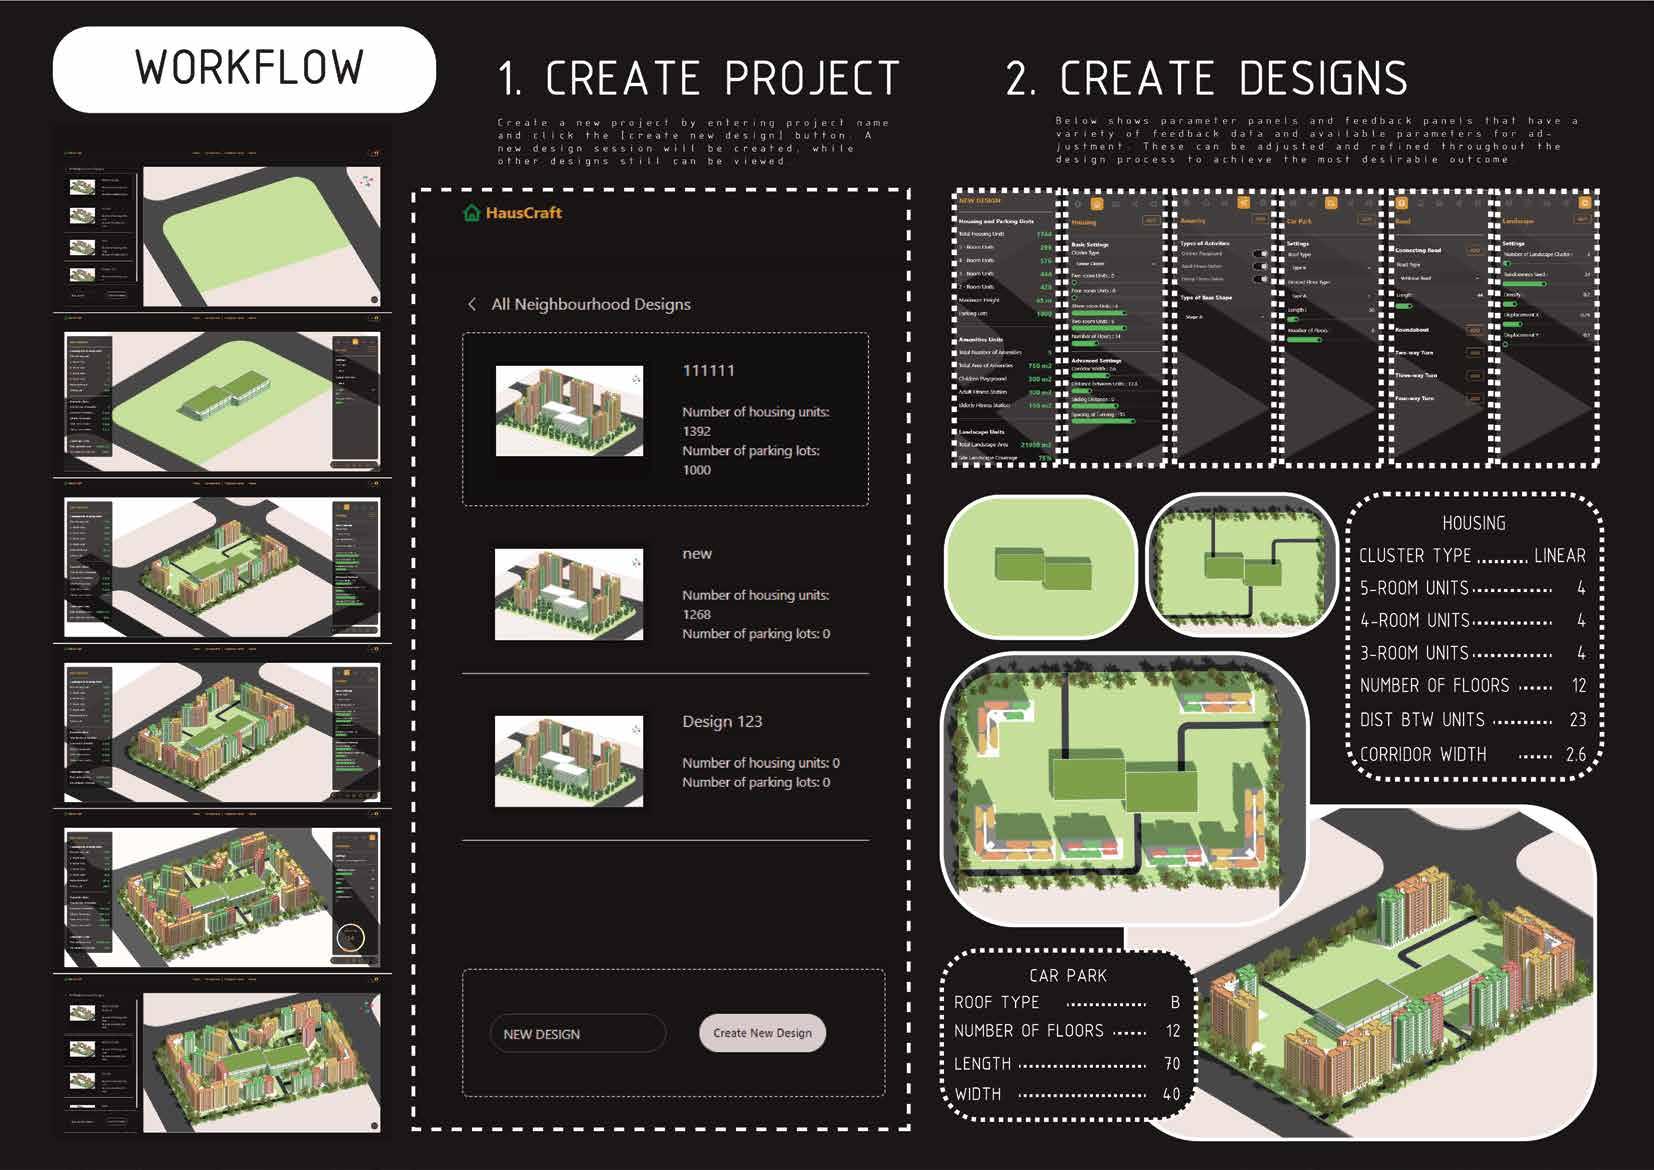
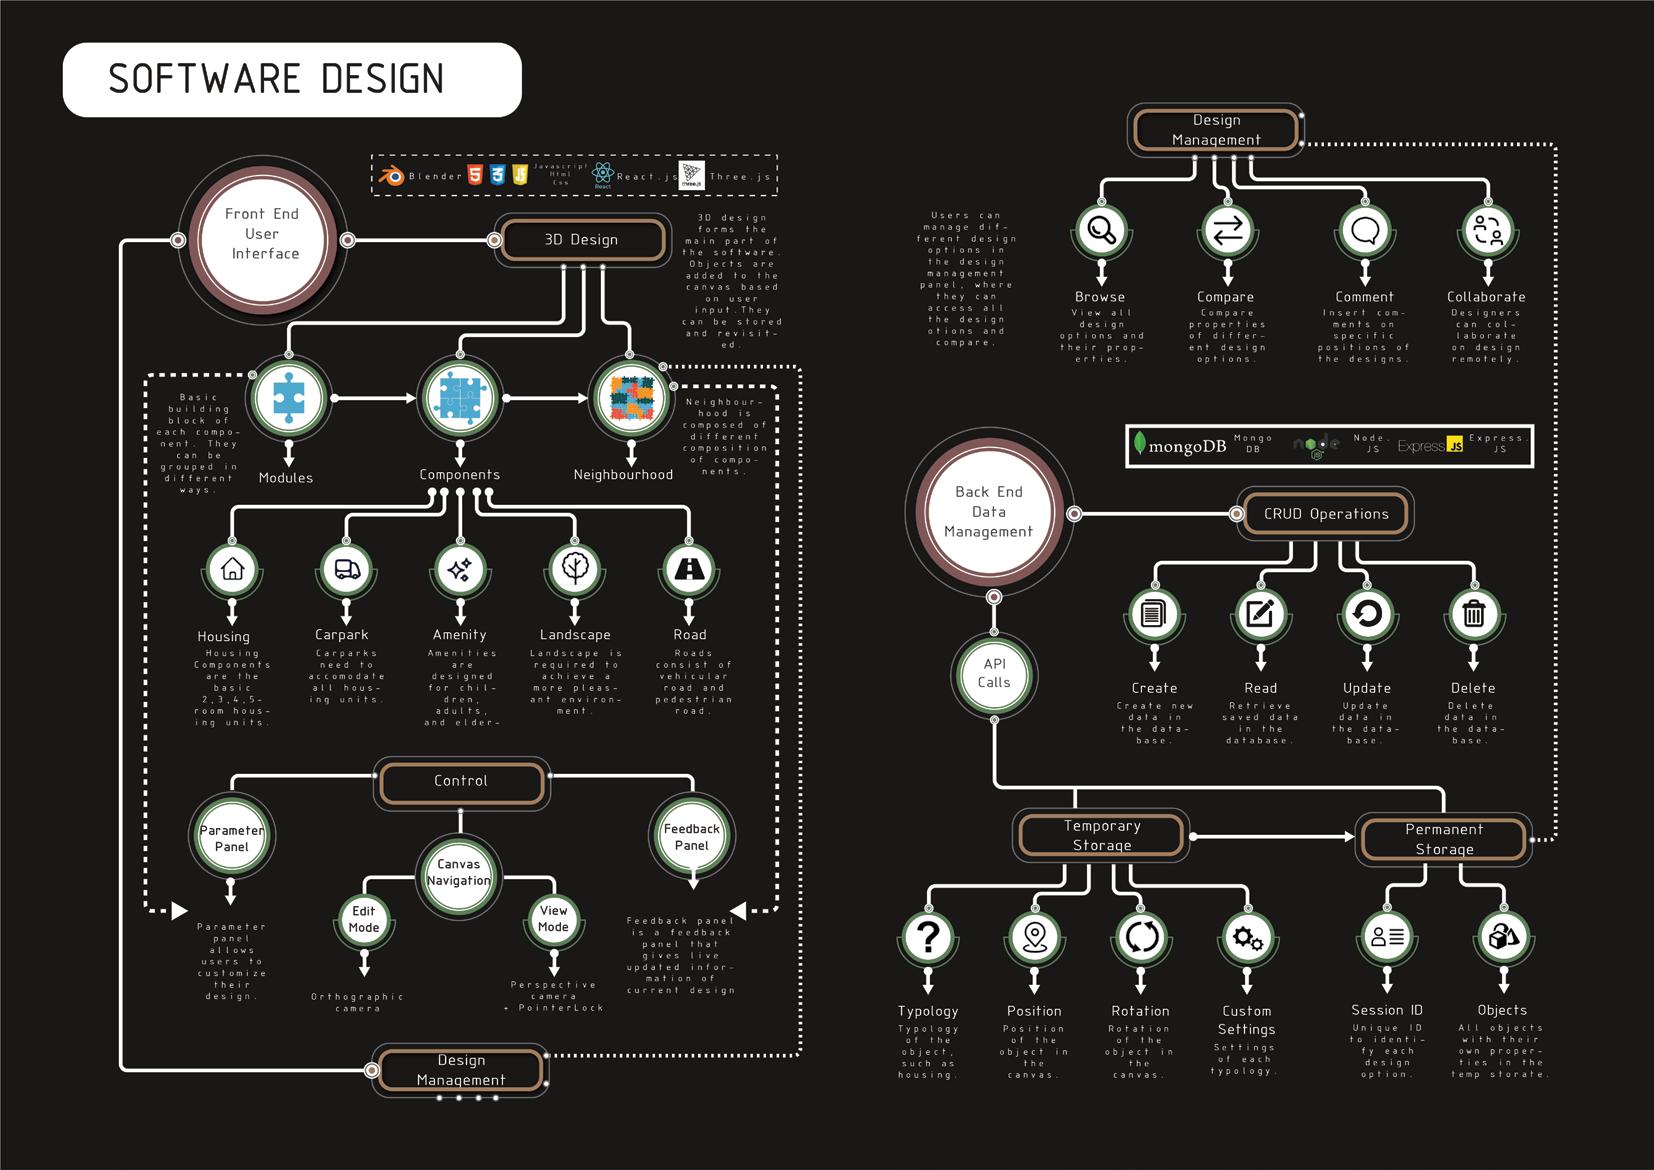
• Designed and built a full-stack web application mockup for HDB planners to perform preliminary design conceptualization. It allows users to create, update, delete and retrieve design options of a HDB neighbourhood, and perform simple architectural analysis.
• Skills: Javascript, MERN tech stack, Three.js, Blender.
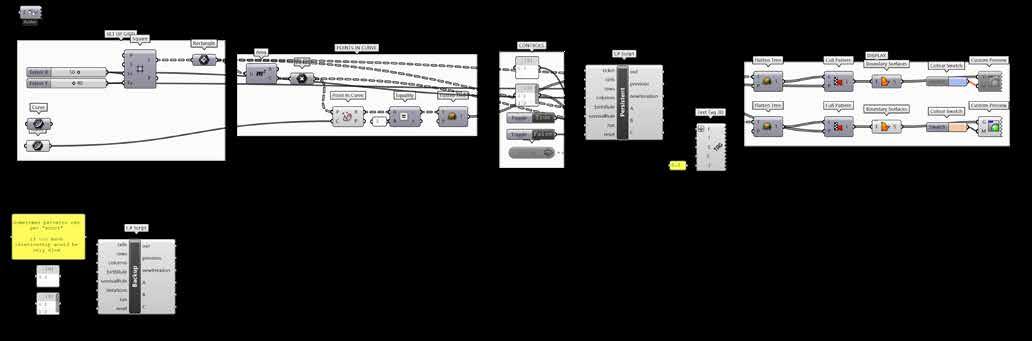
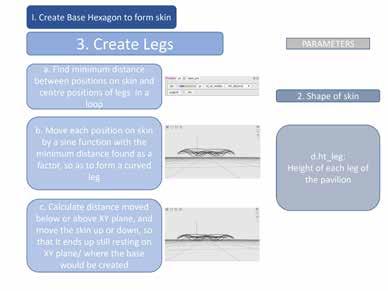
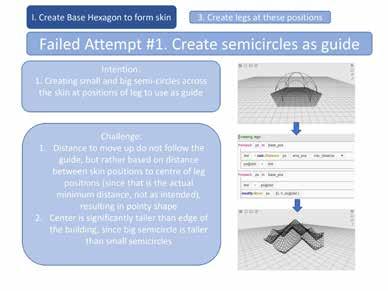
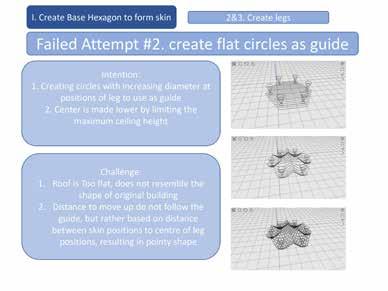
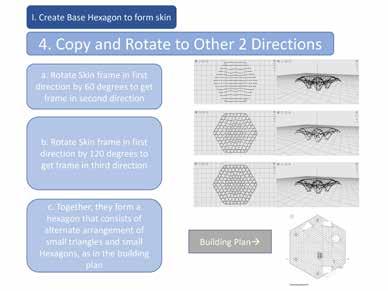
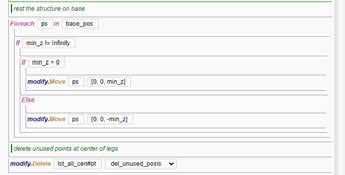
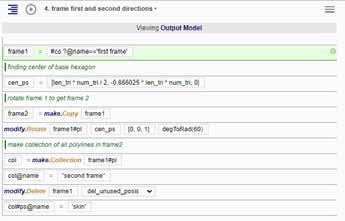
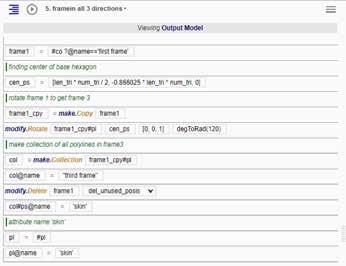
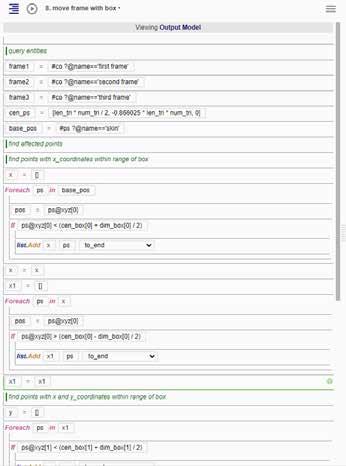
Urban Design Tool, Rhino Plug-In for Automated Urban Planning (2022)
• As part of the internship at DLABS, developed 3D algorithms for various land use types for a rhino plug-in that facilitates quick visualization and preliminary data feedback of design options. The project was commissioned by a local architecture and urban design firm.
• Skills: Rhinoceros 3D, Grasshopper3D with C#.
Design & Modelling Softwares
Adobe Illustrator, Adobe Photoshop, Adobe InDesign, Adobe Premiere Pro, Figma Rhinoceros 3D, Grasshopper3D, Blender, Google SketchUP, Autodesk AutoCAD, Archicad, Microstation
Data Analysis & Software Development
Web design and development with HTML, CSS, Javascript and MERN tech stack, web-based 3D design with Three.js, data analysis with R and R Studio, C#.
Languages
Proficient in English and Mandarin (both spoken and written), intermediate knowledge of Japanese
Microsoft Office Suite
Microsoft PowerPoint, Excel, Word, Outlook
WORK EXPERIENCE
June 2023 - Now
Architectural Assistant, Consortium 168 Architects, Singapore
• Applied analytical thinking to prioritize design goals, refine schemes, and perform quantitative assessments using Excel with precision and attention to detail.
• Managed project launches, prepared pricing and marketing materials, and met tight deadlines while handling multiple tasks efficiently.
• Led regular meetings with consultants to identify issues, assess risks, and implement resolutions effectively. Collaborated with clients to adapt quickly to changing requirements, providing innovative solutions and maintaining clear communication.
• Presented complex information in a clear and concise manner to client management teams using PowerPoint, on a regular basis.
May - Aug 2022
Computational Designer (Intern), DLABs, Singapore
• Led algorithm development and debugging for 10 architecture types in an urban planning software, utilizing strong logical, spatial and numerical understanding, accelerating project milestones to meet final deadline.
• Engaged in weekly client communication and daily coordination with diverse team members.. Effectively utilized PowerPoint for client demos, and created detailed technical documentation.
Nov 2021 - May 2022
Translator (Intern)
Archdaily China, Singapore (Remote)
• Translated articles weekly from English to Chinese for publication on ArchDaily’s Chinese website and official WeChat account, a leading global platform specializing in news and insights on building design and construction.
June - Nov 2021
Architectural Assistant (Intern),TALE Architects, Singapore
• Enhanced design workflow with parametric algorithms. Spearheaded a parametric design project .
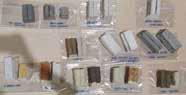
• Prepared drawings, models and illustrations, material specifications and material showroom.
Dec 2018
Research Assistant
Old Police Academy Heritage Research Study, NUS Department of Architecture, Singapore
• Planned and conducted onsite measurements and produced hand drawn technical drawings of Old Police Academy as part of NUS Architecture’s Old Police Academy Heritage Research.
• Produced drawings are kept as historical documentations in Urban Redevelopment Authorities (URA) archive.
2021 - 2023
BCA-INDUSTRY iBuildSG Undergraduate Sponsorship, Building and Construction Authority, Singapore
• Awarded to students of high academic calibre pursuing full-time built environment courses at local Universities.
2014 - 2017
Senior-Middle 1 (SM1) Scholarship, Ministry of Education, Singapore
• Awarded to PRC middle school students with top academic and co-corricular achievements to continue education in Singapore with tuition, accommodation and living expenses fully covered, a partnership between Singapore and China.
Web-Based Design Tool Development
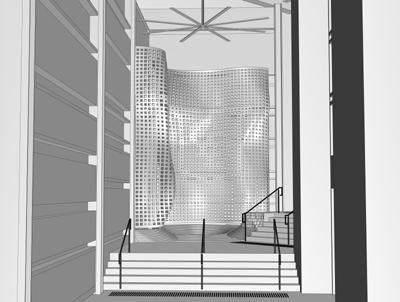
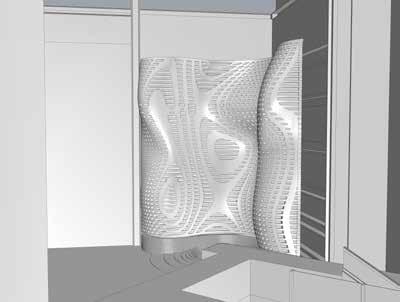
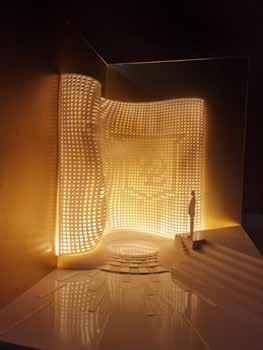
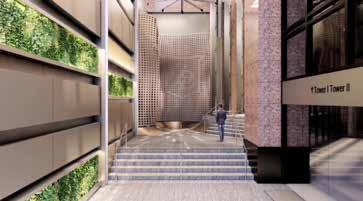
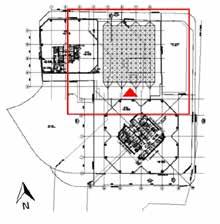
REPUBLIC PLAZA WATER FEATURE | 2021
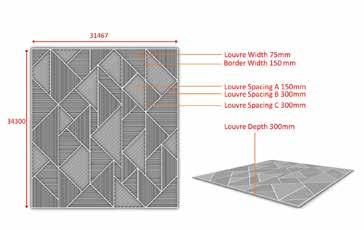
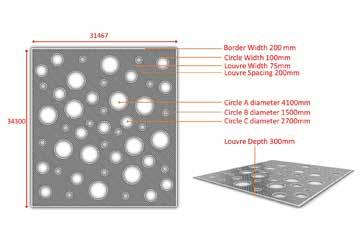
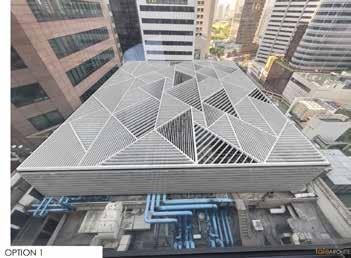
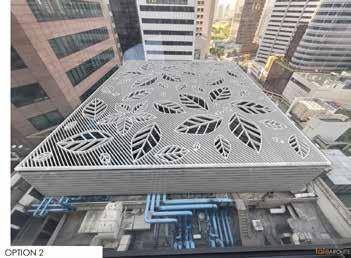
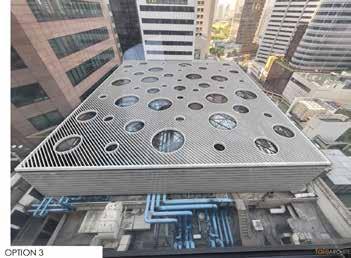
REPUBLIC PLAZA M&E ROOF SCREEN | 2021
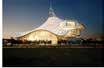
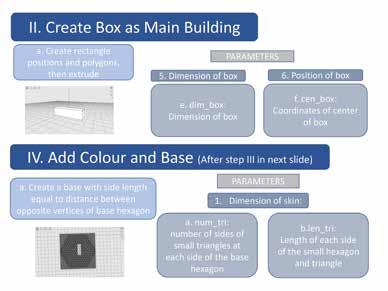
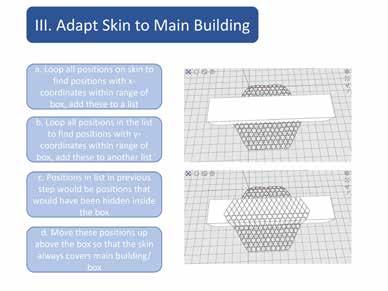
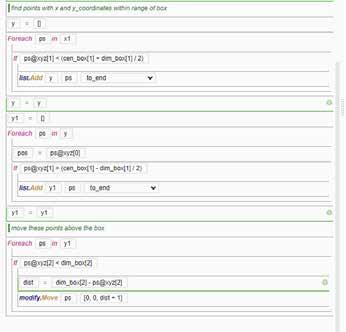
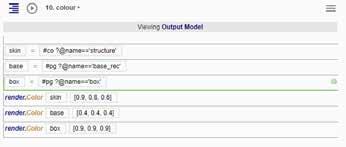
CENTRE POMPIDOU METZ (MOBIUS MODELLER) | 2019
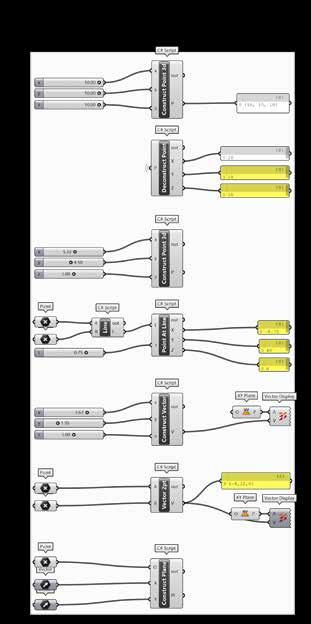
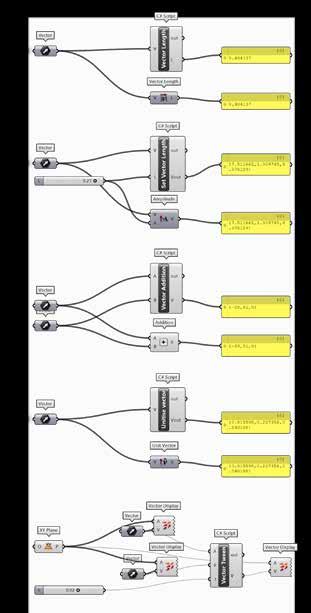
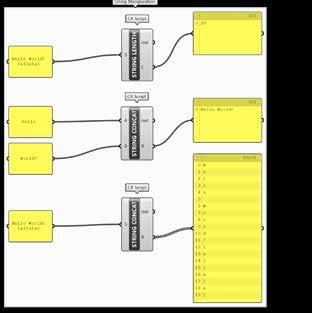
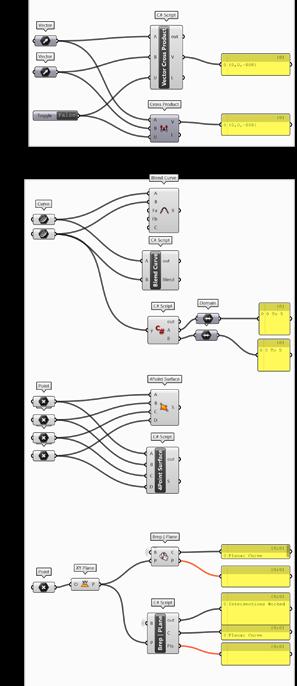
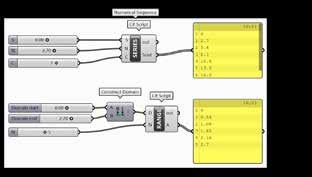
GROCERY, INCOME AND DIABETES (R) | 2022 GH C# SCRIPTING | 2022
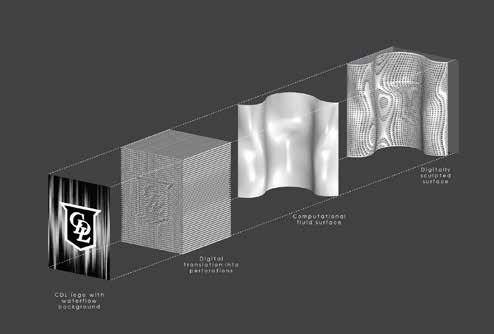
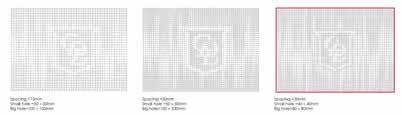
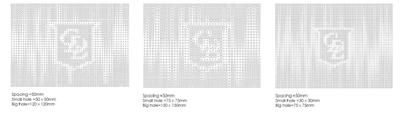
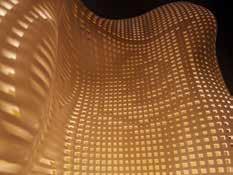
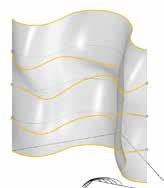
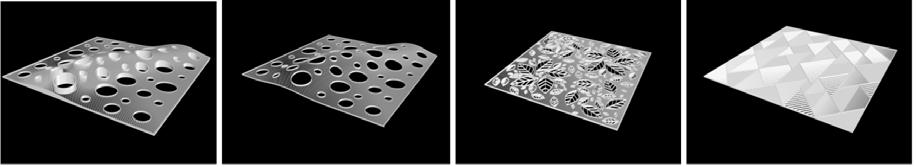
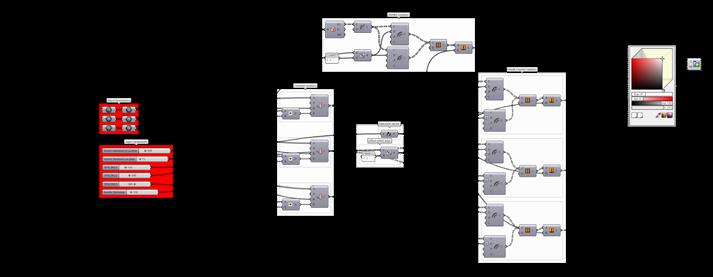
This project is a water feature located at the first storey of Republic Plaza near the entrance. Parametric design was used to both explore a variety of curved surfaces to select from, and also to determine the appropriate perforation size to best showcase the intended pattern.
Besides, we considered 3D printed concrete as the material and construction method, and cooperated with NTU 3D printing lab in matters related to construction of both physical model and actual structure.


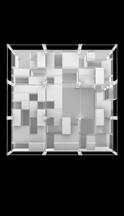
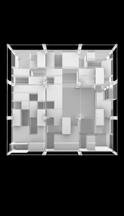
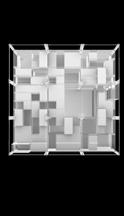
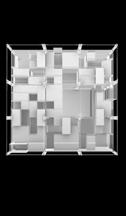
This project is about designing a screening panel for the visually unappealing M&E rooftop of Republic Plaza, while keeping it porous to allow for adequate ventilation for the services on the rooftop.
Parametric models were used to explore different forms and perforation patterns to best conceal the equipment below and enhance the overall appearance of the roof.
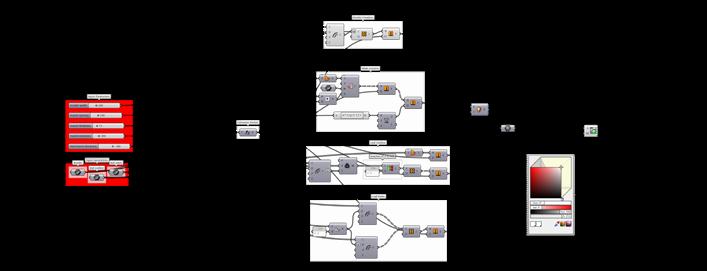
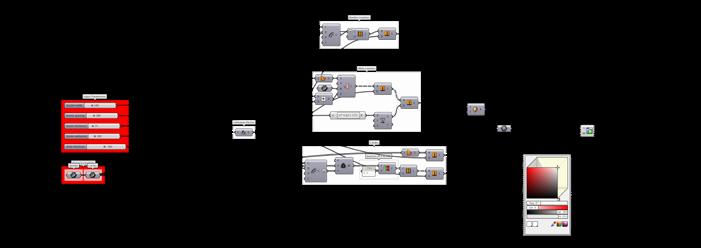

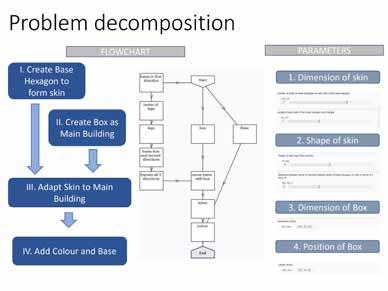
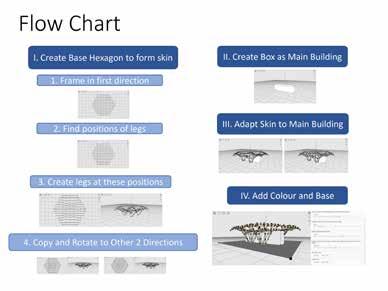
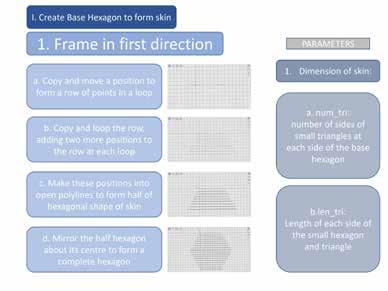
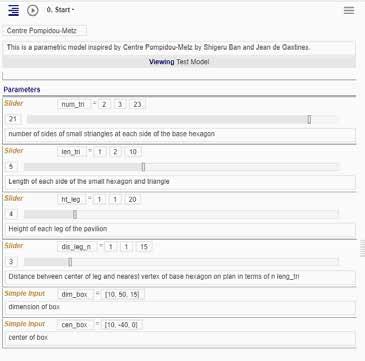
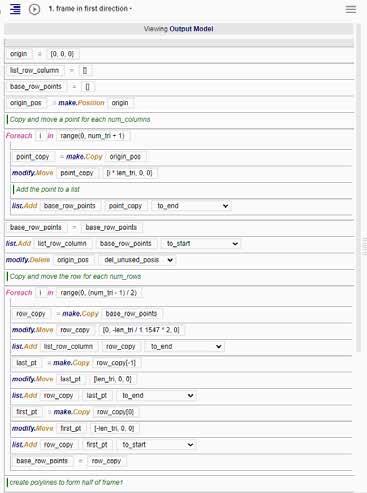
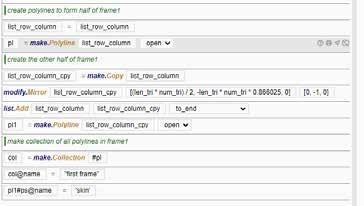
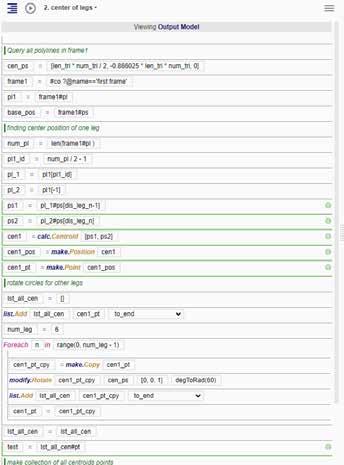
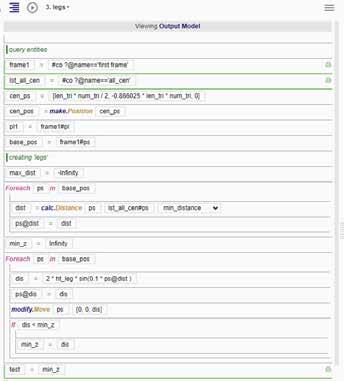
This project was done for a core module on Computational Spatial Thinking in Year 2. Möbius Modeller, an open-source web application for parametric modelling was used to create the model. The app allows users to create modelling procedures using visual programming techniques, combining flowcharts with drag-anddrop fill-in-the-blanks coding.
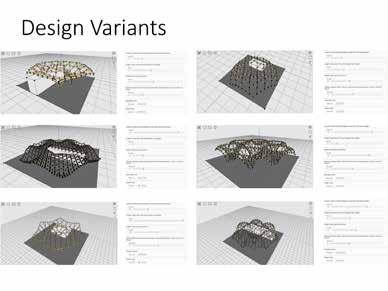
Centre Pompidou Metz was selected as my source of inspiration. Our task was to make a parametric model that is able to generate a series of design variants that have a similar character and logic to the selected existing building.


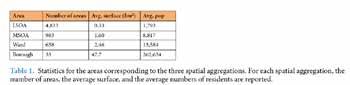
This was an report done for an elective module on data analysis with R that I am taking in the current semester. The goal of this assignment is to formulate a research question, and answer it with a data analysis on the Tesco Grocery 1.0 dataset. The document was created entirely from R markdown.
left_join(ward_14,
left_join(ward_18,
'area_id')) ->map18
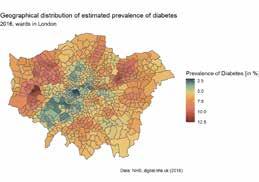
ggplot(map14, mapping aes(fill estimated_diabetes_prevalence)) + geom_sf()+
scale_fill_gradientn(colors = met.brewer("Hokusai1"), na.value "transparent", trans = 'reverse')+theme_void()
labs( title="Diagram produced using 2014 map alone", subtitle 'White areas indicate missing data', fill="Prevalence of Diabetes [in %]"
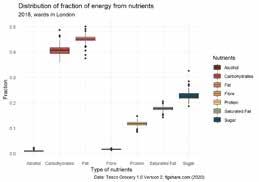
scale_x_discrete(label=c('Alcohol' 'Carbohydrates' 'Fat' 'Fibre' 'Protein' 'Saturated Fat' 'Sugar'))+
scale_fill_manual(values=met.brewer('Hokusai1'), labels c('Alcohol','Carbohydrates','Fat','Fibre' 'Protein', 'Saturated Fat' 'Sugar'))+
labs(x="Type of nutrients", y="Fraction",
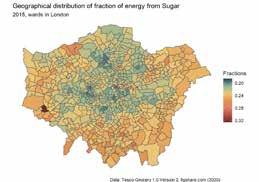
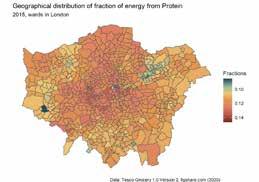
title="Distribution of fraction of energy from nutrients"
subtitle = '2015, wards in London', fill="Nutrients"
caption="Data: Tesco Grocery 1.0 Version 2, figshare.com (2020)")
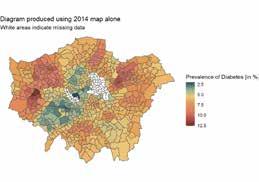
with the wrong ‘label’/ ward code and the ward code in boundary shape file. While grocery shopping dataset correspondeds largely with
shape file, strangely both diabetes (2015) and income (2013) dataset correspond only to certain parts of the each boundary shape file. It is suspected that some places in London had undergone name and code change, however upon some preliminary research on the internet, no The problem is illustrated by the two diagrams below showing geographical distribution of diabetes across London using two sets of shape file from
left_join(ward_18, combined_full, by = c('GSS_CODE' = 'area_id')) ->map18
ggplot(map18, mapping aes(fill estimated_diabetes_prevalence)) + geom_sf()+ scale_fill_gradientn(colors = met.brewer("Hokusai1"), na.value "transparent", trans = 'reverse')+theme_void()
ggplot(map14, mapping aes(fill estimated_diabetes_prevalence)) + geom_sf()+ scale_fill_gradientn(colors = met.brewer("Hokusai1"), na.value "transparent", trans = 'reverse')+theme_void()
labs( title="Diagram produced using 2014 map alone", subtitle 'White areas indicate missing data', fill="Prevalence of Diabetes [in %]"
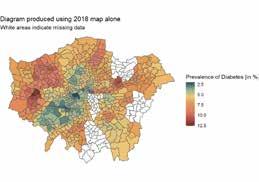
labs( title="Diagram produced using 2018 map alone" subtitle 'White areas indicate missing data' fill="Prevalence of Diabetes [in %]" Therefore
ggplot(map18, mapping aes(fill estimated_diabetes_prevalence)) + geom_sf()+
scale_fill_gradientn(colors = met.brewer("Hokusai1"), na.value "transparent", trans = 'reverse')+theme_void()
labs( title="Diagram produced using 2018 map alone" subtitle 'White areas indicate missing data' fill="Prevalence of Diabetes [in %]"
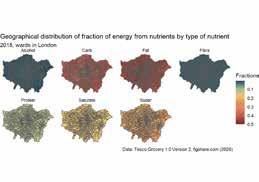
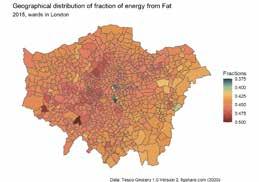
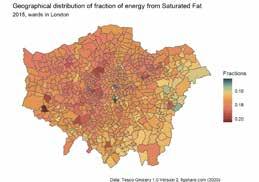
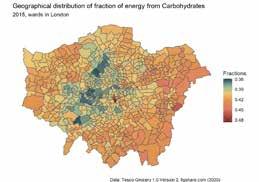
Then, a faceted plot of maps is done to show geographical distribution by nutrients. The dataset was converted to tidy data for plotting.
pivot_longer(m_joined_sf,c(f_energy_fat,f_energy_saturate,f_energy_sugar,f_energy_protein, f_energy_carb,f_energy _fibre, f_energy_alcohol),names_to = 'f_energy',values_to 'f')->mm
names <- as_labeller(c('f_energy_alcohol' 'Alcohol' 'f_energy_carb' = 'Carb' 'f_energy_fat' = 'Fat' 'f_energy_fibre' = 'Fibre', 'f_energy_protein' 'Protein' 'f_energy_saturate' = 'Saturate' 'f_energy_sugar' = 'Sugar'))
ggplot(mm, mapping = aes(fill = f)) + geom_sf(aes(geometry = geometry.y))+ geom_sf(aes(geometry = geometry.x))+ facet_wrap(~f_energy, ncol = 4 labeller =
geometry.x))+
scale_fill_gradientn(colors = met.brewer("Hokusai1"), na.value = "transparent", trans = 'reverse')+
theme_void()+ labs(
title="Geographical distribution of fraction of energy from Fibre"
subtitle = '2015, wards in London'
fill="Fractions"
caption="Data: Tesco Grocery 1.0 Version 2, figshare.com (2020)"
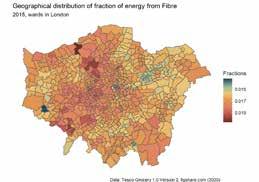
Observation Generally even distribution of faction of energy from fibre, with a few regions with very low fraction compared to the rest.
ggplot(m_joined_sf, mapping aes(fill f_energy_alcohol)) geom_sf(aes(geometry geometry.y))+ geom_sf(aes(geometry geometry.x))+
scale_fill_gradientn(colors = met.brewer("Hokusai1"), na.value = "transparent", trans = 'reverse')+
theme_void()+
labs(
title="Geographical distribution of fraction of energy from Alcohol",
subtitle = '2015, wards in London',
fill="Fractions", caption="Data: Tesco Grocery 1.0 Version 2, figshare.com (2020)"
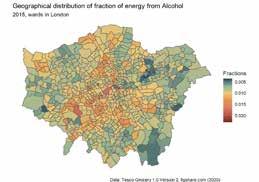
Observation The plot presents a range of different faction of energy from alcohol across regions. Generally in the peripheral areas less energy comes from alcohol. The reverse is true for the rest.
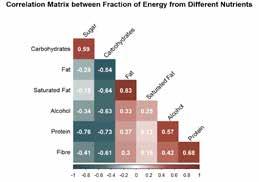
3. Correlation between sources of energy intake
Calculating correlation coefficient between fraction fo energy from different nutrients.
combined_inner %>% select(f_energy_fat,f_energy_saturate,f_energy_sugar,f_energy_protein,f_energy_fibre,f_energy_carb,f_energy_alc ohol) ->combined_smaller cor(combined_smaller) -> c
colnames(c) c('Fat', 'Saturated Fat', 'Sugar', 'Protein', 'Fibre', 'Carbohydrates', 'Alcohol') rownames(c) c('Fat', 'Saturated Fat', 'Sugar', 'Protein', 'Fibre', 'Carbohydrates', 'Alcohol')
4. Correlation between
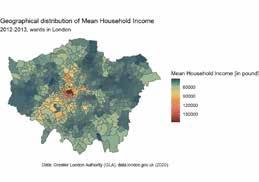
ggplot(data = combined_inner%>%filter(Mean_201213<175000),
na.value = "transparent", trans 'reverse')+
geom_smooth(colour 'black', size 1)+
labs(x="Mean Household Income" y="Estimated Prevalence of Diabetes", title="Relationship between Mean Household Income \n and Estimated Prevalence of Diabetes"
subtitle = 'wards in London', colour="Fraction of energy from sugar"
caption="Data: Tesco Grocery 1.0 Version 2, figshare.com (2020)\n NHS, digital.nhs.uk (2016)\n Greater London uthority (GLA), data.london.gov.uk (2020)"
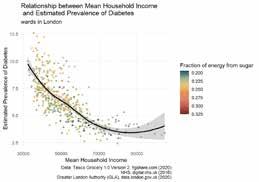
cor(combined_inner$Mean_201213,combined_inner$estimated_diabetes_prevalence) ## [1] -0.7022362
Observation
There
5. How sources of energy intake are correlated with disbetes and income respectively
Calculating correlation coefficient between different nutrients and income.
cor(combined_inner$Mean_201213,combined_inner%>% select(f_energy_fat, f_energy_saturate, f_energy_sugar, f_energy _protein,f_energy_fibre, f_energy_carb, f_energy_alcohol)) ->c1
c1 <- as.data.frame(c1) pivot_longer(c1, col everything(), names_to = 'energy_source', values_to = 'f' -> c1_long Add a column that indicates either negative or positive correlation for better visualisation.
c1_long%>% mutate(correlation case_when(f<0 'Negative Correlation',f>0 'Positive Correlation'))->c1_long_a
c1_long_a$f <- round(c1_long_a$f, digit = )
ggplotly(ggplot(data c1_long_a, mapping aes(x = energy_source, y f, fill = correlation))+ geom_col()+ geom_text(aes(label = f))+ scale_fill_manual(values=c("#507272" "#a84b3f"))+ scale_x_discrete(label=c('Alcohol','Carb','Fat','Fibre','Protein','Saturate','Sugar'))+ labs(x="Mean Household Income" y="Correlation Coefficient [round to 2dp]", title="Correlation between Mean Household Income \n and Fraction of Energy from Each Nutrient" fill="Correlation", caption="Data: Tesco Grocery 1.0 Version 2, figshare.com (2020)\n Greater London Authority (GLA), data.london.g ov.uk (2020)"))
Plotting a correlation matrix showing the correlation coefficients. col_1 <- colorRampPalette(c("#254d5f" "#507272" "#FFFFFF" "#a84b3f" "#763324")) corrplot(c, method="color", col=col_1(200), type="lower", order="hclust" addCoef.col = "white" tl.col="black" tl.srt=45 diag=FALSE title = 'Correlation Matrix between Fraction of Energy from Different Nutrients', mar=c(0 1 0) ) Observation
Calculating correlation coefficient between different nutrients and diabetes. cor(combined_inner$estimated_diabetes_prevalence,combined_inner%>% select(f_energy_fat, f_energy_saturate, f_ener gy_sugar, f_energy_protein,f_energy_fibre, f_energy_carb, f_energy_alcohol)) ->c2
c2 <- as.data.frame(c2) pivot_longer(c2, col everything(), names_to = 'energy_source', values_to = 'f' -> c2_long
c2_long%>%
mutate(correlation case_when(f<0 'Negative Correlation',f>0 'Positive Correlation'))->c2_long_a
c2_long_a$f <- round(c2_long_a$f, digit = )
ggplotly(ggplot(data c2_long_a, mapping aes(x = energy_source, y f, fill = correlation))+
geom_col()+
combined_inner%>%filter(Mean_201213<175000), aes(x = Mean_201213, y estimated_diabetes_prevalenc e, colour = f_energy_sugar))+ geom_point()+ scale_colour_gradientn(colors
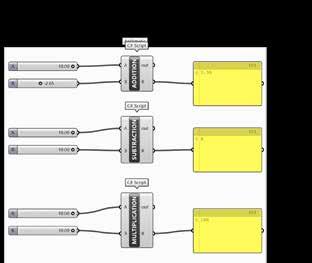
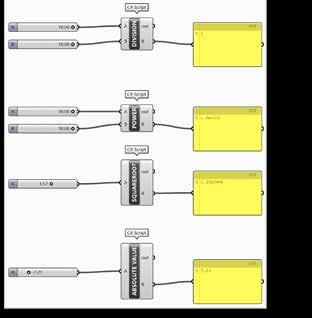
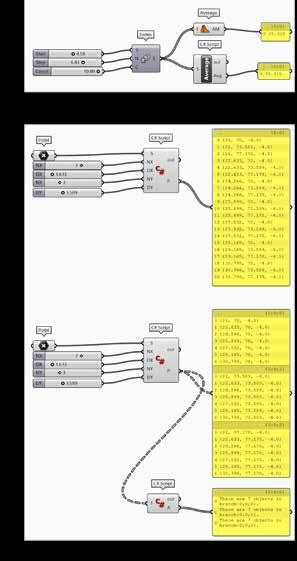
Advanced Development in Grasshopper |Parametric Camp
In my own time, I completed a youtube tutorial series LearningC#:IntroductiontoComputerProgramming for Designers provided by Parametric Camp to learn about C# syntax and the basics of object oriented programming.
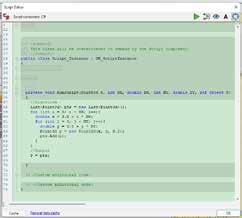
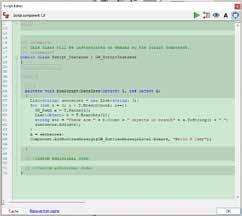
Besides, I also followed “Advanced Development in Grasshopper“ provided by the same channel to learn about plug-in development process for grasshopper. This is still ongoing, and so far I have familiarised myself with C# scripting component in grasshopper and the RhinoCommon library by recreating some of the gh components using C# script.

THE ENCORE | 2022 WET MARKET REIMAGINED | 2021 MIRAGE | 2020
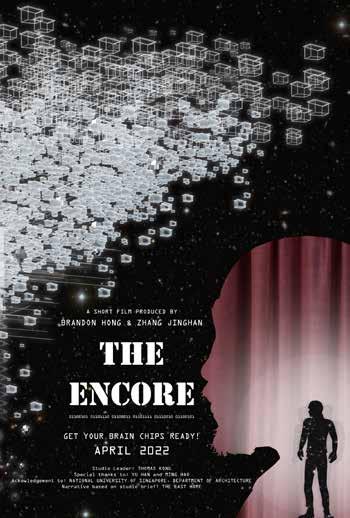
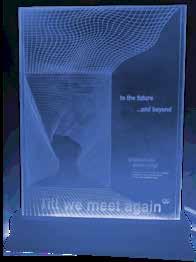
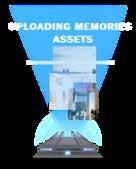
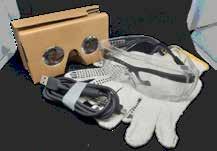
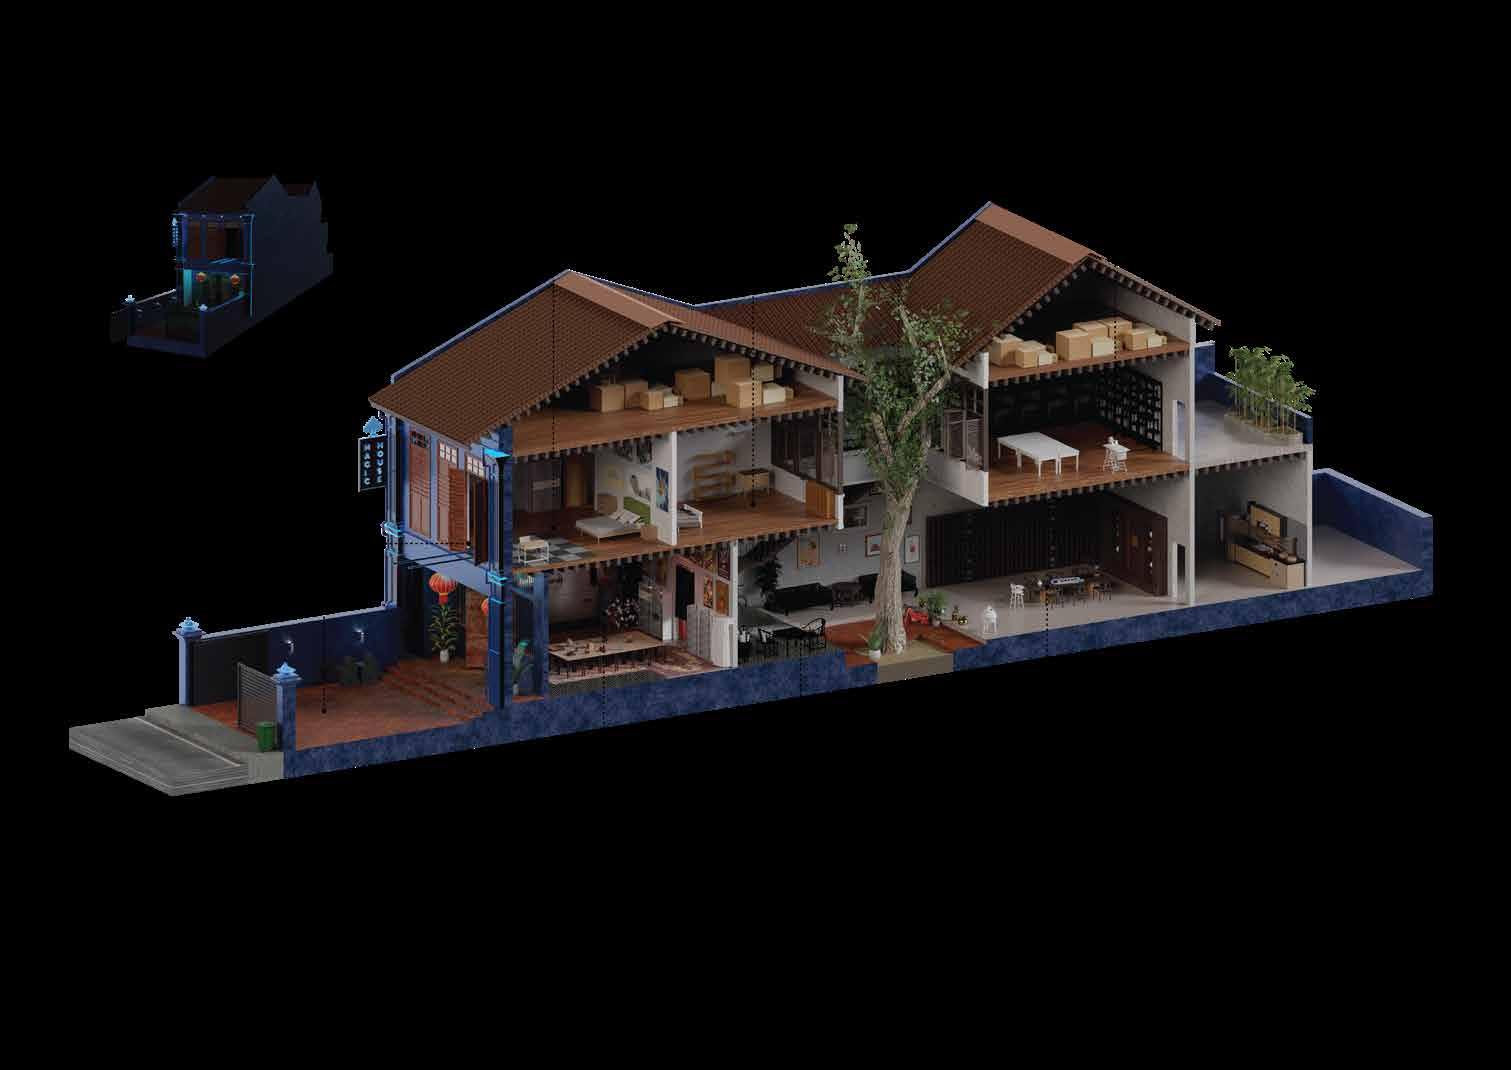
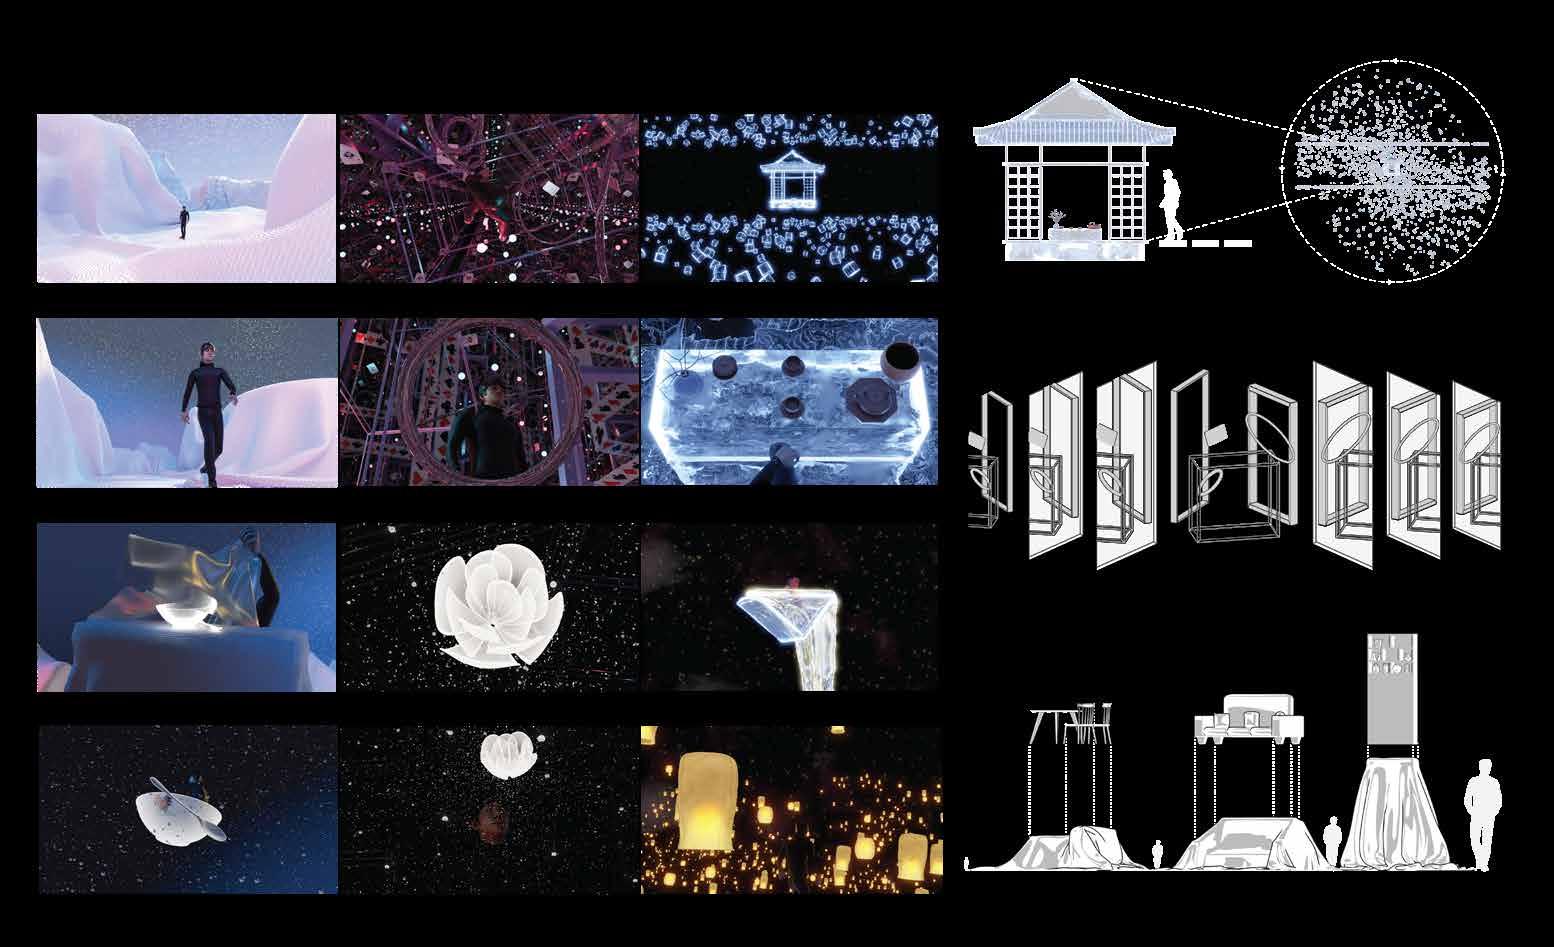
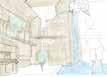
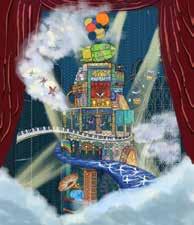
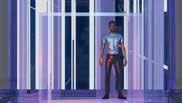
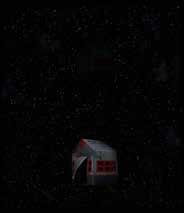
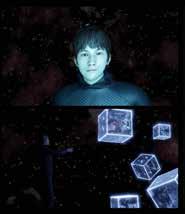
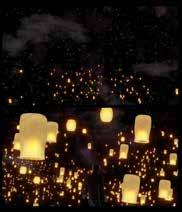
The Encore is a short film about the Metaverse, from a virtual space of entertainment, consumption, and unbridled fantasy into one of recollecting personal memories and, in the process, re-shaping the idea of death and the afterlife.
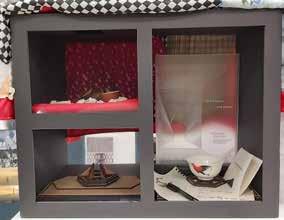
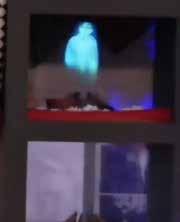
In this story, Neal (the protagonist) travels through several spaces of his childhood home through the Metaverse. Each encounter with objects, spaces, and activities reveals varied moments of frustration, nostalgia, joy and comfort between him and his grandfather Noah. The metaverse that Neal travels through acts as a virtual last home for recollecting personal memories and, in the process, virtually connecting him with his late grandfather who had passed away.
The Last Home in this case is not a physical space. It resides in our minds, and in the ever-expanding space of the Metaverse where second chances and coming home are possible for all of us.


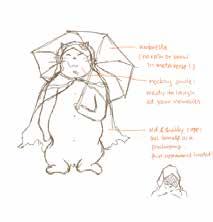
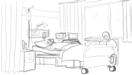
Above: Psychopomp Sketches. Earlier versions of the story contains a Psychopomp character that would guide Neal to his Grandpa, Noah.


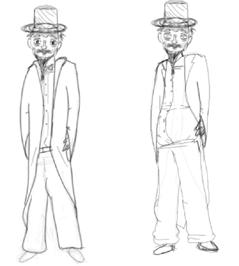


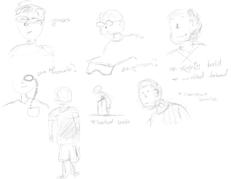


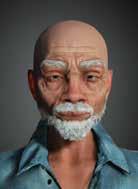
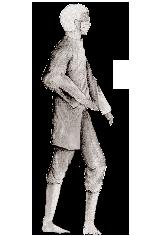
Grandad of Neal.
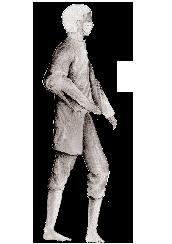
Name was chosen to pay tribute to Noah from the Bible, who created the Ark after gaining instructions from God. In this case, Noah is the creator of his own Metaverse. When trying to come up with Noah’s design, we wanted to incorporate some of the Metaverse items into his clothing, such as AR monocle and AR magic wand.
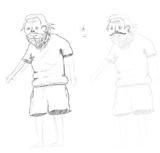
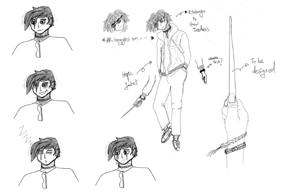
Granson of Noah.
Name was chosen to pay tribute to Neal Stephenson (the creator/author of Snow Crash, where the word Metaverse was first used)
When trying to come up with Neal’s design, we wanted to incorporate some of the Metaverse items into his clothing, such as AR glasses, and the possible future of having Haptic Rings (which are upgraded versions of Haptic gloves)


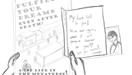
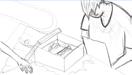
STORYBOARD VERSION 1
STORYBOARD VERSION 2


STORYBOARD INTERIM


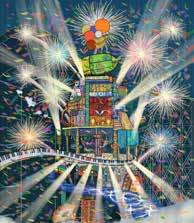


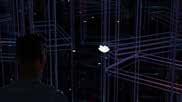

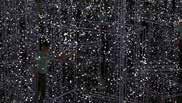


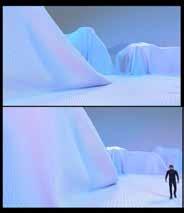
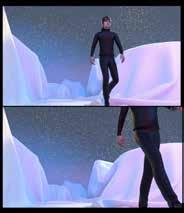
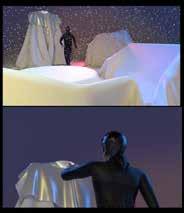
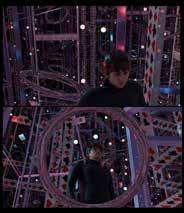

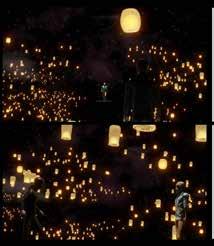
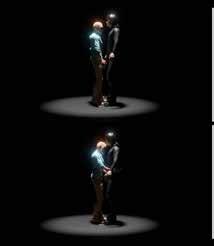
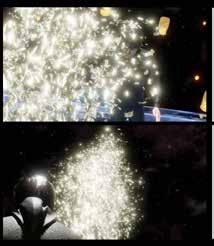
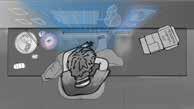
Left: The final storyboard and film sees Neal traveling through three main areas in the Metaverse, where he would interact with objects that has forged memories for both himself and his grandad.
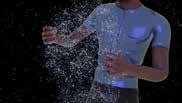
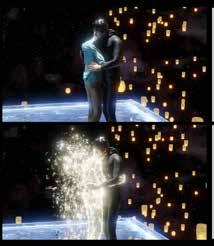
In the end, Neal gets to meet with his grandad again, only for both of them to hug each other, before Noah transforms into particles and vanishes into the sky, signifying that he has moved on.
This project seeks to imagine how Density,UrbanismandPublicness will become in the near to far future as a result of re-designing the community building type for the pandemic age.
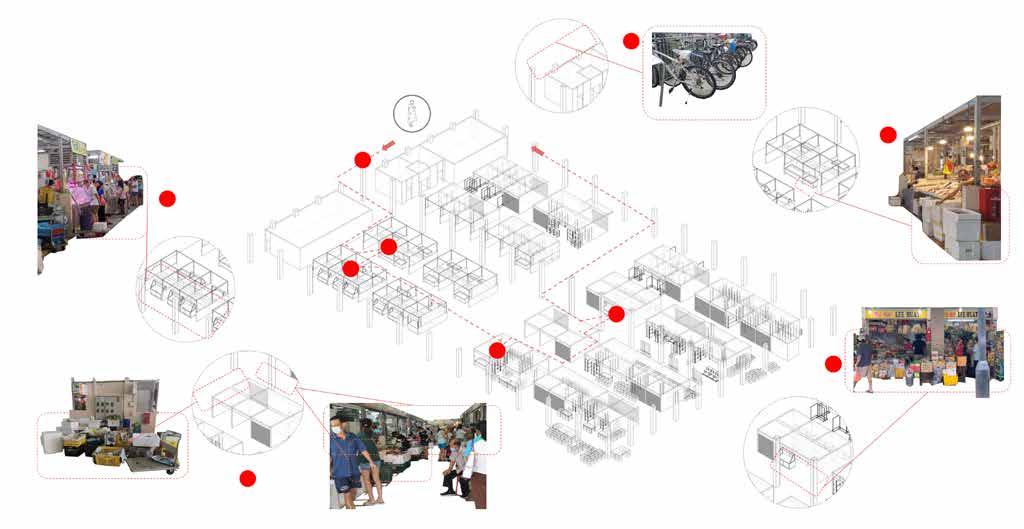
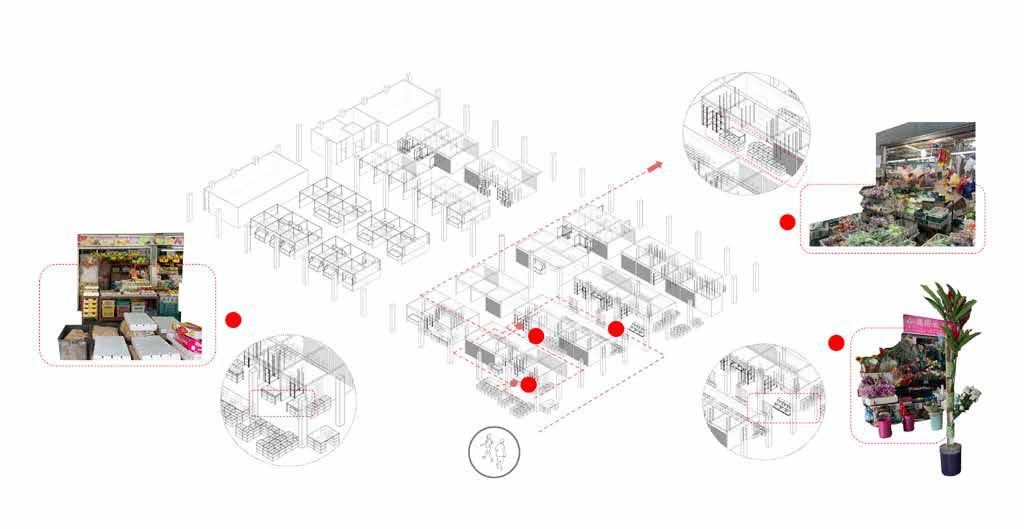
The pandemic has created a sense of social displacement by restricting regular social interactions to reduce the spread of infection. The Whampoa Wet Market is a crucial space as many livelihoods depend on it: serving to provide daily necessities and social activities for residents, visitors, and vendors alike.
This project aims to retrofit the Whampoa Wet Market for the residents, visitors, and vendors to bring back the market culture while introducing pandemic ready interventions as the new norm.
STORE MANAGEMENT
Worried about decreasing sales from competition from supermarket chains as well as the pandemic
Interested in upgrading his store to attract new customers, but not sure about where to start
PAIN POINTS
Physical:
Lack of sanitising space near his store
Fishes are exposed and can be contaminated by coronavirus
Psychological:
Insecurity from decreased sales of goods as less customers come to shop
SHOPPING HABITS
A frequent regular around Whampoa Hawker centre, acquainted with many vendors
Sometimes visit supermarket for a change in experience and cheaper deals
Orders takeaways from hawker center when she does not feel like cooking
PAIN POINTS
Physical:
Long waiting time at popular stalls, need to queue in the midst of cramped conditions.
High risk of transmission when patronising at the wet market
Wishes to quality check before buying but reluctant to do so due to covid-19
Psychological:
Strong sense of displacement without an active community,

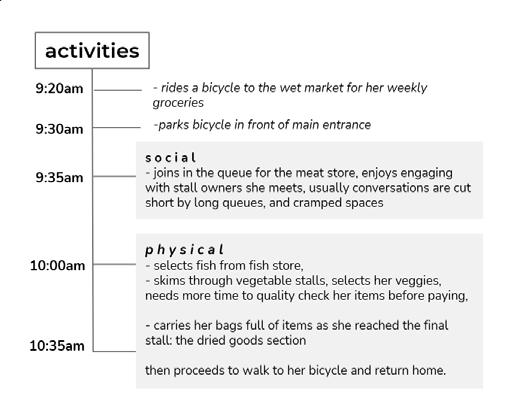
SHOPPING HABITS
Regularly visit supermarket for a week’s grocery, sometimes visit wet market for goods forgotten to buy at supermarket.
Recently she is starting to try out online shopping due to the pandemic
Cooks for her family at least twice a day, sometimes order from hawker center or go to restaurants for a change
PAIN POINTS
Physical:
Wishes to quality check before buying but reluctant to do so due to covid-19
Psychological:
Increased strain on her body: coming to the wet market less frequently and buying more in one trip
Fear of transmission: spends less time dwelling in wet market spaces, goal is to purchase and leave quickly

SHOPPING HABITS
Prefers online shopping due to its convenience
Likes visiting the supermarket with friends after work for some groceries
Rarely visit wet market
Mainly take-away from or eats at Whampoa hawker center, sometimes cook at weekends but prefers simpler recipes
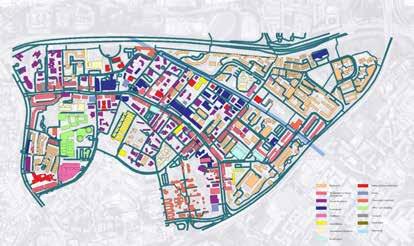
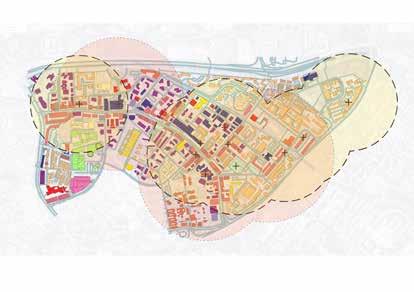
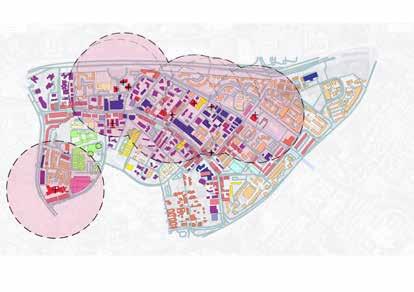
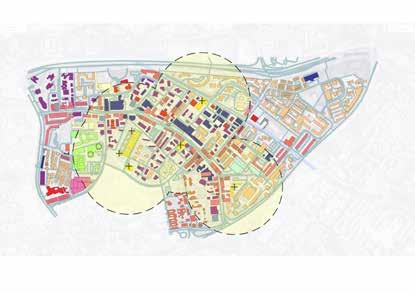
Landuse map shows current uses of land in Balestier sub planning zone
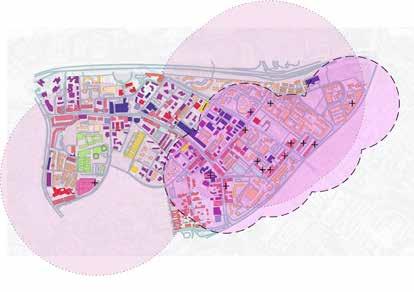
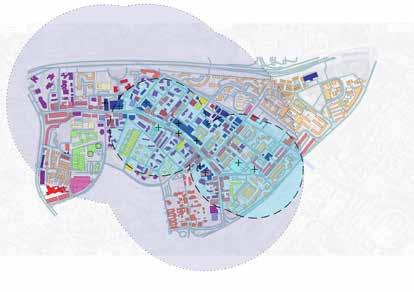
Catchment area maps highlight the uses of space by different empathy map users in the Balestier subzone.


ALL 4 USERS: essential goods
PAIN POINTS
Physical:
Hard to navigate through market goods with minimal physical contact with anything
Online deliveries take time to arrive
Psychological:
Afraid of contracting the disease from the crowd at the market
-closest supermarket -chain and mini marts

ELDERLY/HOMEMAERS: places of worship
-catchment areas for different religious associations < 300 m
ALL 4 USERS: health care
-main hospitals and dedicated medical facilities < 500m -clinics and convenient medical services < 300 m
ALL 4 USERS: main eateries -commercial
ELDERLY -social welfare < 300 m
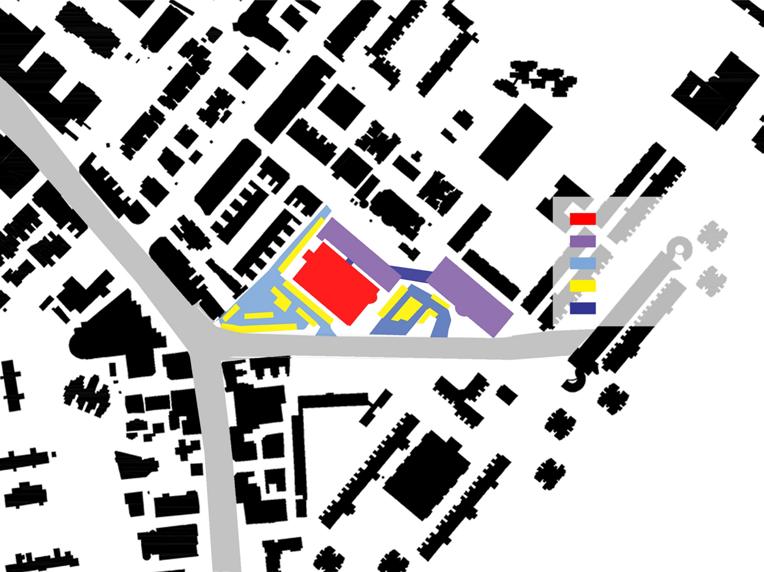
North West Entrance
Visitors from wet market car park at the back of the wet market Pedestrians walking from along Kim Keat Lane
South West Entrance
Visitors from wet market car park (non-Whampoa residents, nearby private estate)
Pedestrians from bus stop/shophouse/commercial area alongside Balestier Rd
North East Entrance
Visitors from both hawker centres, neighbouring HDBs, mainly pedestrians by foot
Usually entering from the sheltered linkway or the open entrances
South East Entrance
Visitors from main hawker centre car park on the right, and pedestrians from HDBs in the direction of South East
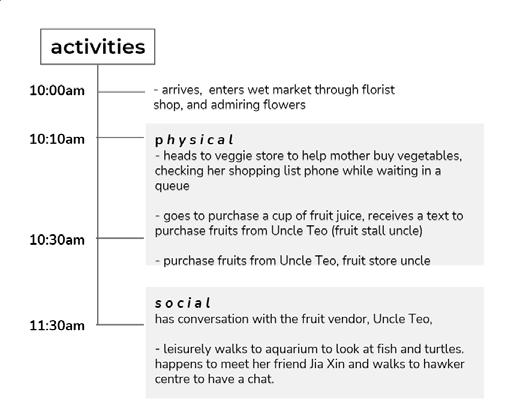
Usually entering through the florist shop entrance, coming over from hawker centres
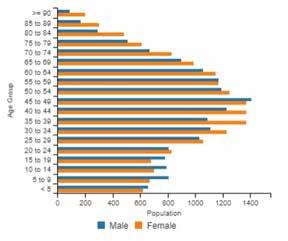
DEMOGRAPHICS
age group of residents
higher percentage of older residents: highest percentage age group is 50-54 year old)
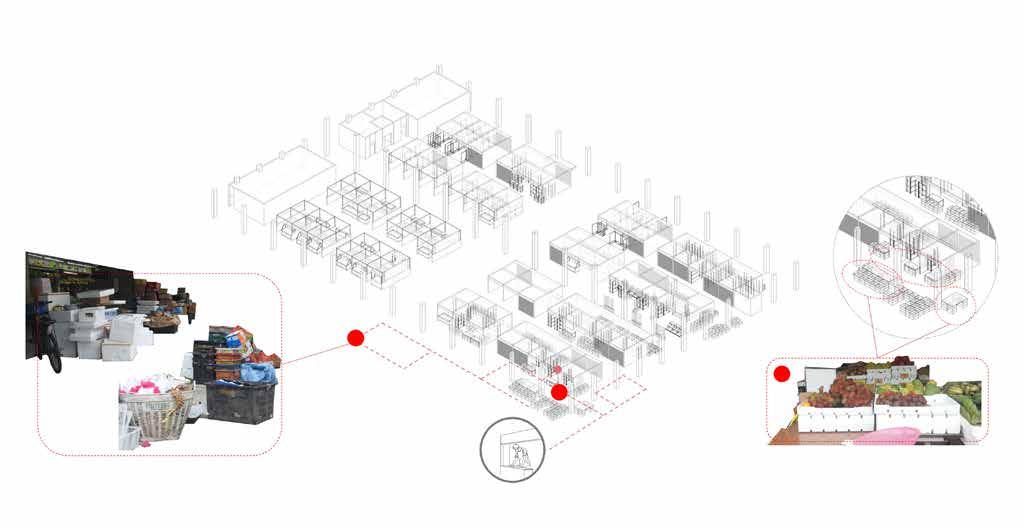

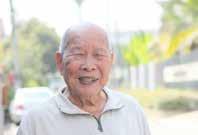
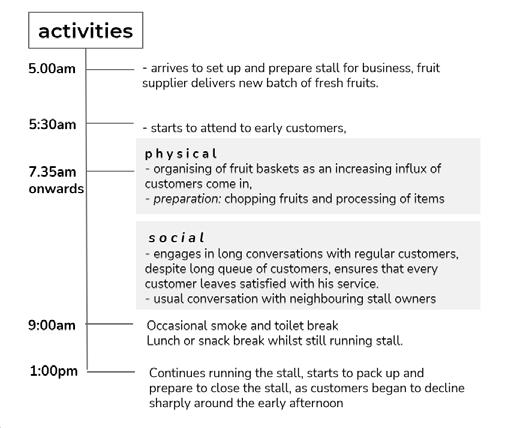
UNCLE TEO male, 58
He is the fruit store uncle, and has been running his fruit store for over 7 years. He works daily from 5am to 2pm, and rests on sundays.

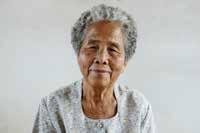
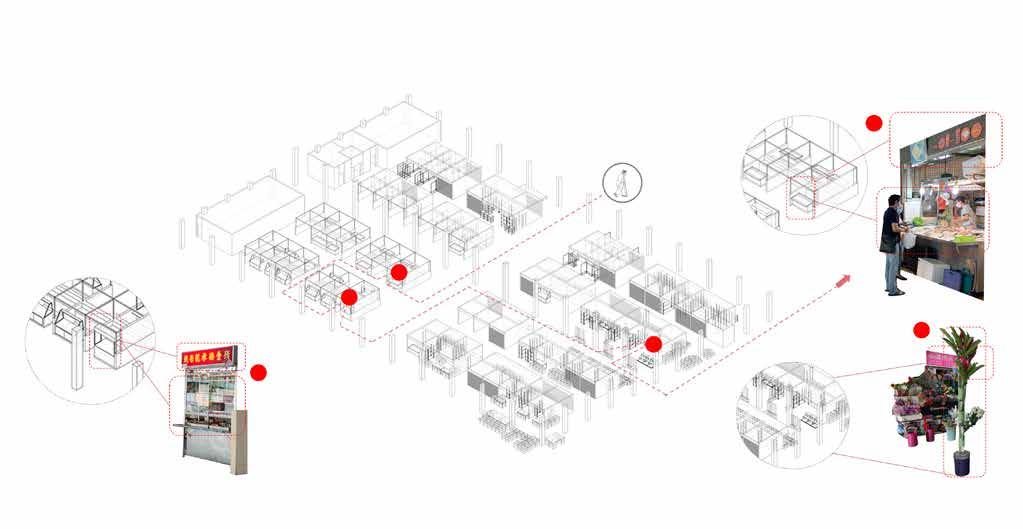
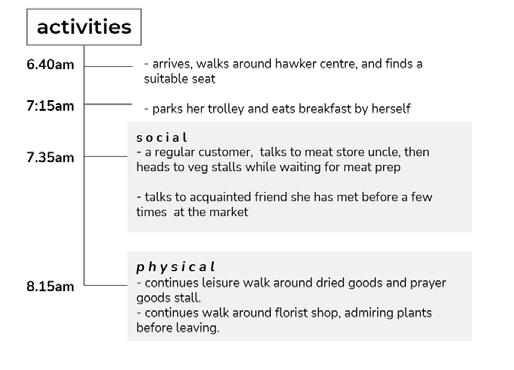
AUNTY TAN female, 65
She has retired, and has lived alone in a three room HDB in Whampoa for more than 30 years. She is a frequent regular around Whampoa Market and Hawker Centre in the morning.

MDM NG female, 46
She is a housewife and has recently moved to a 5-room HDB in Whampoa. She has 2 daughters in primary school and 1 son preparing for O’levels.

ASHLEY female, 16
She is a Saint Andrew’s Junior College J2 student. She lives in a 4-room flat in Whampoa with parents and younger brother.
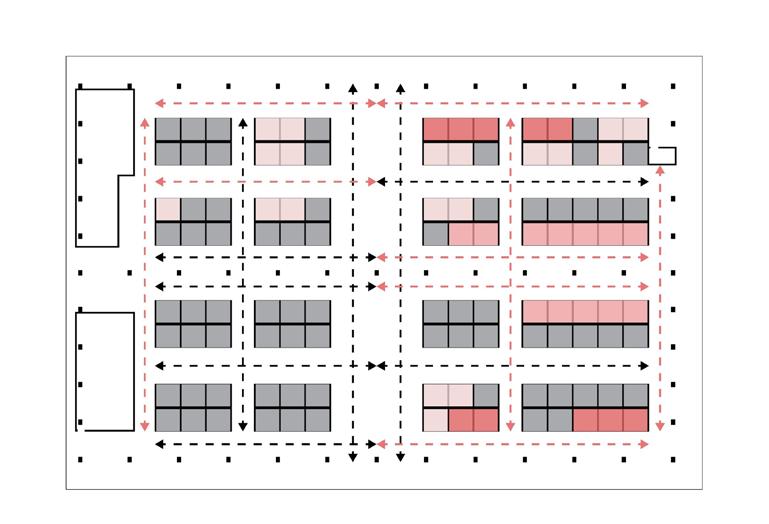
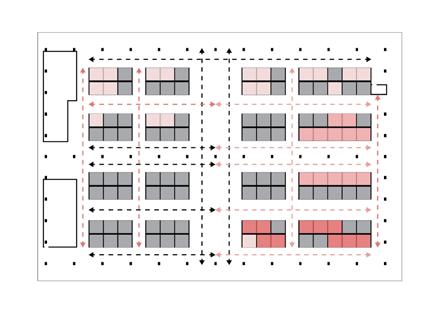
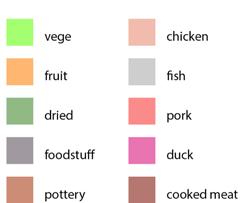
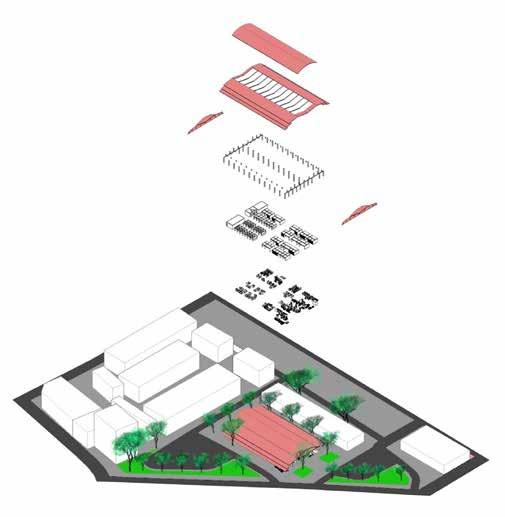
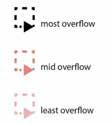
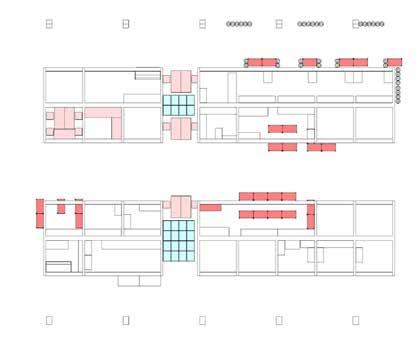
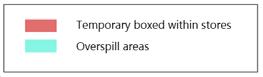
Dispersing store overflows (final)
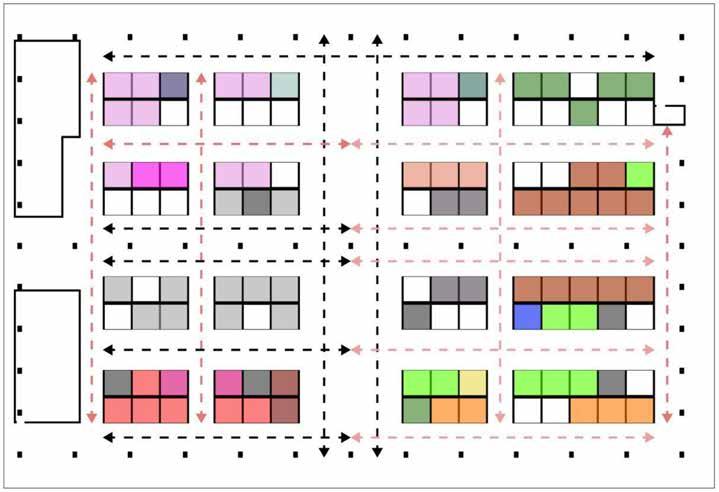
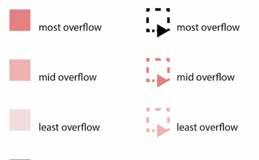
The intervention began with evaluating the amount of overflow display each stall had, and the average time that patrons remained at stalls during their visit due to congestion arising from overflowed goods. This arrangement will disperse the congestion and speed up circulation, hence allowing for patrons to adhere to social distancing guidelines better.
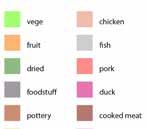
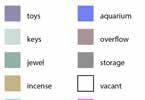
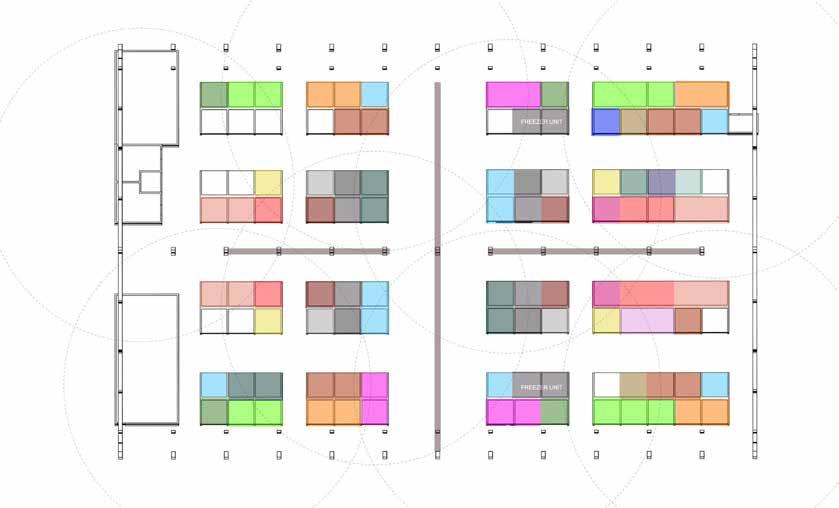
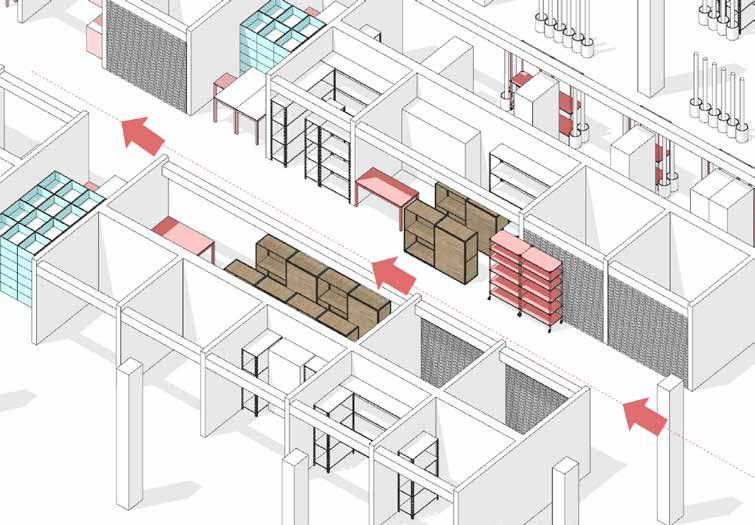
Internal space of the marketspace is dissected into ‘Micro-Districts’, where each quadrant of the wet market consists of every stall type, hence reducing distance between purchases. Sanitizing stations will be located within 10m from any point in the marketspace due to the current lack of public hand washing stations within the marketspace.
However, this fails to consider deliveries that occur daily, and users will be forced to pace the marketspace many times over- Therefore it is not operationally viable.
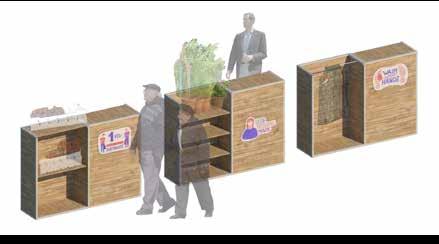
These stalls feature pre-packed produce displayed on shelves, and patrons who require to purchase them may pick them up, and pay for them quickly. This idea will reduce the amount of contact visitors have with each other and reduce congestion within the marketspace circulation.

Ventilation to be incorporated in the ceiling, can be air-conditioned or to be naturally ventilated.
All-in-one, wash, dry & sanitize faucet to reduce clutter of machines.
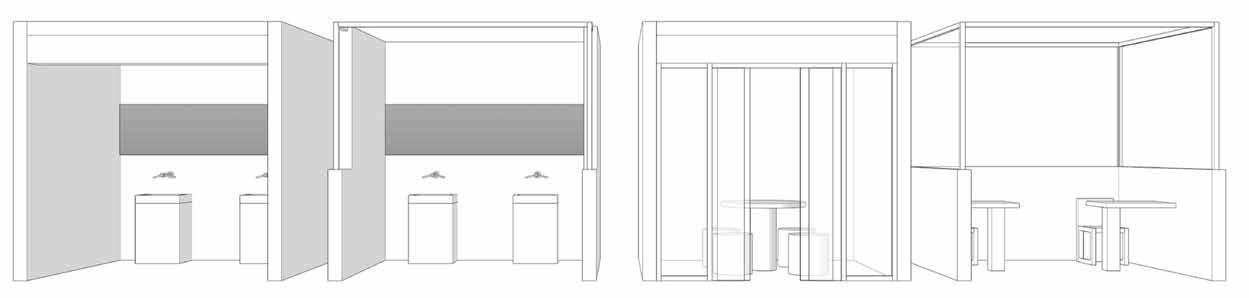
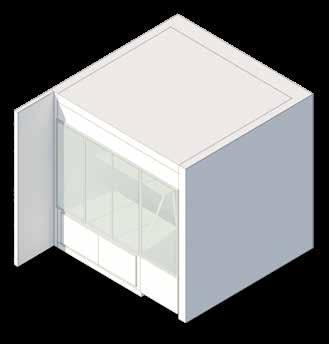
Transparent glass partition that will turn opaque when occupied.
Simple checkered round table to evoke the sense of familiarity (to the elderly) of a void deck.
Solo table seating for stall owners to consume their lunch while watching their stalls
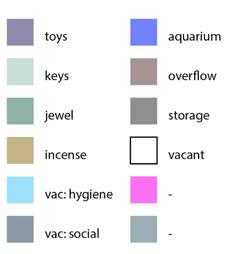
The next intervention is to retrofit the currently vacant stalls to provide sanitization stations, social interaction space for smaller groups, and a safe space for resting.
BEFORE
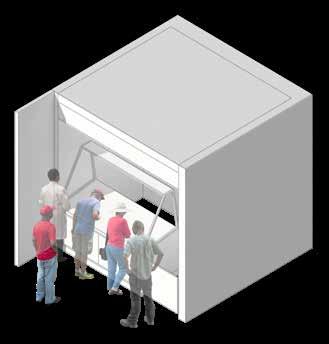
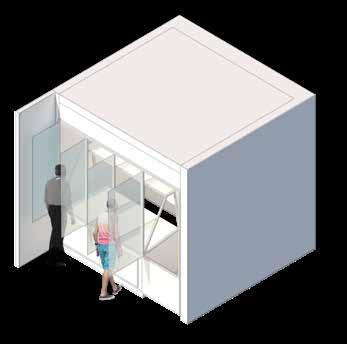
Partition to separate the shoppers, to give them personal space as well as to ensure safe distancing which reduces the congestions in front of the stall.
Serves as another form of the original
Plexiglass Window Shutter System (final)
A plexiglass window shutter system is also introduced for stall fronts which may be swung open during operation, and will lock into place, doubling as a clear divider to organize patrons and to limit cross infectivity.
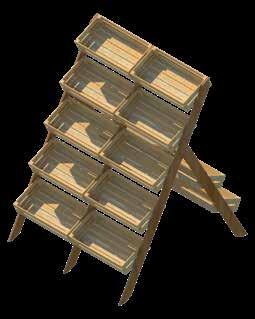
The first attempt is a collapsible A-frame system that allows produce to be displayed without overflowing into the communal walkways.
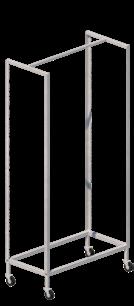
The next attempt is a modular system that allows for versatility in its make up, so each display is better suited for each use case. This modularity promotes ease of fabrication, maintenance, and portability.
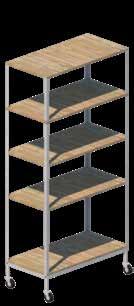
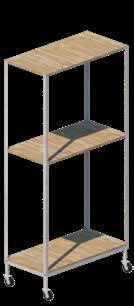
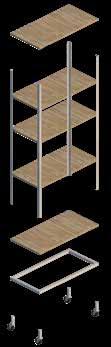
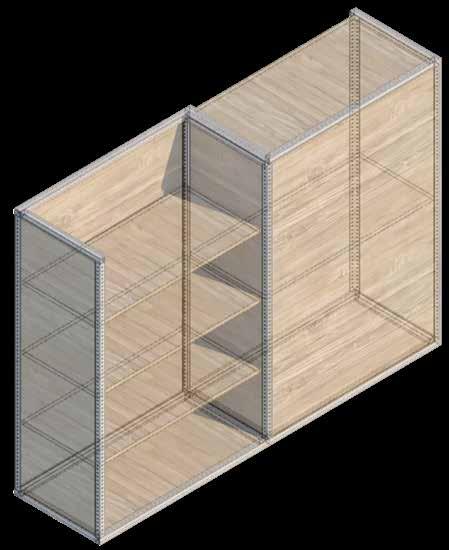
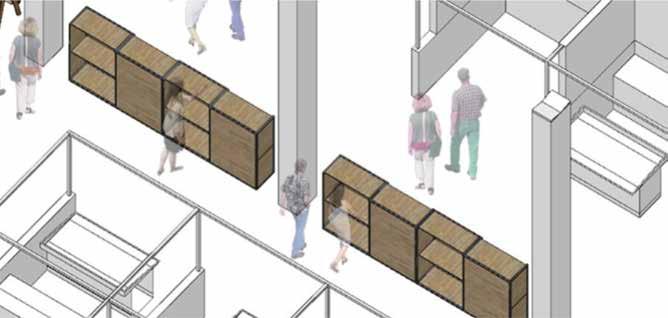
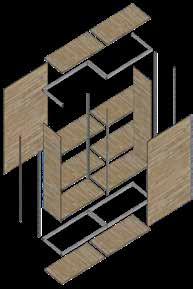
The final intervention seeks to provide a vertical shelving display to the stall owners. These shelving systems also double as barriers to organise visitors into and around the wet market, reducing cross paths during their errands.
This implementation will benefit the visitors regarding their safety and quality of visit, while providing safer and more efficient ways of operations for the stall owners in Whampoa Wet Market.
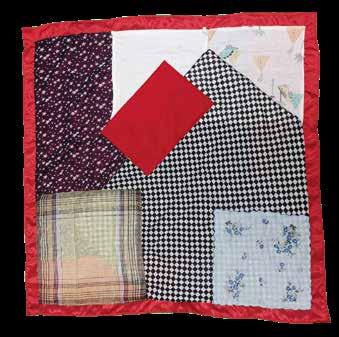
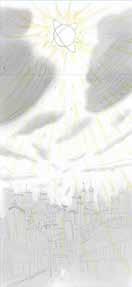
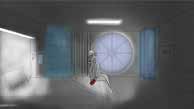
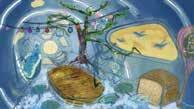
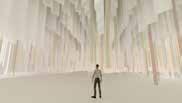
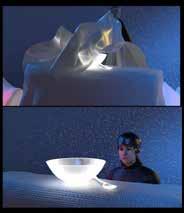
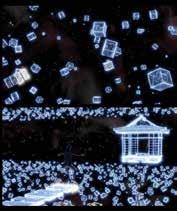
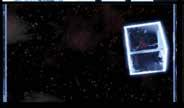
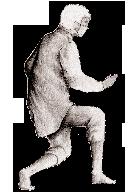
This is a conceptual project exploring the soft material of wax as it wanes and resolidifies leaving impressions and shifting perceptions of light, warmth and proximity. The interface tethers between interior and exterior, past and future, the individual and himself, appearing as both a veil and a mirage of images.
The element of heat is exagerrated as a driver to experiment with the extremity of temperature in developing a barrier separating two bodies displaced spatially and temporally.
The interface embodies as a lens, distorting, deforming, fragmenting and reconstructing realities, serving as a conduit and mouthpiece between mutiplicitous futures and unreliable memories of a bygone past.
As clarity grows, deception morphs into intrigue, and the characters’ intentions are reframed. The project’s themes jostle with the ideas of human empathy and identity, and the pretense of memory.

Youngwon Year 2020
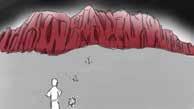
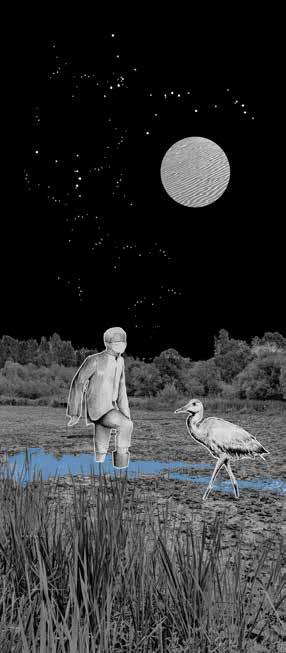
Theappearanceoftheveilwasreportedandmonitoredbythenewsforthepast 3 weeks. Fringe groups have live broadcasted their escapades near the veil, exploiting its appearance through controversy theories and sensationalist tactics.
A recent video piqued my interest as I was drawn in by the warm hues emanating from my screen on the other side. I felt, more than intrigued, perturbed by the thought of what its appearance meant, how it appeared and who placed it there,ifanyoneorthingatall.Thesegrowingfrustrationstoquelmthesequeries nudged me further and further on as I waddle through the swampy marsh lands towardsthebeckoningcurtainofwarmth.
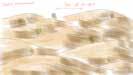
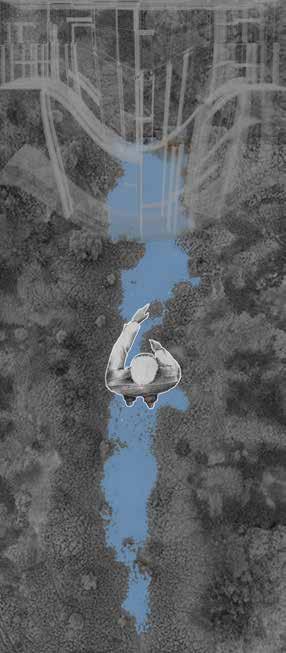
Elden Year 2053
It has been 7 months since the white out and the emergence of multitudes of new volcanic activity around the globe. The mirage had appeared just 5 weeks priortoitsdiscoveryinthewasteland.Afellowstragglerwhointroducedhimself as Chidi told me about the swap that his niece had made with the other side. There is no way to know for sure that it was true, or that she really made it, or whatwasevenwaitingforherontheotherside.Whateveritis,ithadtobebetter than what awaited us here in the ravages of decimation. Rations have dwindled to a swaddle of food capsules, many of which, whose seals have begun to ashen and sweat from the exposure to the recent passing heat wave. We know we are all just biding our time, perhaps even hoping for a quick release from this oven. Daylighthaselongatedto52hoursandhomeostasisseemstohavelongpassed itsbandwidthofcontrol.YetsomehowIamstillclingingontothelastvestigesof rationalityandmyfaintsliverofhopeasIapproachthewall.
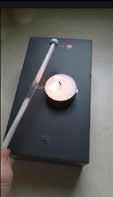
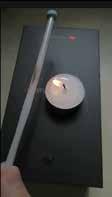
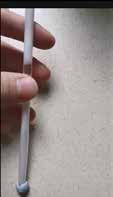
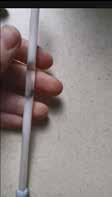
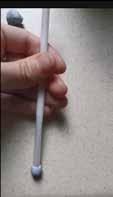
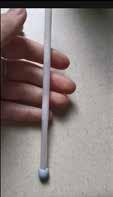
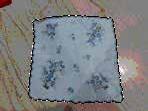
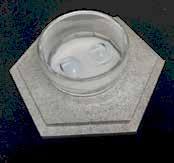
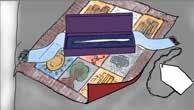
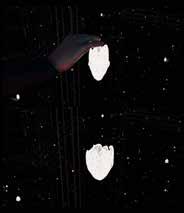
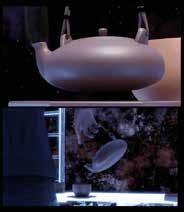
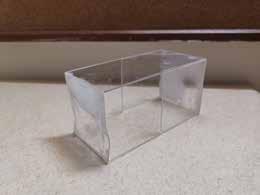
(Left) Wax at room temperature is an opaque white solid. Upon heating, it slowly melts in to a colourless transparent liquid. Melting point of wax is around 46-68 degree celcius. When touching the tube filled with melted wax, wax tranforms back to white opaque solid again.
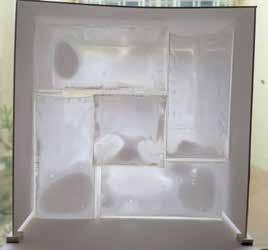


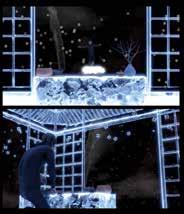
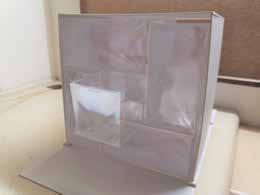
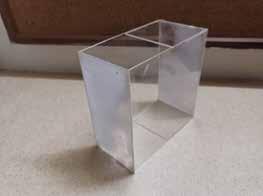
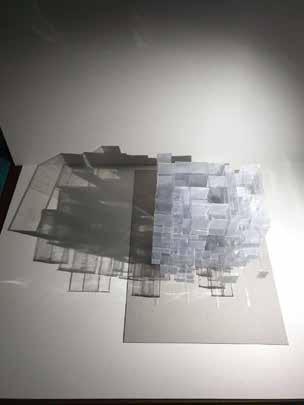
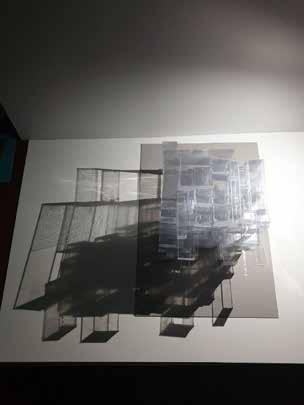
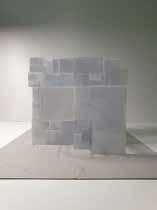
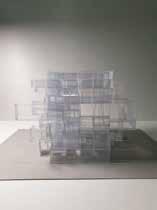
(Left) By filling wax between two pieces of acrylic sheets, an opaque white panel is created at room temperature.
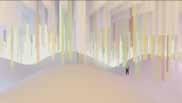
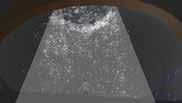
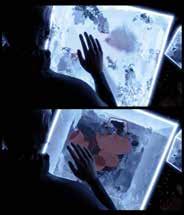
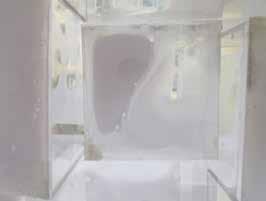
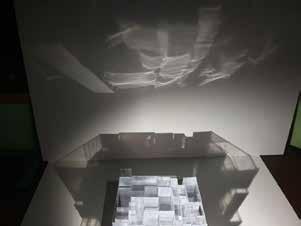
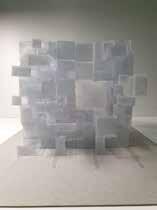
When the wax panel is heated beyond its melting point, it gradually clears and become transparent. During the process, opaque white solid wax coexists with transparent melted wax, creating a cloud-like visual effect.
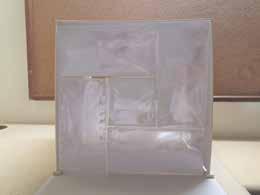
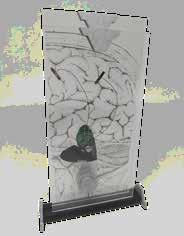
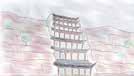
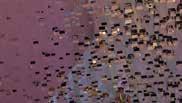
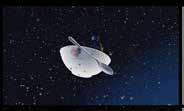
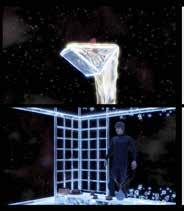
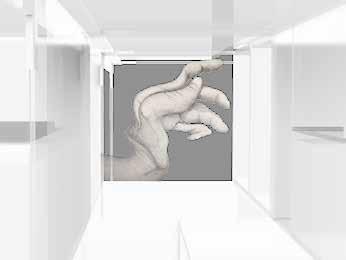
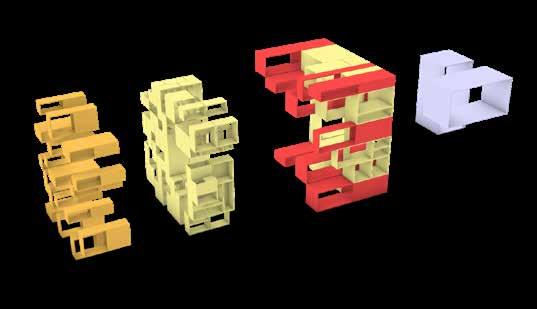
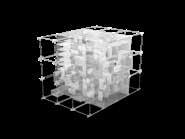
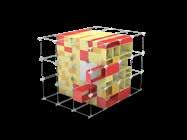
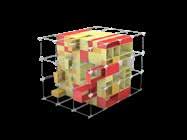
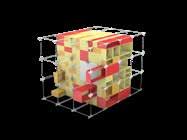
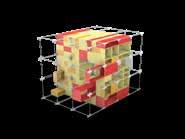
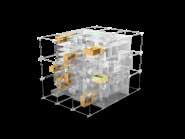
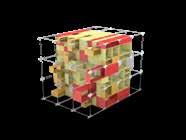
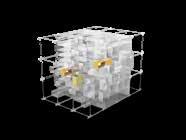
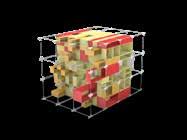
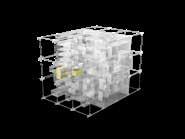
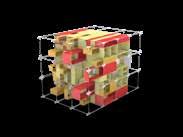
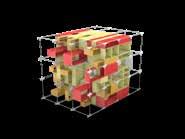
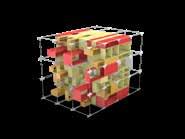
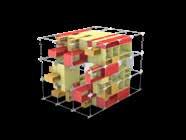
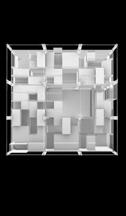
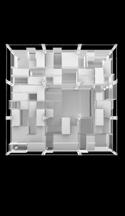
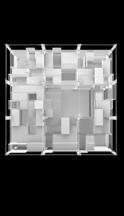
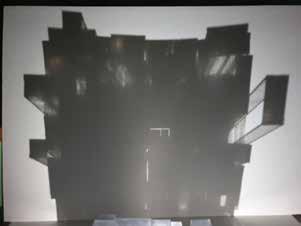
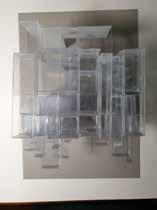
(Right) In the first iteration, front and back faces of the boxes are made of wax panels. Five of them form a wall-like structure, separating hot and cool sides. By pushing and pulling the boxes, heat can enter some boxes, turing these boxes transparent.
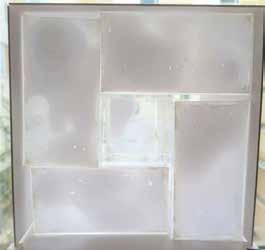

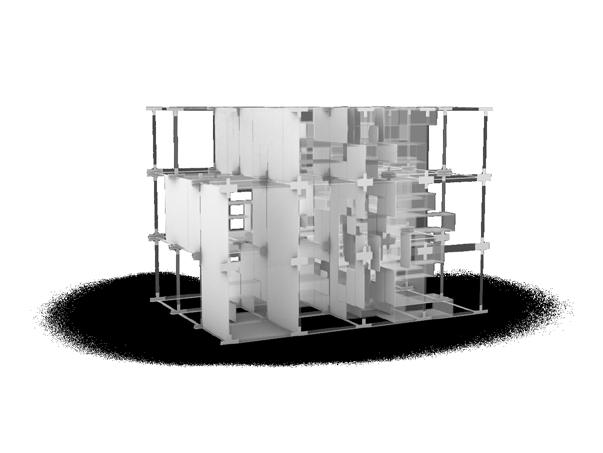


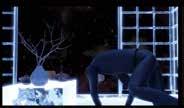
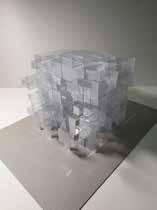
All modules are cuboid-shaped that can be pushed and pulled along the grid, creating space for movement .
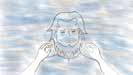
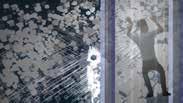
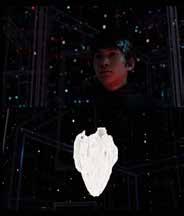
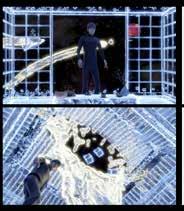
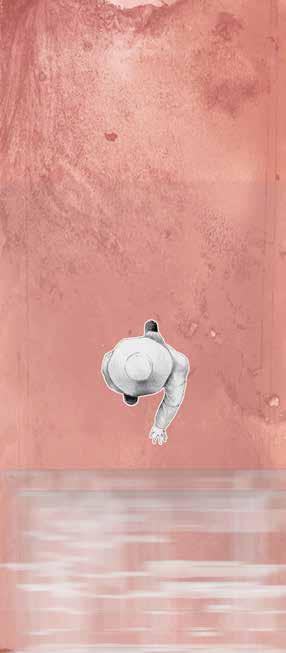
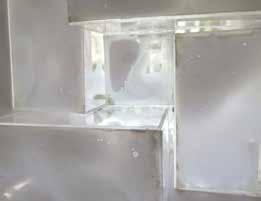
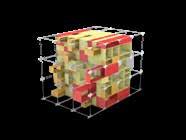
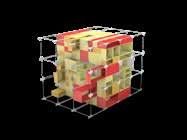
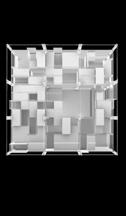
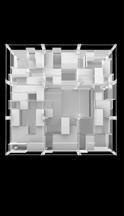
Wax panels that turn transparent due to high heat would turn back to opaque upon contact with human body temperature, thus allowing Elden to communicate with Youngwon by leaving white handprints on transparent wax panels.
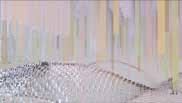
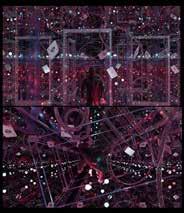
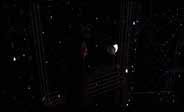
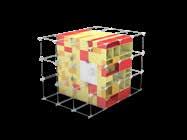
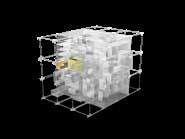
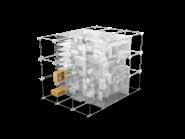
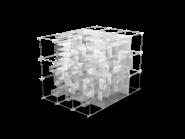
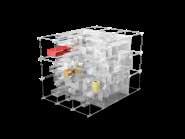
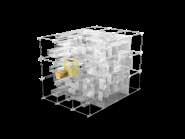
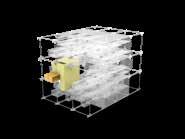
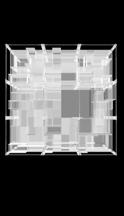
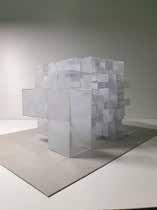
When wax panels turn transparent due to heat, they become filled with liquid that refract light and distorts vision through them, symbolising distorted memories of the past.
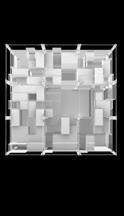
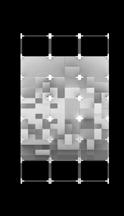
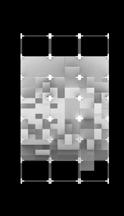
Since some wax panels turn transparent and some not, Elden is only able to see a fragmented image of Youngwon’s body through transparent panels, which symbolises one’s fragmented memories of the past.
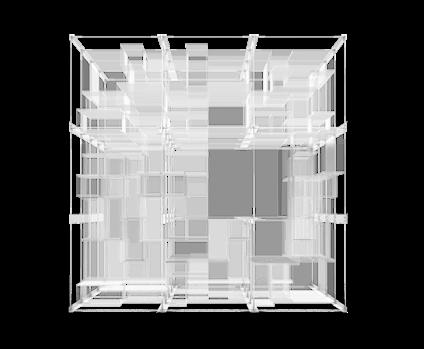
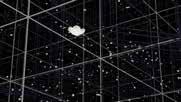
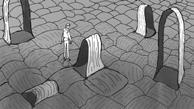
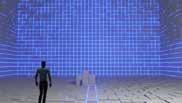
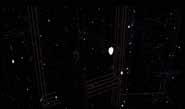
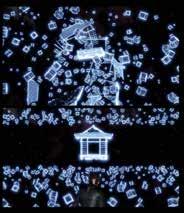
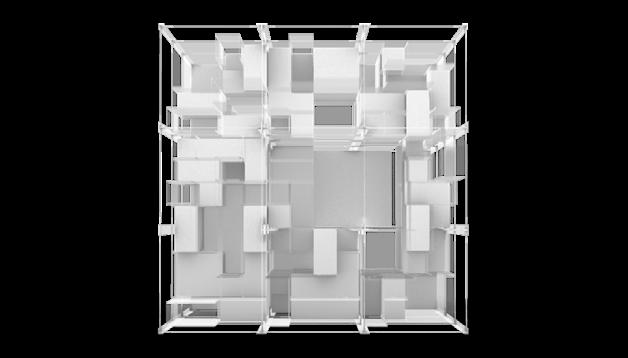
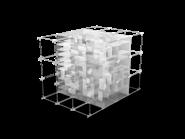
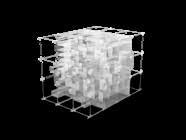
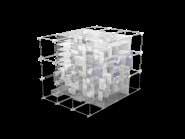
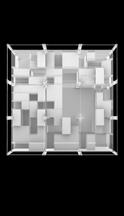
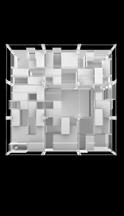
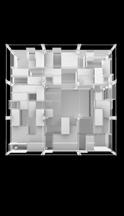
When all the wax panels turns transparent, the world shows itself as a grid where everyone’s positions in past and future are all marked by coordinates on a cartesian grid, which manifests itself at the threshold of past and future where the wall is.
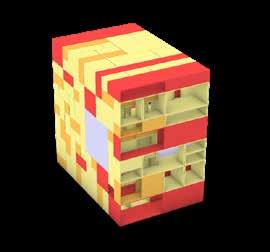
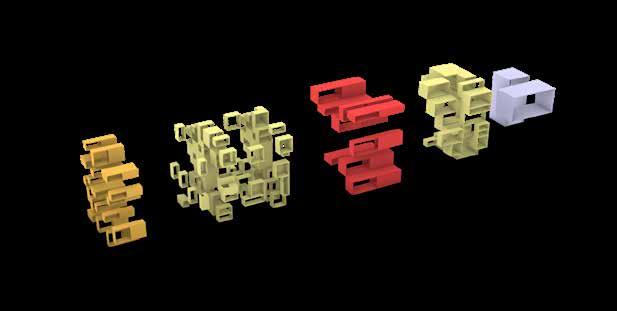


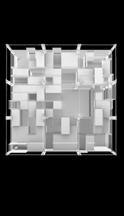
2-layer module
Allow viewing through 2 layers of modules. So that Elden and Youngwon can see the other side’s environment without entering the wall.
1-layer module
Allow viewing through 1 layer of modules. So that Elden and Youngwon can see each other when Youngwon enters the wall and moves to in-between layers.
Half Layer Module
Turns transparent when pulled out by Elden, but does not allow Elden to see through since there is always at least another opaque half module behind.
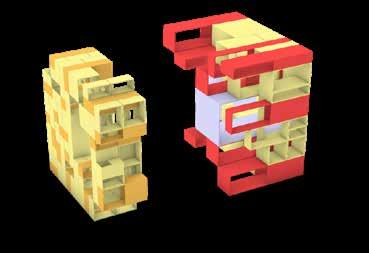
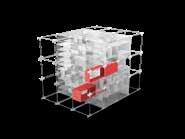
Key module-centerpiece Centerpiece connects two layer horizontally, thus is essential in allowing Youngwon to move through the wall.
Key module-centerpiece Centerpiece connects two layer horizontally, thus is essential in allowing Youngwon to move through the wall.


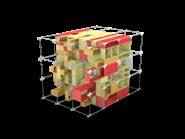
9. Youngwon pulls out second key module and crawls into centerpiece
6. Elden pulls out more modules, leave handprints and try to see cool side
7. Youngwon pulls out first key module to enter centerpiece
8. Elden pulls out more modules to leave handprints and try to see cool side
10. Youngwon enters in-between layer, Elden see distorted fragments of Youngwon’s body

11. Elden pulls out more 1-layer modules and see more distorted fragments of Youngwon’s body
12. Youngwon moves back module overhead to create headspace
13. Youngwon pushes more modules, able to see hot side and distorted image of Elden
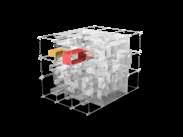
14. Elden pulls out more modules, able to see more distorted fragments of Youngwon’s body
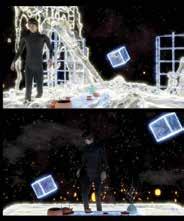
15. Youngwon moves towards exit, the wall starts to turn transparent, Elden recognises that Youngwon is his younger self
16. Youngwon enters hot side from exit, heat penetrates whole structure, everything turns transparent

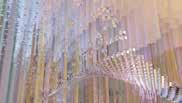
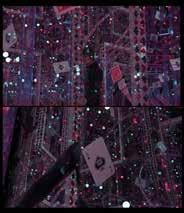
PERSPECTIVE FROM ELDEN’S SIDE


90 DEGREE OBLIQUE FROM ELDEN’S SIDE


LEFT: COMBINED DRAWING BELOW: 1:10 MODEL


ARCHITECTURE | PROGRAMMING | DESIGN