February, 2022 MTD
MARKET UPDATE February, 2022
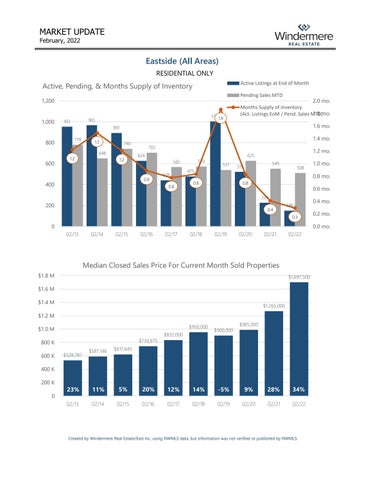
Eastside (All Areas) RESIDENTIAL ONLY
Active, Pending, & Months Supply of Inventory
Active Listings at End of Month Pending Sales MTD
1,200
1,000
800
600
1,0011.9
965
951
2.0 mo. Months Supply of Inventory 1.8 mo. (Act. Listings EoM / Pend. Sales MTD) 1.6 mo.
891 778
1.2
1.5
1.4 mo.
740
648 1.2
702 624
0.9
400
570
565 438 0.8
1.2 mo.
625 537
475
549
519
508
0.8 mo.
0.8
0.8
0.6 mo. 224
200
0.4
148 0.3
0 02/14
02/15
02/16
02/17
02/18
02/19
02/20
02/21
02/22
Median Closed Sales Price forCurrent CurrentMonth Month Closings Median Closed Sales Price For Sold Properties
20 $1.8 M
$1,697,500
$1.6 M $1.4 M
$1,265,000
$1.2 M $950,000
$1.0 M $739,975
800 K $528,787
$587,146
$617,645
11%
5%
$832,000
$900,000
$985,000
400 K 200 K
0.4 mo. 0.2 mo. 0.0 mo.
02/13
600 K
1.0 mo.
23%
20%
12%
Year Rank (Multiple Items) 0 Current Year Month Yes Year Month 02/13 02/14 Parell 02/15 02/16 Match? 02/17
14%
-5%
9%
28%
34%
02/18
02/19
02/20
02/21
02/22
Created by Windermere Real Estate/East Inc. using NWMLS data, but information was not verified or published by NWMLS.