
An examination of data use and communication:
Analysis of Selected 2023 State of the City Addresses


Executive Summary
This study examined how mayors incorporated data into their 2023 State of the City (SOTC) addresses, analyzing 32 speeches from cities that have participated in the Bloomberg Philanthropies City Data Alliance, as well as those who have achieved What Works Cities certification.
Overall, we find that, while mayors frequently referenced data in their SOTC addresses (specific statistics, generalized trends, anecdotes, and datadriven programs), there is less evidence of deep data analysis, and intentional data-driven decision making. Public safety and housing were the topics most associated with data use, with some instances of disaggregated data use (examining data for specific sub-populations) observed in housing and economic development discussions. Notably, the prevalent themes of community engagement as well as equity and inclusion generally included less corresponding data support.
As these speeches are moments for mayors to lay out their goals and progress on key initiatives, SOTC addresses could be strengthened by leveraging data to justify goals by highlighting trends or problems, tracking progress on existing goals using data-driven metrics, and setting measurable goals with clear benchmarks for success. Overall, aligning mayoral priorities with data and using analyzed data to establish needs, measure progress, and communicate achievements could significantly enhance the impact of SOTC addresses.
The following report presents an analysis of the use of data within State of the City (SOTC) addresses given by mayors in 2023. As these speeches tend to be a public-facing opportunities for city leaders to measure and comment on progress toward stated goals and objectives, they are a also prime opportunities opportunity to demonstrate a datadriven approach to the identifying issues, designing solutions, and monitoring progress.
For this analysis, we first examined SOTC addresses from cities that have received What Works Cities (WWC) certification as of Spring 2023. In order to obtain What Works Cities certification, a city needs to demonstrate capacity across several criteria related to the careful and deep use of data and datadriven decision making, including nine different data management criteria, five performance and analytics criteria, as well as a specific leadership and
capacity criteria requiring that “Your mayor and/or chief executive(s) and city leaders regularly use data and evidence to publicly communicate investment or policy decisions and impact of government, and/ or stories of progress made as a result.” Due to these criteria, we might reasonably expect certified cities to show greater use of data and evidence of datadriven decision making in their SOTC addresses. In addition to certified cities, a select group of cities that participated in the Bloomberg Philanthropies City Data Alliance were also included in this analysis, as this program specifically seeks to work with mayors on improving citywide data practices and culture.
Altogether, SOTC addresses from 32 cities were transcribed and coded for topics covered as well as the use of data and evidence of data-driven decision making.


Methodology
As noted, this analysis drew on SOTC addresses from WWC certified cities, as well as a selection of alumni cities from the Bloomberg Philanthropies City Data Alliance. This approach aimed to make the findings directly applicable to understanding evidence of mayoral data use in public speeches, and to potentially uncover unique ways mayors use data.
We generated a list of all cities that fit this criteria, and then sought publicly available recordings (audio or video) of each city’s SOTC address. This involved checking different online sources, including city websites, official YouTube channels, and news archives. Altogether, we were able to locate 32 SOTC addresses that fit our criteria in 2023.
Addresses delivered as videos were converted to audio files, and then all audio files were transcribed using a combination of Otter.ai and Microsoft Word Online to produce written transcripts. Each transcript went through a rigorous transcription and verification process, ensuring accurate conversion of spoken words into written text.
To systematically categorize how data were used and the main themes in the SOTC addresses, we built a coding system. This system acted as a standardized framework for understanding how mayors incorporated data into their speeches and the specific topics that dominated their SOTC pronouncements. The coding system included two main categories:

Data Use Codes: These codes captured the various ways data were referenced in the speeches. Examples included specific data points mentioned (data cited), general data points presented (data mentioned), using the concept of data without specific points (data anecdote), and mentioning a city-managed statistical program (stat program mentioned).
Topic Area Codes: These codes categorized the subject matter discussed by the mayors during their SOTC addresses. Examples included housing, public safety, economic development, and community engagement.
The transcribed SOTC addresses were then uploaded to MaxQDA, a specialized software program designed for qualitative data analysis. A qualitative researcher then used the coding system to systematically code each speech for topics covered and use of data. Using MaxQDA allowed for efficient and accurate data analysis, enabling the research team to identify emerging patterns and trends in how mayors used data within their SOTC speeches.
The next stage involved a rigorous analysis of the coded data. The research team delved into the findings, searching for patterns and trends in how data were used by the mayors, through focusing on code cooccurrences. Co-occurrences examine two or more sets of qualitative coding structures being employed to
examine document(s). In the case of this analysis, the topic area codes were compared to the data use codes to determine how data were communicated within each topic area.
This round of analysis allowed the team to identify topics associated with greater data use, as well as those demonstrating less use of data or evidence of data-driven decisions. Each set of co-occurrences was individually examined, and the research team evaluated not just whether data were cited, but how these data points were used in the speech’s arguments. Finally, we established an overall sense of data use trends, as well as specific findings related to topics that tend to demonstrate more or less data utilization, or where the approach to data analysis is unique or different.
Data Use Occurrences by City — Top 15
South Bend, IN Detroit, MI Syracuse, NY Baltimore, MD Salinas, CA
Fort Collins, CO Norfolk, VA
San Diego, CA Rochester, NY
Baton Rouge, LA
San Antonio, TX Durham, NC Seattle, WA
Tempe, AZ
Phoenix, AZ

Main Topics Covered
While mayors discussed a variety of issues in their state of the city addresses, a few themes were common across the cities that were analyzed.
Housing is a focus area for many mayors, accounting for 14 percent of the codes applied by topic area. There were a variety of issues around housing raised by mayors, ranging from expanding affordable and green housing stock, to assisting existing residents with maintaining their homes and communities, and finding ways to help the unhoused find housing. As will be discussed below, there was some evidence of data disaggregation when looking at housing specifically.
Public safety is also a key topic in these speeches. Mayors cited federally mandated crime data to illustrate the decreases in violent crime. This was also the place where mayors highlighted their community policing and stakeholder partnerships reduced crime. The federal standardization of public safety data likely allowed for mayors to easily identify local trends and compare them.
Economic development, especially in the context of social and economic recovery after the COVID-19 pandemic, was a major focal point in the speeches examined. Recognizing that the pandemic affected communities differently, mayors took note of the different approaches to economic development needed to aid their own cities. This again allowed for some disaggregation of data to show how cities were improving access, especially around municipal procurement, to minority and women owned business enterprises; fostering local small business growth; diversifying and educating the local workforce; as well as ensuring development occurs equitably and is spread around cities.
Equity and inclusion has become a priority in many mayoral addresses. However, while many mayors mention ways their administrations help make their communities more equitable and inclusive, there were far less data referenced to support this priority, or cited as evidence of particular necessities. Mayors discussed ensuring service delivery can be done in equitable ways; reducing the systemic and generational impact of racism; and ways to make the local government workforce more representative of the residents. While many of these programs may have been announced for the first time, there was rarely any mention of metrics being used to measure progress.
With the passing of the American Rescue Plan Act of 2021, Inflation Reduction Act of 2022, and the Infrastructure Investment and Jobs Act of 2021, there was a historic amount of federal funding available to state and local governments. One area where this was clear from mayoral SOTCs was when looking at how mayors discussed infrastructure. Many discussed how they were able to leverage funds to help maintain aging infrastructure, while being mindful of the future impacts of climate change, and discussed ways in which they are moving their cities forward in a more sustainable and environmentally friendly way.
Evidence of Data Use
Our analysis included 350 separate code applications across the four data use codes employed in this analysis. Considering that just over 30 SOTC speeches were analyzed, we can reasonably conclude that there is evidence of data use in these addresses. Our deeper analysis, however, found that many of these instances of data use took the form of a straightforward recitation of the numbers on a particular topic, and rarely demonstrated evidence of deeper analysis or the use of these data in decision making processes. Often, it appears that mayors are leaving it up to their audience to draw their own conclusions given the numbers presented.
In addition, much of the data cited in these addresses can be attributed to mandated data collection and reporting, such as public safety and policing data. Much of this data is standardized across the country through Uniform Crime Reports and the National Incident-Based Reporting System. This allows mayors to cite similar metrics through their speeches, and to provide comparisons.
“I want to acknowledge the fantastic work of the Salinas Police Department, they have managed to make an arrest or solve 11 out of 13 homicides in 2022; which is an 85 percent success rate. The national average is around 55 [percent], and we haven’t always had it. That’s successful.”
— Salinas, CA
In this example, the mayor of Salinas, CA both presents their individual city statistics and trends around homicides, and also compares these with a national average, encouraging listeners to conclude that the police department has been more effective than the national average when it comes to solving homicides, a trend the city hasn’t always seen. While this is an effective use of specific and comparative data to comment on a trend, it is not directly linked to any specific initiative, nor are metrics aligned to any future goal through which continual progress could be measured.
This is a common trend we found across speeches, in which there is less evidence of specific and targeted
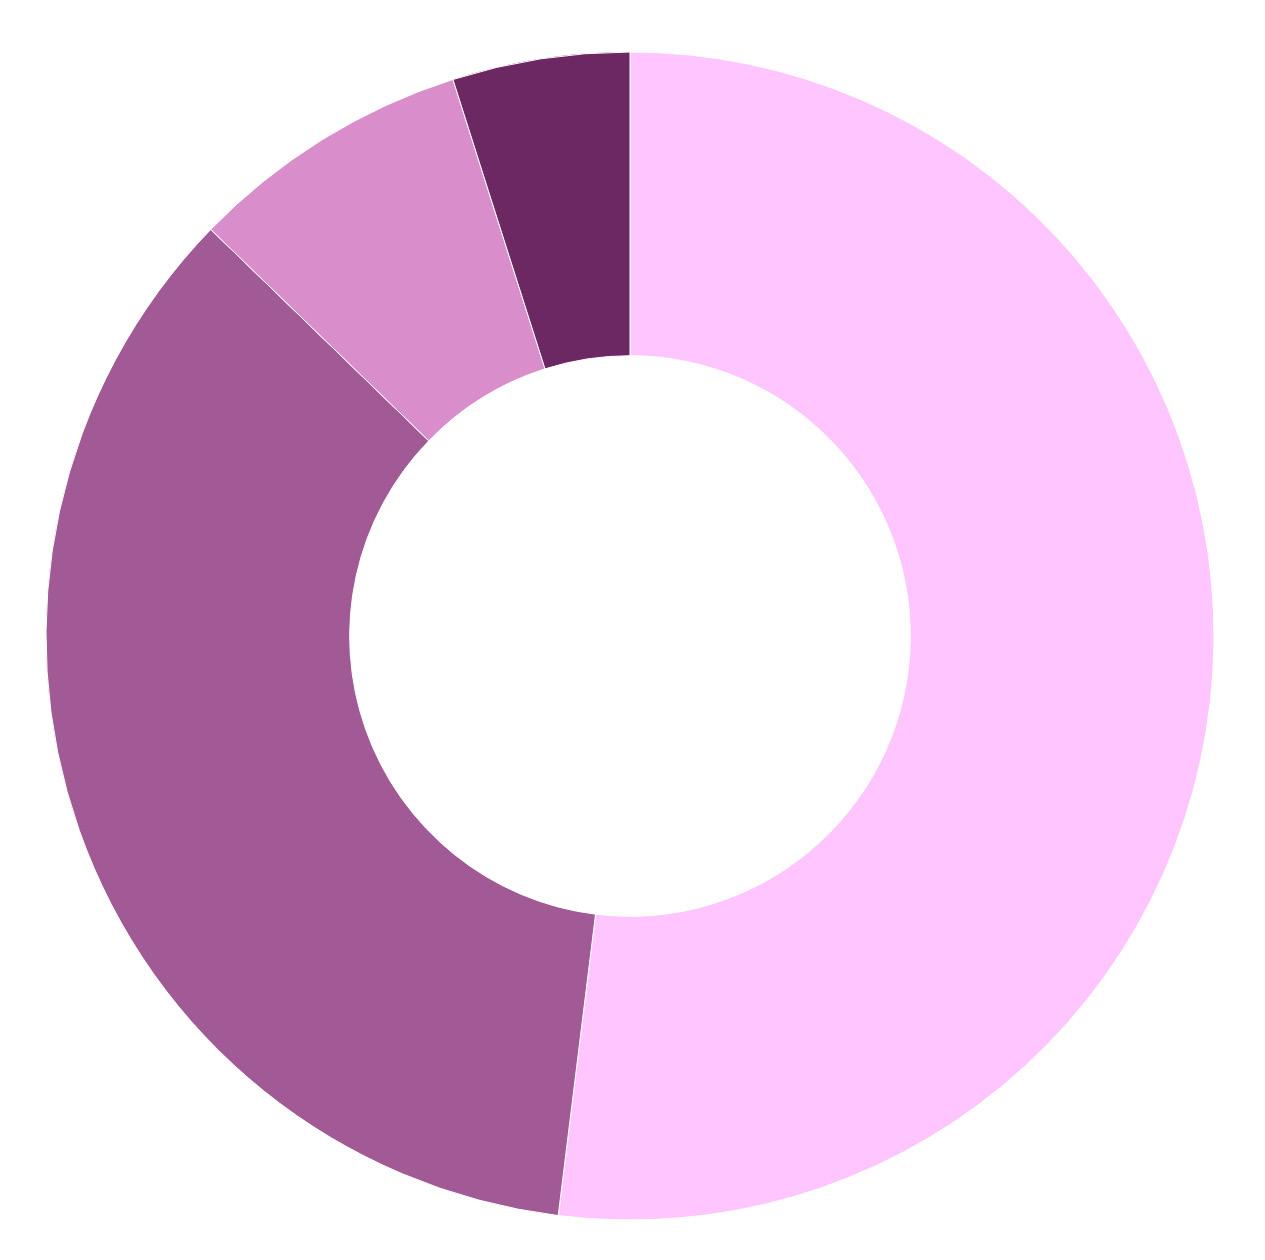
Data Mentions by Topic

data collection and analysis being carried out by cities for particular projects or initiatives.
Despite the limited evidence of deep data-driven decision making and nuanced analyses, there is some encouraging evidence of data disaggregation, especially when it comes to housing and economic development.
“The problem we face is that, for every 10 people we get off the street and into housing, 13 people become homeless – many for the first time…I have also worked with the Housing Commission to ensure that those most at risk of becoming homeless receive assistance and I am pleased to announce the Commission will be doubling the funding of our homeless prevention programs from $2 million to $4 million. This will help an additional 250 households, prioritizing seniors, persons with disabilities, and families with young children. For example, in 2015, we created just 10 new homes through our Affordable Housing Density Bonus program. In 2022, this program created more than 1,800 new homes – about 450 of them set aside for lower-income residents. Overall, in 2022, we permitted 5,000 new homes, and we have another 7,000 currently in the pipeline.”
— San Diego, CA
The above passage from the mayor of San Diego, CA, allows listeners to understand the problem of homelessness, as well as the solutions that the administration is taking to address the problem. The listener understands that the financial investment the city made through its housing bond, helped create new housing opportunities. The specific call-out to how many seniors, disabled people, young families, and lower-income residents are being helped is evidence of data disaggregation.
On the topic of economic development, the mayor of South Bend, IN, comments that, “In 2022, our revolving loan programs financed 22 businesses with nearly $5.2 million of capital – 55 percent are minority owned, 36 percent are women owned.”
This passage similarly demonstrates data disaggregated by race and gender, and allows listeners to understand the impact of the program.
These are encouraging examples of data use and the supporting policy positions with solid numbers. Further moves toward comparing local data with national averages, and also providing some disaggregation, are certainly promising.
Topics with Less Data Use
While we found substantial evidence of data cited and referenced, regardless of level of analysis or program alignment, on the topics of public safety, housing, and economic development, there were several topics that, while popular across many speeches, rarely included references to data: namely community engagement and equity/inclusion. Rather than referencing research, metrics, or measurements, these topics were often discussed with reference to general understandings and commitments to action.
“Definitely, belonging and building community is a broad theme for us. And the city has been very intentional about doing this. And one of the tangible ways that we’ve been doing this is that for the first year, the Office of Equity and Inclusion is up and running, and is working to foster an inclusive community and build relationships. One of the ways we did that was through our proclamations and resolutions, and taking a community centric approach and taking the proclamations out into the community…and celebrating that proclamation. Or we’re also bringing people in for community celebration before a proclamation to create a space for people to meet and greet and celebrate.”
— Fort Collins, CO
While many mayors have incorporated equity and inclusion into their economic development and housing solutions, in general, when mayors are discussing themes around community engagement and equity/inclusion these are framed around program development and program design, without explicit mention of metrics to determine progress toward goals, or evidence of research and data analysis to determine need before programs were designed and implemented.
This is overall unsurprising, as there is far less mandated data reporting around the topics of equity and inclusion and community engagement, and so the burden would be on cities to actively seek out, or even generate, these data themselves.
Recommendations
It is certainly not a requirement for mayors to include data or data analysis in their State of the City addresses. However, as these public facing speeches are an excellent opportunity for city officials to demonstrate the need for their programs and initiatives, comment on progress toward these, and set future goals on which the success of their administration may be judged, it is our contention that carrying all of this out in a data-driven manner would benefit both mayors and their public.
To that end, we conclude this analysis with the following recommendation:
All identified mayoral priorities and topics discussed in SOTC addresses should be supported by data and evidence, and mayors should engage in, and report out on, data-driven decision making processes when taking action on these priorities. Mayors should then use their SOTC addresses as an opportunity to:
• Demonstrate the need or rationale for any programs/initiatives.
• Present analyzed data that explain the specific needs underpinning any program (these may include trends over time, or comparisons with other localities).
• Explain how current or proposed programs and initiatives will specifically address these needs.
Communicate progress and action toward goals using specific metrics.
• Use specific data to demonstrate progress toward stated goals along aligned metrics for success.
Set future goals together with associated metrics and timelines.
• Explain exactly how future initiatives will be monitored, what data will be collected and analyzed, and how success will be measured.
Any mayoral priorities that do not have immediately available associated data should be flagged as areas for the city to intentionally create channels for data collection, review, and analysis. If not already established, regular processes of data-driven decision making should be established surrounding these topics and the city’s approach to addressing them throughout the year, with regular check-points to monitor progress and shift course if necessary. The SOTC address then becomes a time to share this progress with the wider community, and to ensure transparency and trust through openly communicating how progress on new goals will be measured and tracked.
Occurrence Codes
Data anecdote
Data as a concept is presented within an address, but with no actual data point
Stat program mentioned
A specific stat program managed by a city is mentioned within an address
Data mentioned
A generalized data point presented within an address
Data cited
A specific data point cited within an address
Topic Codes 1. Topic area codes
Housing
Public Safety
Economic Development
Community Engagement 6. Equity/Inclusion
Workforce
Public/Mental Health
Sustainability
Recreation and Parks
13. Innovation
14. American Rescue Plan Act of 2021 (ARPA)
15. Artificial Intelligence
Top Co-Occurrences
1. Public safety x data cited 2. Housing x data cited
3. Housing x data mentioned
4. Economic development x data cited
5. Economic development x data mentioned