


LONGBEACHAREA JewishCommunityStudy 2021-22 MatthewA.Brookner,JanetKrasnerAronson,MatthewBoxer,LeonardSaxe, ZacharyH.Seeskin,andDavidDutwin ArtworkbyKESHERAfter-SchoolEnrichmentStudents,Dec2021
PRESIDENT
Dr. Richard Marcus
EXECUTIVE COMMITTEE
Genevieve Brill -Murphy
Sara Brown
Shelley Carl
Dr. Aaron Kern
Richard Lipeles
Anna Salusky
Beth Sterling
Linda Waltzman
IMMEDIATE PAST COPRESIDENTS
Edie Brodsky

Dr. Barry Zamost
CHIEF EXECUTIVE OFFICER
Zach Benjamin
BOARD Members
Alan Brawer

Linda Burney
Joyce Greenspan
Mulu Harrison
Jerry Kaufman
Alan Kreida
Pam Keiles
Seth Linden
Shmuel i Lovitch
Kathy McDermott
Amber Vera Mendoza
Matt Paretsky
Samantha Roberts
Dr. Vicki Scherwin
Ken Schlesinger
Suzanne Wechsler
Ava Weiss
On behalf of the Jewish Long Beach Board of Directors and staff, it is our distinct honor to present the 2022 Long Beach-Area Jewish Community Study, the first such study of our community conducted in over seven decades. The release of this critically important research, conducted by Brandeis University’s Cohen Center for Modern Jewish Studies in partnership with NORC at the University of Chicago, is the culmination of a two-year collaborative exercise between Jewish Long Beach, The Brandeis/NORC team, and almost every Jewish agency, congregation, and organization in Long Beach and West Orange County. It is our belief that this study will help guide not only Jewish Long Beach and the Alpert JCC, but our entire Jewish community and its institutions, in ensuring that we remain relevant, adaptable, and a light unto our neighbors for generations to come.
The data contained in this document provides a historic degree of clarity on our Jewish community’s demographic composition, the Jewish population’s intersecting identities beyond Judaism, its socioeconomic characteristics, and where gaps may exist in the programs and services social, cultural, recreational, religious, and educational that our institutions currently provide. It is our hope that this study will enable Jewish Long Beach, our sister Jewish agencies, congregations, and all other Jewishlyfocused organizations in the Long Beach area to evolve, to broaden our constituencies, and to ensure that we are serving the most comprehensive possible cross section of our Jewish population.
We wish to offer our deepest gratitude to the Brandeis and NORC research teams, led by principal investigator Dr. Janet Aronson of Brandeis, and to the local Community Study Working Group, consisting of five individuals without whose generosity of time, spirit, and expertise this milestone would have been impossible to achieve:
Dr. Richard Marcus, Chair
Dr. Jeffrey Blutinger

Dr Sean Hogan
Dr. Vicki Scherwin
Dr. Suzanne Perlitsh
Jewish Long Beach is pleased to serve as the project’s primary funder, with generous grant assistance from the Jewish Federations of North America Research Benchmarking Project, with support from the Harry and Jeanette Weinberg Foundation.


Thank you to all whose dedication to Jewish peoplehood and continuity enabled us to realize this accomplishment, and on whose shoulders, we now stand as we look with clear eyes toward a future that will see our community go only from strength to strength.
L’shalom,
Dr.
Dr. Barry Zamost, Immediate Past Co-President
Richard Marcus, President Zach Benjamin, CEO Edie Brodsky, Immediate Past Co-President
Harry & Jeanette Weinberg Jewish Long Beach Campus Phone: 562.426.7601 One Sommer Way Fax: 562.424.3915 3801 East Willow Street jewishlongbeach.org Long Beach, California 90815 alpertjcc.org Facebook:/JewishLongBeach /AlpertJCC Instagram:@alpert_jcc @JewishLongBeach
Acknowledgments
At Brandeis CMJS
Study Directors
Janet Krasner Aronson
Matthew Boxer
Matthew A. Brookner
Leonard Saxe
Community Studies Research Team
Adina Bankier-Karp
Alicia Chandler
Matthew Feinberg
Raquel Magidin de Kramer
Daniel Mangoubi
Adam Martin
Eleora Pasternack
Editing and Logistics
Deborah Grant
Masha Lokshin
Ilana Friedman
American Jewish Population Project
Elizabeth Tighe
Daniel Nussbaum
Study Support
Naomi Haser
Leisha Martin
Rachel Orloff
Cyna Reisman
Jill Smith
Inez Springer
Hannah Taylor
At NORC
Study Team
David Dutwin
Zachary H. Seeskin
Shannon Nelson
Frankie Duda
Margrethe Montgomery
Statistics and Methodology
Patrick Coyle
Becki Curtis
Ned English
Nicolas Fernandez
Evan Herring-Nathan
Andrea Malpica
Chang Zhao
Meimeizi Zhu
IT and Survey Programming
Katherine Bellamy
Sarah Lodato
Saira Mumtaz
Survey Management
Lindsey Macella
Caroline Tipler
Special Thanks
To the 589 respondents who completed the survey. Without their willingness to spend time answering questions about their lives, there could be no study.
Telephone Support and Survey Operations
Chris Reckner
Edward Sipulski
© 2023 Brandeis University.
Maurice and Marilyn Cohen Center for Modern Jewish Studies www.brandeis.edu/cmjs
The Cohen Center for Modern Jewish Studies (CMJS), founded in 1980, is dedicated to providing independent, high-quality research on issues related to contemporary Jewish life.
Recommended Citation:
Brookner, M.A., Aronson, J.K., Boxer, M., Saxe, L., Seeskin, Z., & Dutwin, D. (2023). 2021-2022 Long Beach Area Jewish Community Study. Waltham, MA: Cohen Center for Modern Jewish Studies, Brandeis University.
www.brandeis.edu/cmjs/community-studies/long-beach-report.html
2021-22 Long Beach Area Jewish Community Study
i
2021-22 Long Beach Area Jewish Community Study ii Table of Contents List of Figures and Tables v Introduction ........................................................................................................................................................ 1 Summary of methodology 2 Survey weighting ............................................................................................................................................ 2 How to read this report ................................................................................................................................ 2 Limitations 4 Report overview ............................................................................................................................................ 4 Technical appendix ....................................................................................................................................... 5 Chapter 1. Demographic Snapshot 6 Chapter highlights ......................................................................................................................................... 6 Jewish population estimate .......................................................................................................................... 7 People in Jewish households 7 Geography ...................................................................................................................................................... 9 Origins and residence 11 Age and gender ............................................................................................................................................ 12 Race and ethnicity ....................................................................................................................................... 13 Political views 14 Household composition ............................................................................................................................. 15 Jewish denomination, ethnicity, and intermarriage ................................................................................ 16 Chapter 2. Patterns of Jewish Engagement 17 Chapter highlights ....................................................................................................................................... 17 Index of Jewish Engagement ..................................................................................................................... 17 Patterns of Jewish engagement 19 Jewish behaviors and Jewish engagement ................................................................................................ 19 Demographics and Jewish engagement ................................................................................................... 20 Jewish background and Jewish engagement 21 Attitudes about being Jewish ..................................................................................................................... 23 Chapter 3. Jewish Children 32 Chapter highlights ....................................................................................................................................... 32 Children in Jewish households .................................................................................................................. 32 Jewish education 35
2021-22 Long Beach Area Jewish Community Study iii Jewish camping and teen Israel programs ............................................................................................... 36 Lifecycle celebrations .................................................................................................................................. 36 Children’s programs 36 Chapter 4. Congregations and Rituals........................................................................................................... 37 Chapter highlights ....................................................................................................................................... 37 Congregation membership 38 Congregation Types .................................................................................................................................... 38 Religious services 41 Jewish rituals ................................................................................................................................................ 43 Chapter 5. Jewish Organizations and Philanthropy .................................................................................... 46 Chapter highlights 46 Organization membership and participation ........................................................................................... 47 Jewish-focused activities ............................................................................................................................. 56 Volunteering and philanthropy 59 Chapter 6. Community, Connections, and Concerns ................................................................................. 65 Chapter highlights ....................................................................................................................................... 65 Feelings of connection to the Jewish community 66 Welcoming and limiting conditions .......................................................................................................... 70 Concerns about and experiences with antisemitism .............................................................................. 79 Chapter 7. Israel 82 Chapter highlights ....................................................................................................................................... 82 Emotional attachment to Israel 82 News about Israel ........................................................................................................................................ 86 Chapter 8. Health Needs and Financial Well-Being ................................................................................... 89 Chapter highlights 89 Financial situation and income .................................................................................................................. 90 Educational attainment and employment ................................................................................................ 99 Health and disability 100 Impact of finances on Jewish life ........................................................................................................... 105 Chapter 9. In the Words of Community Members ................................................................................. 107 Community characteristics 107 Affordability .............................................................................................................................................. 109 Jewish life 110 Jewish organizations 111 Leadership, volunteering, and philanthropy ......................................................................................... 112
2021-22 Long Beach Area Jewish Community Study iv Program and activities ............................................................................................................................. 113 Chapter 10. Future Directions .................................................................................................................... 115 Deepen feeling of belonging to the community 115 Foster personal connections ................................................................................................................... 115 Reduce financial barriers ......................................................................................................................... 116 Expand Jewish preschool participation 116 Address social service needs ................................................................................................................... 116 Conclusion 117 Notes............................................................................................................................................................... 118
List of Figures and Tables
2021-22 Long Beach Area Jewish Community Study v
Figure 1.1. Geographic distribution of the Long Beach Area Jewish community 10 Figure 1.2. Political leanings of Jewish adults in Long Beach Area 14 Figure 1.3. Household composition 15 Figure 2.1. Index of Jewish engagement 19 Figure 2.2. Being Jewish is a part of daily life 24 Figure 2.3. Importance of being Jewish to how you think about yourself 24 Figure 2.4. Remembering the Holocaust is essential to being Jewish 25 Figure 2.5. Working for justice and equality in society is essential to being Jewish ............................... 25 Figure 2.6. Leading an ethical and moral life is essential to being Jewish ............................................... 26 Figure 2.7. Taking care of Jews in need is essential to being Jewish ........................................................ 27 Figure 2.8. Observing Jewish law is essential to being Jewish ................................................................... 27 Figure 2.9. Meaning of being Jewish ............................................................................................................. 28 Figure 2.10. Meaning of being Jewish (Personal engagement group) ...................................................... 29 Figure 2.11. Meaning of being Jewish (Involved engagement group)...................................................... 30 Figure 2.12. Meaning of being Jewish (Immersed engagement group) ................................................... 31 Figure 3.1. Marital status of parents of Jewish children ............................................................................. 33 Figure 3.2. Jewish identity of children of inmarried parents ..................................................................... 34 Figure 3.3. Jewish identity of children of intermarried parents ................................................................. 34 Figure 5.1. Important cause for volunteering or donating ........................................................................ 62 Figure 7.1. Caring about Israel is essential to being Jewish ....................................................................... 88 Figure 8.1. Educational attainment 99 Table 1.1. Long Beach Area Jewish Community Population Estimates, 2021 7 Table 1.2. Jewish population of the Long Beach Area, detail 9 Table 1.3. Distribution of Jewish households and Jewish individuals across geographic regions 10 Table 1.4. Where Jewish adults were raised 11 Table 1.5. Length of residence ....................................................................................................................... 11 Table 1.6. Jewish households and country of origin ................................................................................... 12 Table 1.7. Israelis and Russian-speaking Jews ............................................................................................. 12 Table 1.8. Age of Jewish adults in the Long Beach Area, all Long Beach adults, and US Jews ........... 12 Table 1.9. Age distribution of Jewish individuals by geographic regions ................................................ 13 Table 1.10. Race and ethnicity ....................................................................................................................... 13 Table 1.11. Denomination of Jewish adults in the Long Beach Area and the United States ............... 16 Table 1.12. Jewish ethnicity ............................................................................................................................ 16 Table 1.13. Individual marital status by age ................................................................................................. 16 Table 2.1. Jewish behaviors and engagement .............................................................................................. 20 Table 2.2. Jewish engagement by age ............................................................................................................ 21 Table 2.3. Jewish engagement by region....................................................................................................... 21 Table 2.4. Jewish engagement by financial situation ................................................................................... 21 Table 2.5. Jewish engagement by denomination ......................................................................................... 22 Table 2.6. Jewish engagement by childhood Jewish education 22
2021-22 Long Beach Area Jewish Community Study vi Table 2.7. Jewish engagement by Jewish parents ........................................................................................ 22 Table 2.8. Jewish engagement by parent status ........................................................................................... 23 Table 2.9. Jewish engagement by marital status .......................................................................................... 23 Table 3.1. Children in Jewish households .................................................................................................... 33 Table 3.2. Ages of Jewish children ................................................................................................................ 33 Table 3.3. Enrollment in early childhood programs, 2021-22 ................................................................... 35 Table 3.4. Enrollment in K-12 Jewish education, 2021-22 ........................................................................ 35 Table 3.5. Reasons for not attending Jewish school in 2021-22 ............................................................... 36 Table 3.6. Enrollment in Jewish camps, summer 2021 .............................................................................. 36 Table 4.1. Congregation membership ........................................................................................................... 39 Table 4.2. Current and past congregation membership during adulthood.............................................. 40 Table 4.3. Type of congregation membership 41 Table 4.4. Religious service attendance 42 Table 4.5. Preference for religious services 43 Table 4.6. Ritual practices 44 Table 4.7. Marking Shabbat 45 Table 5.1. Organization memberships in the Long Beach Area 48 Table 5.2a. Types of activities regularly engaged in 49 Table 5.2b. Types of activities regularly engaged in 50 Table 5.3. Frequency of Jewish program participation, past year ............................................................. 51 Table 5.4. Type of participation by program sponsor ................................................................................ 52 Table 5.5. Sponsors of Jewish programs, past year ..................................................................................... 53 Table 5.6a. Type of program sponsored by Jewish organization, past year ............................................ 54 Table 5.6b. Type of program sponsored by Jewish organization, past year ............................................ 55 Table 5.7a. Jewish-focused activities, past year ........................................................................................... 57 Table 5.7b. Jewish-focused activities, past year ........................................................................................... 58 Table 5.8. Volunteering in past year .............................................................................................................. 59 Table 5.9. Donations in past year .................................................................................................................. 61 Table 5.10. Most important Jewish causes for volunteering or donating ................................................ 63 Table 5.11. Most important non-Jewish causes for volunteering or donating ....................................... 64 Table 6.1. Feeling a sense of belonging to… ............................................................................................... 67 Table 6.2. Satisfaction with level of participation in the Long Beach Area Jewish community ........... 69 Table 6.3a. Conditions that make people feel welcome and comfortable at Jewish programs ............ 71 Table 6.3b. Conditions that make people feel welcome and comfortable at Jewish programs 73 Table 6.4a. Conditions that limit participation in the Long Beach Area Jewish community 75 Table 6.4b. Conditions that limit participation in the Long Beach Area Jewish community 77 Table 6.5. Consider Jewish organizations in the Long Beach Area to be welcoming to 78 Table 6.6. Antisemitism 80 Table 7.1. Emotional attachment to Israel 83 Table 7.2. Travel to Israel 84 Table 7.3. Types of travel to Israel 85 Table 7.4. Follow news about Israel .............................................................................................................. 87 Table 8.1. Financial situation .......................................................................................................................... 90 Table 8.2. Financial situation by subgroup ................................................................................................... 91 Table 8.3. Change in financial situation since 2020 .................................................................................... 91 Table 8.4. Household income ........................................................................................................................ 92 Table 8.5. Federal poverty level ..................................................................................................................... 93 Table 8.6. Confidence in financial future ..................................................................................................... 93
2021-22 Long Beach Area Jewish Community Study vii Table 8.7. Confident in financial future by subgroup (% not at all/not too confident) ....................... 94 Table 8.8. Receipt of public benefits ............................................................................................................. 95 Table 8.9. Economic insecurity ...................................................................................................................... 96 Table 8.10. Financial difficulties (% Jewish households who did not have enough money for…) ..... 97 Table 8.11. Any financial difficulties ............................................................................................................. 98 Table 8.12. Employment status ..................................................................................................................... 99 Table 8.13. Households with a chronic health issue, special need, or disability that limits work, school, or activities ....................................................................................................................................... 100 Table 8.14. Specific health issues ................................................................................................................ 101 Table 8.15. Importance that human services be provided by a Jewish organization .......................... 102 Table 8.16. Support networks, feelings of loneliness, and emotional or mental health difficulties .. 104 Table 8.17. Financial limitations to Jewish life 105 Table 8.18. Any financial limitation to Jewish life 106
The 2021 Long Beach Area Jewish Community Study, conducted by the Maurice and Marilyn Cohen Center for Modern Jewish Studies (CMJS) at Brandeis University, in partnership with NORC at the University of Chicago and sponsored by Jewish Long Beach, employed innovative state-of-the-art methods to create a portrait of the characteristics, attitudes, and behaviors of the Jewish community Some of the issues explored in this study emerged out of conversations surrounding the Pew Research Center’s A Portrait of Jewish Americans (2013), which pointed to growing and shrinking US Jewish sub-populations, declining affiliation in traditional institutions, new forms of Jewish engagement, an increase in both secular and Orthodox Jews, and a relationship between intermarriage and community growth. 1 A new Pew study, Jewish Americans in 2020 (2021), published while this study was in its planning phase, reinforced many of the findings of the original Pew study and contributed new insights into the state and character of the American Jewish community. With the Pew studies and the related national discourse as a backdrop, the 2021 Long Beach Area Jewish Community Study seeks to describe the current dynamics of its population.
The principal goal of this study is to provide data to be used by Jewish Long Beach, as well as other community organizations and funders, for communal planning. Valid data are essential for effective decision making, allocation of resources, strategic priorities, community support, robust participation, and outreach.
Specifically, the study sought to:
• Estimate the number of Jewish adults and children in the community and the number of non-Jewish adults and children who are part of those households
• Describe the community in terms of age and gender, distribution across regions of the community, economic well-being, and other sociodemographic characteristics
• Measure participation in and attitudes toward community institutions, programs, and services
• Understand the multifaceted cultural, communal, and religious expressions of Judaism that constitute Jewish engagement
• Assess attitudes toward Israel and Judaism
• Gauge potential and current needs for human services
The survey questionnaire used in this study was developed by CMJS in close consultation with Jewish Long Beach. It included questions widely used by social scientists to study the Jewish community and several questions tailored to obtain a better understanding of how the Jewish community was affected by and responded to the COVID-19 pandemic.
Although some survey responses were likely influenced by the special circumstances of the pandemic (e.g., synagogue attendance and employment), the majority of questions were designed to provide a demographic and attitudinal portrait of the stable characteristics of the community. Where necessary, questions were modified to account for changes in usual patterns of behavior during the pandemic.
2021-22
1
Long Beach Area Jewish Community Study
Introduction
Summary of methodology
This study is based on an analysis of a rich set of data collected from 589 eligible households between October 2021 and March 2022 Survey respondents were randomly selected from all households in the Long Beach catchment area (see Figure 1.1).
The study design integrated an Address-Based Sample (ABS) with known households on Jewish organizational lists. In all, the study’s sample included 83,758 households. Households were contacted by mail, email, and telephone, and invited to complete the survey online or by telephone. Responses were statistically weighted to represent all Jewish households in the Long Beach Area. The response rates for the main sample were 5.0% unweighted and 4.5% weighted.
For more information about the study’s methodology, see the technical appendix.
Survey weighting
The survey of Jewish households conducted for this study was designed to represent the views of an entire community by interviewing a randomly selected sample of households from the community. When analyzing survey data, we are not only interested in the answers of the respondents, but also the larger subgroup or community that they represent. Each completed survey is assigned a numeric “weight” that indicates our estimate of how many people in the population of interest the respondent represents. The weighted respondent thus stands in for that segment of the population, and not only the household from which it was collected.
Despite the careful methodological approaches employed in this study, bias in estimates is inevitable. Assigning weights is a way to minimize such bias. Estimates for the study are based on applying survey weights that account for the survey design, nonresponse, and raking adjustments based on external data on the Jewish and total Long Beach Area populations, including data from the American Community Survey, American Jewish Population Project, and data on enrollment and membership in local organizations and programs.
Details of survey weighting and analysis are provided in the technical appendix.
How to read this report
Unless otherwise specified, this report presents weighted survey data in the form of percentages or proportions. Accordingly, these data should be read not as the percentage or proportion of respondents who answered each question in a given way, but as the percentage or proportion of the population that it is estimated would answer each question in that way had each member of the population been surveyed.
No estimate should be considered an exact measurement. The reported estimate for any value, known as a “point estimate,” is the most likely value for the variable in question for the entire population given available data, but it is possible that the true value is slightly lower or slightly higher. Because estimates are extrapolated from data collected from a representative sample of the population, there is a degree of uncertainty. The amount of uncertainty depends on multiple factors, the most important of which is the number of survey respondents who provided the data from
2021-22 Long Beach Area Jewish Community Study 2
which an estimate is derived. The uncertainty is quantified as a set of values that range from some percentage below the reported estimate to a similar percentage above it. This range is known as a “confidence interval.” By convention, the confidence interval is calculated to reflect 95% certainty that the true value for the population falls within the range defined by the confidence interval, but other confidence levels are used where appropriate.
As you read this report, keep in mind the following:
• Note that the base category or denominator for each analysis may differ, e.g., Jewish adults, Jewish households, synagogue members. The relevant category is noted in the text, table, or figure.
• Unless otherwise specified, references to “all Jewish adults” or “all Jewish households” refer to Jewish adults and Jewish households in the Long Beach Area
• Throughout this report, the term “couples” includes those who are legally married and those who are partnered and living together. Unless otherwise specified, “children” refers to minor children under age 18.
• Because estimates are based on a probability survey, no one estimate should be considered an exact measurement. As a guideline, the reader should assume that all estimates have a range of plus or minus five points; therefore, reported differences between any two numbers of less than 10 percentage points may not necessarily reflect true differences in the population.
• When a percentage is between 0% and 0.5% and would otherwise round down to 0%, the number is denoted as < 1%. When there are insufficient respondents in a particular subgroup for reporting reliable information, the estimate is shown as “ ”.
• In this report, some tables show row totals (that is, the sum of each row adds to 100), some show column totals (the sum of each column adds to 100), and some show individual cell estimates. When the bottom row of a table shows totals, this indicates column totals (see table 1.3 for an example). When the rightmost column of a table shows totals, this indicates row totals. (See table 2.2 for an example).
• Comparisons across subgroups: When there is a statistically significant difference between subgroups, we are 95% confident that at least some of the differences in estimates reflect actual differences and are not just the result of random chance.
o In the tables in this report, we designate statistically significant differences by shading them light gray Within each shaded section of each table, the difference between at least one set of numbers is statistically significant, although we do not indicate which set. Findings that are not statistically significant are not shaded.
o In the figures in this report, statistically significant differences are indicated with an asterisk (*) after the figure title.
o Even in cases where there are statistically significant differences in a full set of responses, it is unlikely that there are statistically significant differences between every pair of numbers. As noted above, even when a table is statistically significant, differences between any two numbers of less than 10 percentage points may not reflect true differences in the population.
o Because of the size of the sample and other study limitations, some comparisons shown in this report indicate relatively large numeric differences that are not statistically significant. Although these patterns suggest that there may be actual differences in the population, we cannot be confident that these apparent differences are not the result of random chance. Where appropriate, we note these findings.
2021-22 Long Beach Area Jewish Community Study 3
Limitations
Due to the methodology used to reach community members, some groups were likely to have been undercounted and/or underrepresented. In particular, residents of institutional settings such as hospitals, nursing homes, and dormitories on college campuses, as well as adults who were never in contact with a Jewish organization in the Long Beach Area, were less likely to have been identified and contacted to complete the survey. Although we cannot produce a precise count of these individuals, these undercounts were unlikely to have introduced significant bias into the reported estimates. Where appropriate, we noted the limitations of the methodology.
The present report has been designed to provide basic information about Jewish life across a wide range of topics and a variety of subgroups. It was not designed to provide detailed information about any single topic or subset of the community. Although detailed data cannot always be provided, the information that is included can serve as a springboard for more specific and targeted analyses as well as additional follow-up research. Note that more details about each item are available in the report appendix and through analysis of the dataset.
See the report appendices for methodological details and all study documentation. See the study comparison charts for more detailed data than is included in this report.
Report overview
This report presents key findings about the Long Beach Area Jewish community. Beginning with a portrait of the community as a whole, the report continues with a more in-depth look at topics of interest to community members and leaders.
Chapter 1. Demographic Snapshot
The report begins with an overview of the demographic composition of the Long Beach Area Jewish community today.
Chapter 2. Patterns of Jewish Engagement
This chapter describes the multifaceted ways in which the Jews of the Long Beach Area define and express their Jewish identity. A set of behavioral measures characterize Jewish engagement based on participation in Jewish life. A typology of Jewish engagement helps explain Jewish behaviors and attitudes. This chapter also reports on attitudes about the meaning and importance of Judaism to members of the Jewish community.
Chapter 3. Jewish Children
This chapter discusses Jewish children and families as well as participation in Jewish education.
Chapter 4. Congregations and Ritual Life
This chapter discusses membership in Jewish congregations and levels of participation in Jewish ritual life.
Chapter 5. Jewish Organizations and Philanthropy
This chapter discusses membership and involvement in organizational, social, and personal Jewish life as well as volunteering and philanthropy.
2021-22 Long Beach Area Jewish Community Study 4
Chapter 6. Community, Connections, and Concerns
This chapter explores the connections of Jewish adults in the Long Beach Area to the Jewish community, the barriers that limit their participation in the Jewish community, and the context of their concern about antisemitism.
Chapter 7. Israel
This chapter describes the frequency and types of travel to Israel and other markers of a connection to Israel.
Chapter 8. Health Needs and Financial Well-Being
This chapter examines the living conditions of Long Beach Area Jewish households, in particular with regard to economic well-being, economic hardship, and health and social service concerns.
Chapter 9. In the Words of Community Members
This chapter presents a summary of respondents’ comments about the community’s strengths, gaps, and opportunities for improvements.
Chapter 10. Future Directions
This chapter summarizes some of the key findings of the study and points to opportunities for next steps for the community.
Technical appendix
The appendices, available in a separate document, include:
Appendix A. Methodological Appendix
Details of data collection and analysis
Appendix B. Survey Instrument
Description of detailed cross-tabulations of all survey data for key subgroups of the population
Appendix C. Study Instrument and Codebook
Details of survey questions and conditions, along with the original weighted responses
Appendix D. Latent Class Analysis
Details of the latent class analysis method that was used to develop the Index of Jewish Engagement
Appendix E. Supporting Documents
Copies of the recruitment materials and training documents used with the call center
2021-22 Long Beach Area Jewish Community Study 5
Chapter 1. Demographic Snapshot
Chapter highlights
Understanding the character, behavior, and attitudes of the Long Beach Area Jewish community requires knowledge of its size, geographic distribution, and basic socio-demographic features. The ways in which Jewish individuals and Jewish households defined as any household that includes at least one Jewish adult identify and engage with Judaism and the community vary significantly based on who they are, where they live, their household composition, their ages, and Jewish backgrounds. This chapter provides a demographic overview describing the size of the Long Beach Area Jewish community and the basic characteristics of its members.
Population size and demographics
• There are 38,900 individuals living in 17,700 Jewish households in the Long Beach Area, of whom 28,300 are Jewish in some way. These households include 24,600 Jewish adults and 3,600 Jewish children.
• Jews in the Long Beach Area are older than the US Jewish community as a whole; nationally, half of Jewish adults are younger than age 50, compared to 28% of Jews in the Long Beach Area.
• Nearly two thirds of Jewish adults are married or living with a partner; of these adults, about half are intermarried, slightly higher than the national Jewish population (42%)
• Seven percent of Jewish adults identify as LGBTQ, and 11% of Jewish households include an LGBTQ individual, who may be an adult or child, Jewish or not Jewish.
• While 16% of Jewish individuals in the Long Beach Area identify as Hispanic or as any racial group other than white, 6% identify as a person of color. Although 4% of Jewish adults identify as a person of color, a larger share (19%) of Jewish children are identified as people of color by their parents.
Geography and origins
• Nearly two thirds of the Jewish community live in the city of Long Beach, and the remaining population lives in the Surrounding Areas.
• Nineteen percent of Jewish households in the Long Beach Area include at least one adult or child, Jewish or not, who was born outside the United States. Among Jewish adults, 22% were born in the Long Beach Area
• One quarter of Jewish adults have lived in the Long Beach Area for less than one decade, and 35% have done lived in the Long Beach Area at least 40 years.
Jewish identification
• Among Jewish adults in the Long Beach Area, 5% identify as Orthodox, 21% as Conservative, 31% as Reform, and 5% as some other denomination. The 38% who do not identify with a denomination is a slightly larger share than the national Jewish population, of whom 32% do not identify with a denomination.
2021-22 Long Beach Area Jewish Community Study 6
• About three quarters of Jewish adults say their Jewish heritage is Ashkenazi, and 11% are Sephardi. Two percent are Mizrachi or some other heritage.
Jewish population estimate
There are approximately 17,700 Jewish households in the Long Beach Area Jewish community (Table 1.1). These households include 38,900 individuals, of whom 28,300 are Jewish (see below for definitions).
The Jewish population comprises 1.8% of the Long Beach Area. 2
People in Jewish households
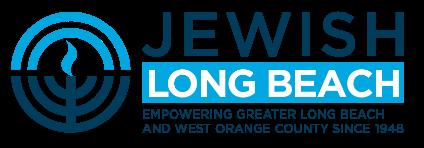
Estimates of the size of the Jewish community rest on a set of fundamental questions about who is Jewish for the purposes of this study. Recent studies, such as the Pew Research Center’s 2013 and 2020 national studies of the US Jewish community, classify respondents according to their responses to a series of screening questions:
• What is your religion, if any?
• Do you consider yourself to be Jewish aside from religion?
• Were either of your parents Jewish?
• Were you raised Jewish?
Based on the answers to these questions, Jewish adults have been categorized as “Jewish by religion” (JBR) if they respond to a question about religion by stating that they are solely Jewish, or “Jews of no religion” (JNR) if they do not adhere to any religion, but they consider themselves Jewish by some other means. Jews by religion tend to be more engaged with Judaism than Jews of no religion, but many JBRs and JNRs look similar in terms of Jewish behaviors and attitudes. For the purposes of this study and to ensure that the Long Beach Area Jewish community could be compared to the population nationwide, a variant of Pew’s scheme was employed, supplemented by several other measures of identity. Also included in the Jewish population are those adults who indicate they are both Jewish and another religion; we refer to this category as “Jews of multiple religions” (JMR).
2021-22 Long Beach Area Jewish Community Study 7
Total people in Jewish households 38,900 Total Jewish households 17,700 Total Jews 28,300 Adults (ages 18+) 34,300 Jewish 24,600 Non-Jewish 9,600 Children (under age 18) 4,600 Jewish 3,600 Non-Jewish or unknown religion 1,000 Note: Discrepancies in totals due to rounding.
Table 1.1. Long Beach Area Jewish Community Population Estimates, 2021
2021-22 Long Beach Area Jewish Community Study 8
Among Jewish adults in the Long Beach Area, 17,900 individuals can be classified as JBR (Table 1.2). Proportionally, this share is similar to the overall US Jewish population reported by the Pew Research Center, which is 73%. 3
For more on children in Jewish households, see Chapter 3.
Table
Geography
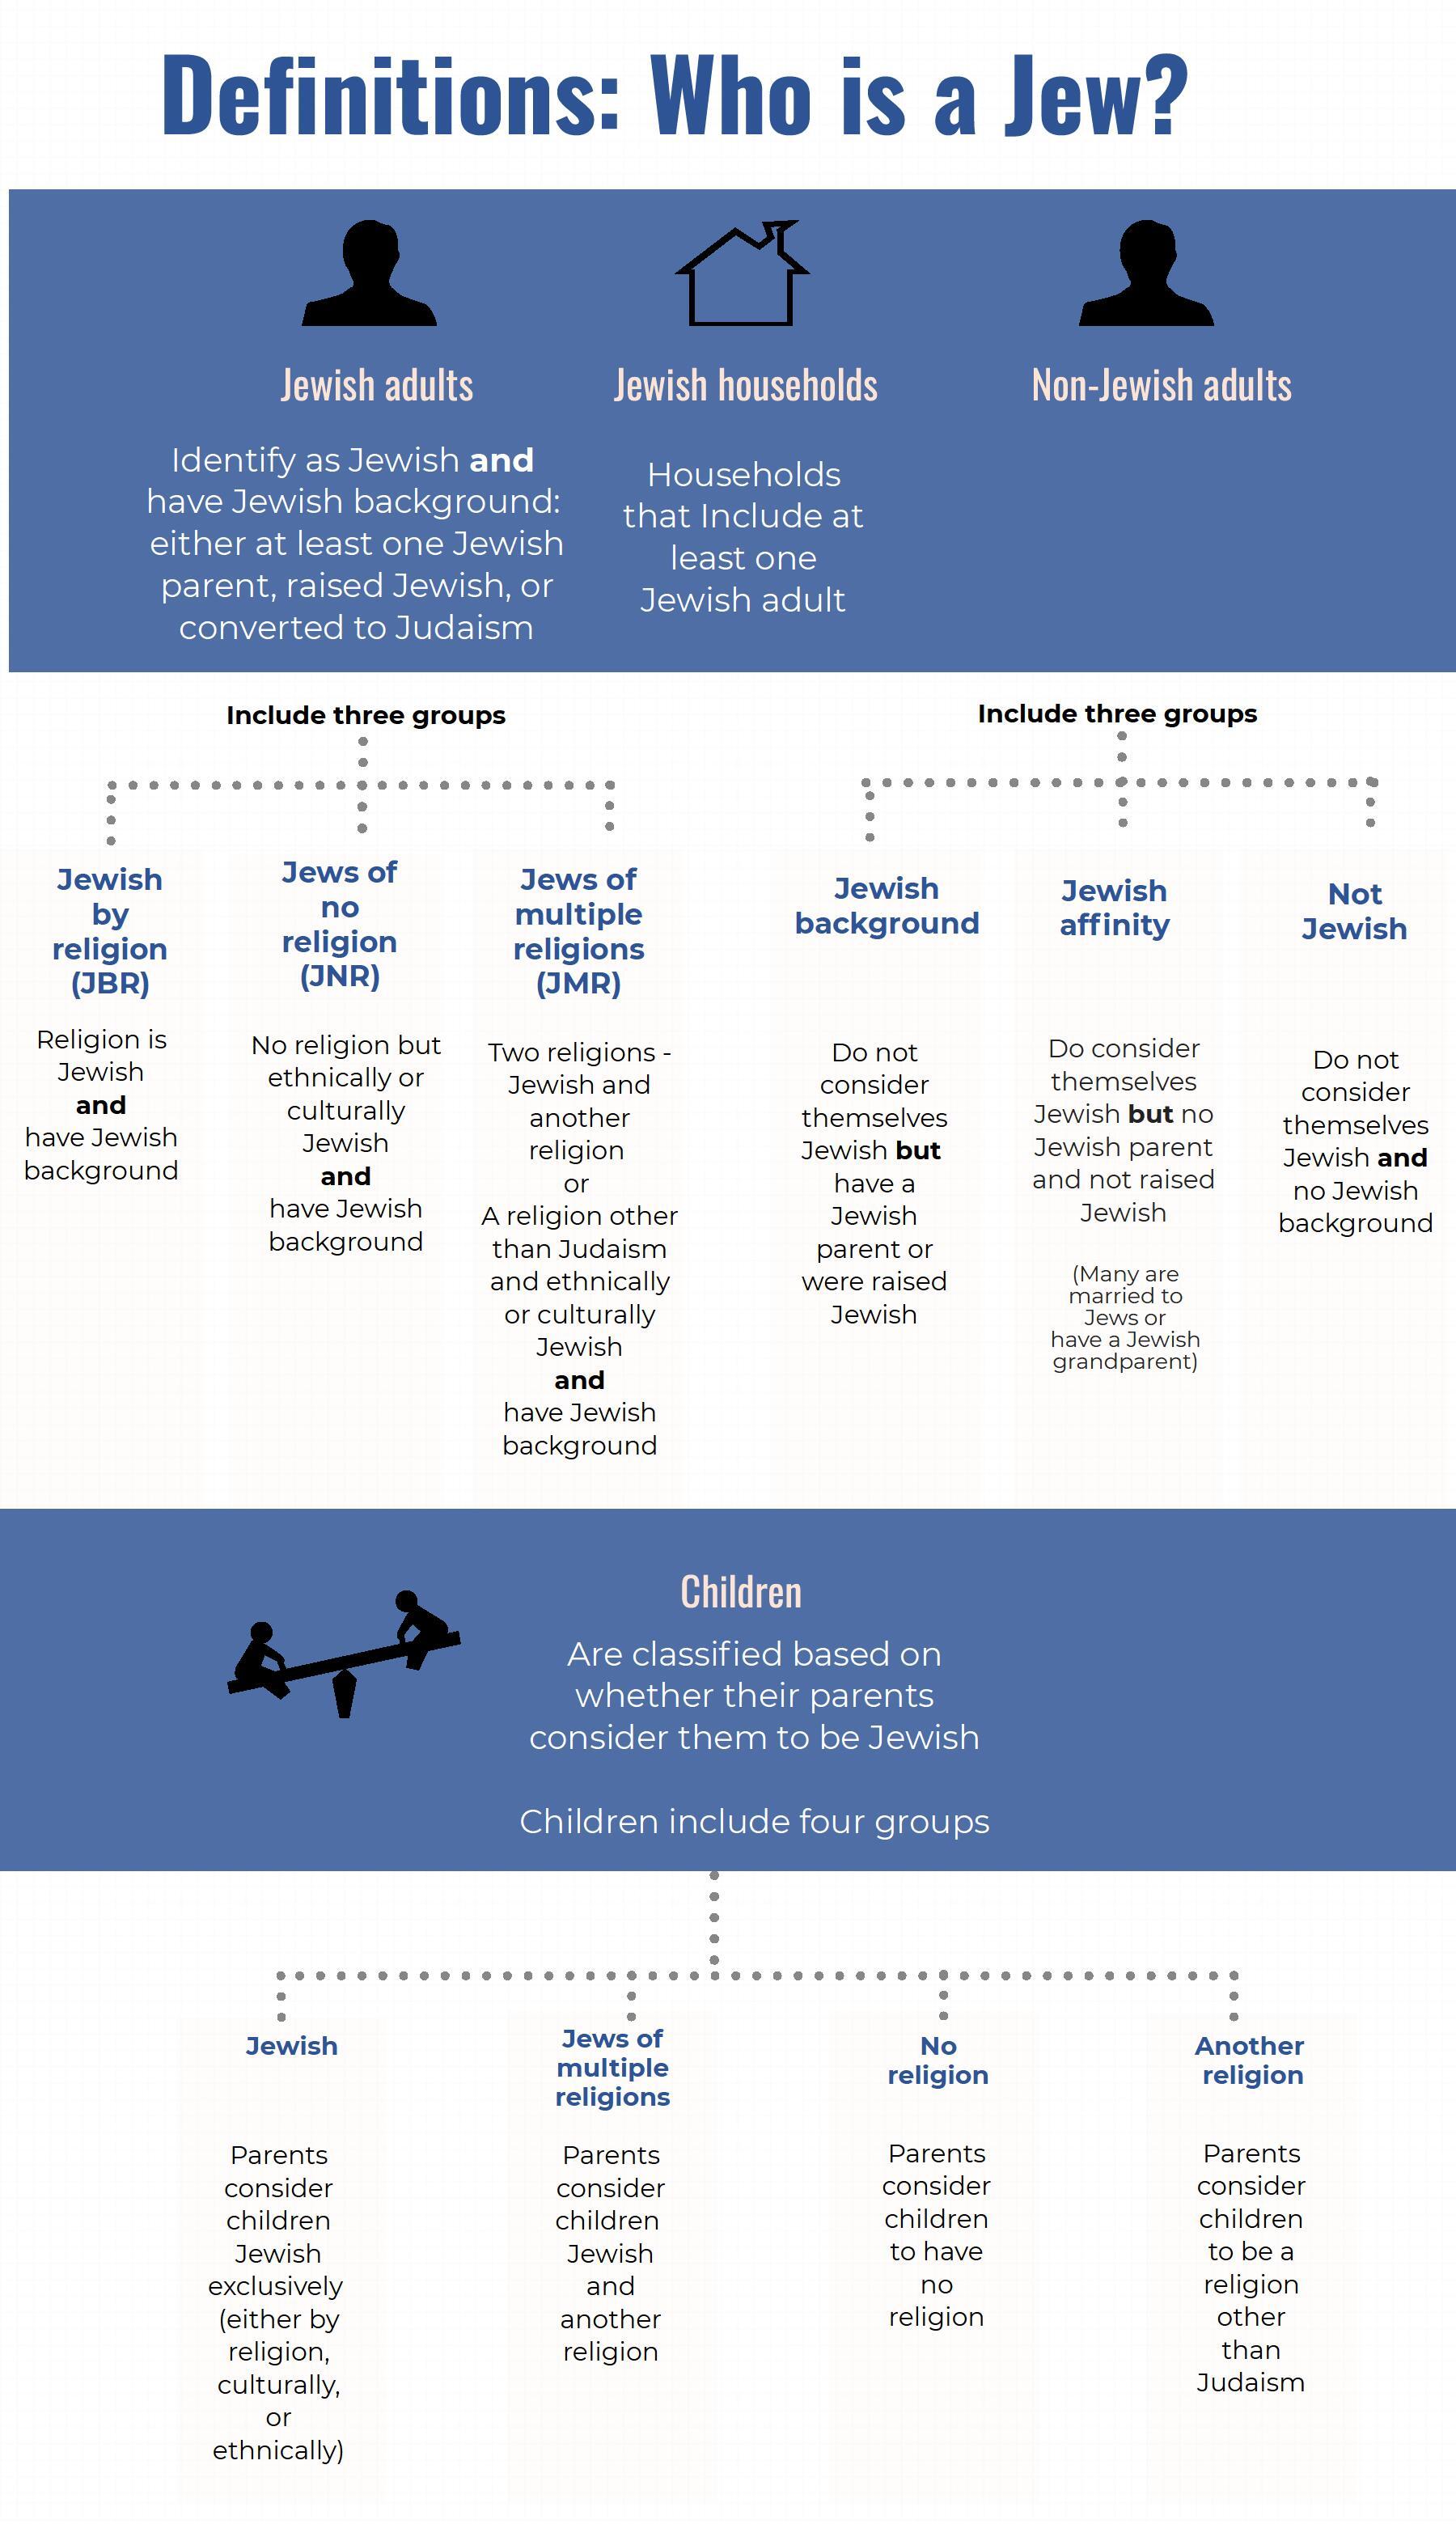
The Jewish community of the Long Beach Area can be divided by regions based on ZIP code (Figure 1.1, Table 1.3). Throughout this report, these regions will be identified as the city of Long Beach and the Surrounding Areas. In this map, each dot represents about 100 Jewish households, and the dots are placed randomly within the ZIP code boundaries. ZIP codes that are shown with no dots were included in the study area but are estimated to have fewer than 100 Jewish households.
2021-22 Long Beach Area Jewish Community Study 9
Jewish adults 24,600 JBR adults 17,900 JNR adults 3,800 JMR adults 2,900 Non-Jewish adults in Jewish households 9,600 Jewish children in Jewish households 3,600 Exclusively Jewish 3,100 Jewish and something else 500 Non-Jewish children in Jewish households 1,000 No religion 800 Exclusively another religion 100 Undetermined or parents undecided 100 Note: Discrepancies in totals due to rounding
1.2. Jewish population of the Long Beach Area, detail (rounded to nearest 100)
2021-22 Long Beach Area Jewish Community Study 10
Figure 1.1. Geographic distribution of the Long Beach Area Jewish community
The Jewish community is concentrated in the city of Long Beach (Table 1.3). Roughly two thirds of Jewish households are in Long Beach, and the remaining third live in the Surrounding Areas.
Jewish households (%) Jewish individuals (%) Long Beach 64 62 Surrounding Areas 36 38 Total 100 100
Table 1.3. Distribution of Jewish households and Jewish individuals across geographic regions
Origins and residence
Just under half (45%) of Jewish adults were raised in the Long Beach Area (Table 1.4). Of these, about half (23%) lived in Long Beach their entire lives, and 22% left the area and returned. Five percent of Jewish adults were born and raised in another country.
In total, 8% of Jewish adults were born outside of the United States. This includes the 5% who were raised in another country, and 3% who were born in another country but were raised in the United States (Not shown in table)
Table 1.4. Where Jewish adults were raised
Many Jewish adults in the Long Beach Area having longstanding ties to the area (Table 1.5). Most have lived in the area for more than a decade, including one third (35%) who have lived in the area for 40 or more years. One quarter of Jewish adults are relative newcomers to the Long Beach Area, with 16% having lived in the area for five to nine years, and 9% having moved to the area within the past four years.
Table 1.5. Length of residence
Although 8% of Jewish adults were born outside the United States (see Table 1.4), a larger share, 19%, of Jewish households include someone who was born in a country other than the United States (Table 1.6). This includes 3% of households that include someone born in Israel, 1% born in Russia or the Former Soviet Union, 1% born in the Middle East (other than Israel), and 4% born in Latin America.
2021-22 Long Beach Area Jewish Community Study 11
All Jewish adults (%) Long Beach Area 45 Lived in Long Beach entire life (aside from college) 23 Formerly lived outside of Long Beach 22 United States, other than Long Beach 49 Another country 5 Total 100
All Jewish adults (%) 0-4 years 9 5-9 years 16 10-19 years 9 20-29 years 14 30-39 years 17 40+ years 35 Total 100
Of particular interest to the Jewish community are connections to Israel and the Former Soviet Union (FSU). Three percent of Jewish adults are Israeli citizens, and 5% of households include an Israeli citizen (Table 1.7). Two percent of Jewish adults in the Long Beach Area grew up in a Russian-speaking home, and 5% of Jewish households include someone who grew up in a Russianspeaking home.
Age and gender
The Long Beach Area Jewish community is older than the general population of the area and the national Jewish population (Table 1.8). The mean age of Jewish adults in the Long Beach Area is 60, and the median age is 62; in comparison, the national mean and median age of Jewish adults is 49. 4 Including children in the analysis lowers the mean and median ages. The mean age of all Jewish individuals in the Long Beach Area is 53, and the median age is 59.
Jews who reside in Long Beach are younger on average than those in the Surrounding Areas. About three quarters of the Long Beach Area children reside in Long Beach as do nearly four-in-five (79%) Jewish adults ages 18 to 49 (Table 1.9).
2021-22 Long Beach Area Jewish Community Study 12
Jewish households (%) Anyone born outside US 19 Anyone born in…. Israel 3 Russia or former Soviet Union 1 Middle East (aside from Israel) 1 Latin America 4 Another non-US country 13
Table 1.6. Jewish households and country of origin (% Jewish households)
Jewish adults (%) Jewish households (%) Israeli citizens 3 5 Grew up in Russian-speaking home 2 5
Table 1.7. Israelis and Russian-speaking Jews
Jewish Long Beach Area (%) General Long Beach Area (ACS 2020; %) US Jews (Pew; %) 5 18-49 28 55 50 50-64 30 25 20 65+ 43 20 29 Total 100 100 100
Table 1.8. Age of Jewish adults in the Long Beach Area, all Long Beach adults, and US Jews
Table 1.9. Age distribution of Jewish individuals by geographic regions
Overall, the Jewish population of the Long Beach Area is 45% male, 54% female, and 1% nonbinary, or some other gender identity.
Seven percent of Jewish adults identify as LGBTQ, and 11% of Jewish households include someone who identifies as LGBTQ.
Race and ethnicity
Among Jewish individuals in the Long Beach Area, 84% identify solely as white and non-Hispanic (Table 1.10). Although the remaining 16% of Jewish individuals identify either with a racial identity other than white or as Hispanic, just 6% identify as a person of color. Notably, the proportion of Jewish children with a racial identity other than white is considerably higher than that among Jewish adults, indicating that the Jewish community may be becoming more racially and ethnically diverse.
Table 1.10. Race and ethnicity
2021-22 Long Beach Area Jewish Community Study 13
All Jewish individuals (%) Ages 0-17 (%) Ages 1849 (%) Ages 5064 (%) Ages 65+ (%) Long Beach 62 74 79 49 51 Surrounding Areas 38 26 21 51 49 Total 100 100 100 100 100
All individuals in Jewish households (%) Jewish individuals (%) Jewish adults (%) Jewish children (%) White only, non-Hispanic 81 84 87 66 White only, Hispanic 4 4 3 8 Non-white, non-Hispanic 12 11 9 19 Non-white, Hispanic 3 2 1 8 Self-identifies as person of color 8 6 4 19
Political views
The majority of Jewish adults in the Long Beach Area described their political viewpoints as very liberal (22%) or liberal (35%; Figure 1.2). About one third (29%) identified as moderate, 12% as conservative,” and 3% reported being very conservative. This pattern is similar to political leanings among all US Jews. 6
2021-22 Long Beach Area Jewish Community Study 14
Very liberal 22% Liberal 35% Moderate 29% Conservative 12% Very conservative 3%
Figure 1.2. Political leanings of Jewish adults in Long Beach Area (% Jewish adults)
Household composition
Households can be characterized by the age of their members and the relationships among them. One third of Long Beach Area Jewish households include a minor child (living with one, two, or more adults) (Figure 1.3). Households with multiple generations, defined as parents and adult children of any age living together, constitute 16% of households. This category can include adults, typically in their 70s or 80s, who have moved in with their adult children, or adults, typically in their 20s, 30s, or 40s, who live in their parents’ households. About one third of households include only a couple, either married or partnered, and the remaining third include people living alone or unrelated roommates.
The mean household size is 2.2 individuals. Among households with children, the mean number of children ages 0-17 is 1.5.
2021-22 Long Beach Area Jewish Community Study 15
Household with minor child 17% Household with couple only 34% Single/roommate 34% Multiple generations 16%
Figure 1.3. Household composition
Jewish denomination, ethnicity, and intermarriage
Denominational affiliation has historically been one of the commonly used markers of Jewish identity and practice. In the Long Beach Area, however, the largest denominational grouping, 38% of Jewish adults, represents those who do not identify with any particular denomination. This follows national trends; the share with no particular denomination in the Long Beach Area Jewish community being slightly higher than the national average (Table 1.11). 7 Of Jewish adults who do identify with a denomination, the largest group identifies as Reform, followed by Conservative. The Long Beach Area has a smaller percentage of Orthodox Jews than does the US Jewish population (5% of local Jewish adults, compared to 9% nationally).
Table 1.11. Denomination of Jewish adults in the Long Beach Area and the United States
In terms of Jewish heritage, 77% of Jewish adults in the Long Beach Area identify as Ashkenazi, 11% of Jewish adults identify as Sephardi, and 1% identify as Mizrachi (Table 1.12). One percent identify with some other ancestry, and 18% identify with no particular Jewish ethnicity (8%) or say they do not know their Jewish ethnicity (10%).
Note: Because individuals could choose more than one response, columns may add up to more than 100%.
Among Jewish adults in the Long Beach Area, 64% are married or partnered; 49% of those individuals have a non-Jewish partner or spouse. Jewish adults younger than age 50 are much more likely to be intermarried than are older adults (Table 1.13).
2021-22 Long Beach Area Jewish Community Study 16
Table
Jewish adults (%) Jewish households (%) Ashkenazi 77 77 Sephardi 11 10 Mizrachi 1 < 1 Other 1 1 None 8 8 Don’t know 10 12
1.12. Jewish ethnicity
Ages 18-49 (%) Ages 50-64 (%) Ages 65+ (%) All ages Total (%) Married/partnered Jewish adults 50 83 56 64 Of married/partnered: Inmarried 41 45 62 51 Intermarried 59 55 38 49 Total 100 100 100 100 Long Beach Area 2021 (%) US Jews 2020 (%) 8 Orthodox 5 9 Conservative 21 17 Reform 31 37 Other 5 4 No denomination 38 32 Total 100 100
Table 1.13. Individual marital status by age (includes partners who live together)
Chapter 2. Patterns of Jewish Engagement
Chapter highlights
Members of the Jewish community of the Long Beach Area exhibit a variety of types of Jewish identification and means of engagement in Jewish life. Examining the ways that Jewish adults not only view, but also enact their Jewish identities, is necessary to understand the population and the ways in which Jewish life in the region can be enhanced. This chapter introduces and discusses an “Index of Jewish Engagement,” created uniquely for the Long Beach Area Jewish community.
• The Index of Jewish Engagement focuses on Jewish behaviors the ways in which individuals occupy and involve themselves in Jewish life in the Long Beach Area.
• The Index can be used to identify opportunities to improve communal planning based on people’s different needs and interests.
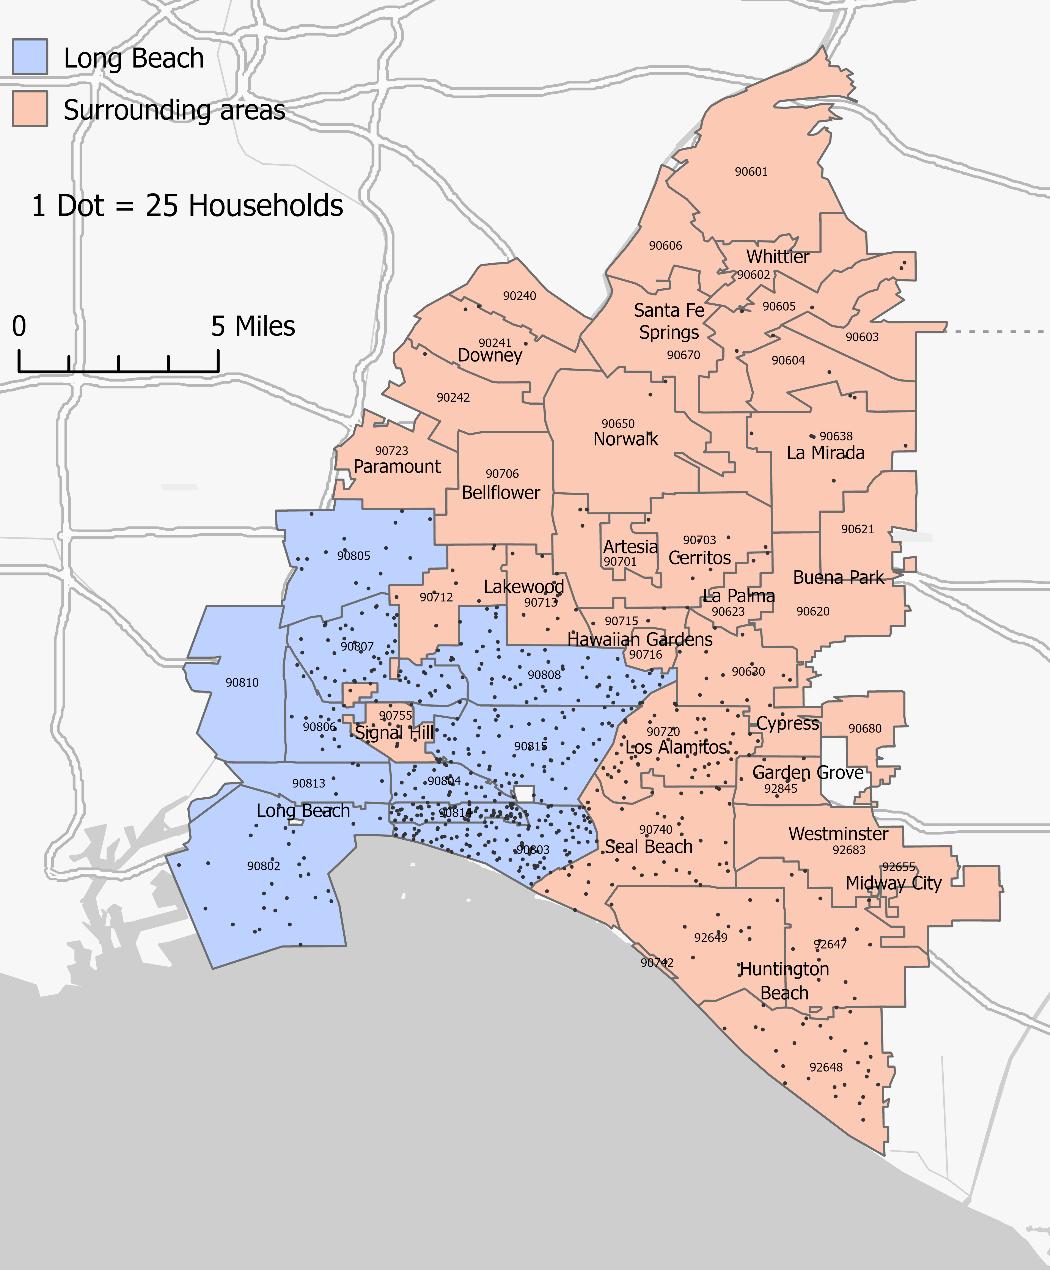
• Three distinct patterns of behavior emerge from the data.
o Personal (39% of Jewish adults): Characterized by involvement primarily through Jewish-focused activities but few other elements of Jewish life.
o Involved (38% of Jewish adults): Characterized by involvement in holiday and Jewish-focused activities and selected ritual and organizational behaviors.
o Immersed (23% of Jewish adults): Characterized by high levels of involvement in all aspects of Jewish life.
• Engagement groups include people across demographic characteristics and Jewish backgrounds.
• The groups are aligned on the importance of some universal values related to being Jewish. However, a greater share of the Immersed engagement group feels connected to more particularistic ways of understanding being Jewish and the extent to which being Jewish is important to their daily lives.
Index of Jewish Engagement
Jewish life is complex and multidimensional and includes cultural and religious behaviors that are practiced at home, with friends and family, as well as those observed with formal and informal organizations and institutions. Jewish engagement is associated with attitudes, such as feelings of attachment to the Jewish people, and with beliefs, such as valuing social justice.
The 2021-22 Long Beach Area Jewish Community Study uses a typology of patterns of Jewish engagement as one of its primary analytic tools for understanding Jewish life in the Long Beach Area Adults in Jewish households were categorized into three groups using a statistical tool, latent class analysis (LCA), that examines levels of participation across 17 different Jewish behaviors, including ritual and communal behaviors and Jewish-focused activities. The names of the three groups reflect the primary ways in which each group engages in Jewish life. This typology is unique
2021-22 Long Beach Area Jewish Community Study 17
to the Long Beach Area Jewish community and is used throughout this report to illustrate the diversity of expressions of Jewish life. The names of the groups are intended to highlight the behaviors that distinguish each group.
The Index of Jewish Engagement is also helpful in identifying engagement opportunities for groups with different needs and interests. 9 The Index focuses on behaviors the ways in which individuals spend their time and involve themselves in Jewish life. Such behaviors are concrete and measurable expressions of Jewish identity. In many cases, behaviors correlate with an individual’s demographic characteristics, backgrounds, and attitudes, but in other cases behaviors cut across these features. Jewish adults’ decisions to take part in activities may reflect the value and meaning they find in these activities, the priority they place on them, the level of skills and resources that enable them to participate, and the opportunities available and known to them.
The set of Jewish behaviors used to develop this typology is inclusive of a variety of ways public and private that contemporary Jews engage with Jewish life. Some of the activities are located primarily within institutions (e.g., synagogue membership), while others are home based (e.g., Passover seders). These behaviors are classified into four dimensions of Jewish life:
• Holiday celebrations, such as attending or hosting a Passover seder, lighting Hanukkah candles, and observing the Yom Kippur fast for all or some of the day.
• Ritual behaviors: marking Shabbat by lighting candles or having a special meal, attending Jewish services, attending High Holiday services, and following any kosher laws.
• Organizational behaviors: Belonging to a synagogue, belonging to other Jewish organizations, belonging to informal Jewish groups, participating in Jewish programs, volunteering for Jewish organizations, and donating to Jewish organizations.
• Jewish-focused activities: Studying Jewish texts, reading Jewish publications, engaging with Jewish-focused culture, and following news about Israel.
We employed LCA to cluster similar patterns of behavior based on respondents’ answers to survey questions. LCA identifies groups of behaviors that “cluster” together by analyzing patterns of responses. The result of the LCA analysis was the identification of three unique patterns of Jewish engagement. Each Jewish adult in the community was classified into one of the three engagement groups according to the pattern that most closely matched the individual’s participation in different types of Jewish behaviors.
How we developed these categories
Survey respondents answered questions about their Jewish behaviors; based on their responses, we identified the primary patterns of behavior that are presented here. Survey respondents were not asked to assign themselves to the groups.
The LCA analysis presented here is unique to the Long Beach Area Jewish community. Both the set of classifications and their names are derived directly from data collected for this study.
2021-22 Long Beach Area Jewish Community Study 18
Patterns of Jewish engagement
The patterns of Jewish engagement found among Jewish adults in the Long Beach Area are summarized in Figure 2.1 and described below. For each pattern, Table 2.1 illustrates the level of participation in each of the behaviors that was used to construct the Index of Jewish Engagement. As shown in Figure 2.1, two of the groups are of similar size, and the Immersed group, slightly smaller, includes just under one quarter of the Long Beach Area Jewish adults.
Jewish behaviors and Jewish engagement
The three patterns differ in degree and types of engagement with a broad set of Jewish behaviors. As shown in Table 2.1, the Jewish behaviors across the three engagement patterns vary widely, but all patterns include at least some behaviors that represent a connection to Jewish life. The table shows the proportion of people in each engagement group that participates in the listed behavior. In this table, the darker the box, the higher the proportion of people that engage in that behavior.
About one third of Jewish adults (39%) fall into the “Personal” group. They tend to engage in very few Jewish behaviors, with the most common behaviors among this group following news about Israel, engaging with Jewish-focused culture, and lighting Hanukkah candles in a typical year requiring no connection to the Jewish community. However, 45% read Jewish publications and about one quarter of the members of this group donated to Jewish organizations in the past year.
A similar share of Jewish adults (38%) is in the “Involved” group. Most of the members of this group followed news about Israel (91%), engaged with Jewish-focused culture (84%), and read Jewish publications (78%). These individuals also marked Shabbat by having a meal or lighting candles ever (75%), lighting Hanukkah candles in a typical year (74%), or attending a Passover seder either in person or online in 2021 (73%).
2021-22 Long Beach Area Jewish Community Study 19
Figure 2.1 Index of Jewish engagement
The smallest share of Jewish adults is in the “Immersed” group (23%). The Immersed group tends to have the highest level of participation in every behavior measured in the Index of Jewish Engagement. Participation in Jewish life is critically important to their daily lives, but they do not necessarily engage in every item measured in this Index. Adults in the Immersed group have high participation in home-based holidays, ritual, organizational, and Jewish-focused activities, but their participation is comparatively lower when it comes to organization membership.
Table 2.1. Jewish behaviors and engagement
Demographics and Jewish engagement
The patterns of Jewish engagement are associated with respondents’ demographic characteristics. Tables 2.2, 2.3, and 2.4 show the distribution of selected demographic characteristics within the Jewish engagement categories (row totals) in comparison to the overall Jewish population (first row). To best understand demographic patterns, it is useful to compare the distribution of each demographic category within each of the engagement groups to that of the overall adult Jewish
2021-22
20
Long Beach Area Jewish Community Study
Personal Involved Immersed All Jewish adults 39 38 23 Holiday behaviors (past year) Seder, 2021 29 73 86 Hanukkah, typical year 62 74 94 Fasted on Yom Kippur, 2021 15 32 72 Ritual behaviors (past year) Shabbat meal/candles, ever 5 75 97 almost/always 0 14 48 Services, ever 4 70 100 monthly or more 0 2 63 High Holiday services, 2021 0 40 93 Follows any kosher rules 7 40 64 Organization behaviors (past year) Congregation member 1 13 94 Organization member 0 11 35 Informal group member 0 8 41 Participate in program, ever 11 64 96 often 0 2 45 Volunteer for Jewish organization 5 9 57 Donated to Jewish organization 23 60 99 Jewish-focused activities (past year) Study Jewish texts 7 49 88 Read Jewish publications 45 78 100 Engage with Jewish-focused culture 64 84 100 Follow news about Israel 86 91 100 Legend 0-19% 20-39% 40-59% 60-79% 80-100%
population, shown in the top row of each table. This comparison allows one to observe how, if at all, each engagement group differs from the overall population.
The age distribution of the Long Beach Area Jewish community differs across the engagement groups (Table 2.2). The Involved group has more younger people compared with the other groups; one third (34%) are younger than age 50. Half (53%) of the Personal group are ages 65 and older.
Geographic region is not related to Jewish engagement. Despite some differences shown in Table 2.3, these differences are not statistically significant.
Financial situation is not related to Jewish engagement. Despite some differences shown in Table 2.4, these differences are not statistically significant.
Jewish background and Jewish engagement
The best-known system for categorizing Jewish identity is denominational affiliation. In the past, Jewish denominational categories closely correlated with measures of Jewish engagement, including behavior and attitudes. However, because these labels are self-assigned, their meaning varies from one individual to another. In addition, an increasing number of Jews do not affiliate with any particular denomination including, as noted in Chapter 1, 38% of Jewish adults in the Long Beach Area. Thus, denominational labels are limited in their ability to convey behavior and attitudes.
2021-22 Long Beach Area Jewish Community Study 21
18-49 50-64 65+ Total All Jewish adults 22 34 44 100 Jewish engagement Personal 12 35 53 100 Involved 34 29 37 100 Immersed 18 41 41 100
Table 2.2. Jewish engagement by age
Long Beach Surrounding Areas Total All Jewish adults 57 43 100 Jewish engagement Personal 59 41 100 Involved 60 40 100 Immersed 46 54 100
Table 2.3. Jewish engagement by region
Struggling Enough Extra Well-off Total All Jewish adults 20 25 32 23 100 Jewish engagement Personal 26 20 26 28 100 Involved 17 25 43 16 100 Immersed 14 36 25 26 100
Table 2.4. Jewish engagement by financial situation
Tables 2.5, 2.6, 2.7, 2.8, and 2.9 describe the Jewish identity and Jewish backgrounds of those in each Jewish engagement category. Jewish denomination is related to Jewish engagement but is not identical (Table 2.5). Other than the Orthodox, adults of all denominations are represented in each of the engagement groups. Two thirds of those in the Personal group do not have a specific denomination. Around one third of Jewish adults in the Involved group are either Reform (38%) or Conservative (31%).
Most research indicates that childhood Jewish education and having two Jewish parents is associated with higher levels of Jewish engagement in adulthood. Although this pattern is noted in the Long Beach Area, the differences are not statistically significant (Tables 2.6 and 2.7).
Levels of Jewish engagement are similar among those who have minor children at home and those who do not (Table 2.8).
2021-22 Long Beach Area Jewish Community Study 22
Orthodox Conservative Reform Other denomination No denomination Total All Jewish adults 5 21 31 5 38 100 Jewish engagement Personal 0 8 20 5 66 100 Involved 1 31 38 5 26 100 Immersed 19 25 37 6 13 100
Table 2.5. Jewish engagement by denomination
Any childhood Jewish education No childhood Jewish education Total All Jewish adults 59 41 100 Jewish engagement Personal 50 50 100 Involved 65 35 100 Immersed 66 34 100
Table 2.6. Jewish engagement by childhood Jewish education (Jewish full- or part-time school or camp, during grades K-12)
No Jewish parents One Jewish parent Two Jewish parents Total All Jewish adults 8 22 70 100 Jewish engagement Personal 3 25 72 100 Involved 10 22 68 100 Immersed 14 16 70 100
Table 2.7. Jewish engagement by Jewish parents
Jewish engagement also differs by marital status (Table 2.9). Those in the Personal Engagement group are most likely to be intermarried (50%), and those in the Involved group are most likely to be single (45%). The Immersed group is most likely to be inmarried (63%).
Attitudes about being Jewish
The majority of Jews in the Long Beach Area feel that being Jewish is at least somewhat part of their daily lives (Figure 2.2). The extent to which that is the case, however, varies between the engagement groups. While among the Immersed group nearly all say being Jewish part of their daily lives, just under half (44%) of the Personal group feel that way.
There is a similar pattern when examining the importance of being Jewish (Figure 2.3). The majority of each of the engagement groups feel that being Jewish is important to how they see themselves. Nearly all in the Immersed group agree with this statement, as do two thirds of the Personal group.
2021-22 Long Beach Area Jewish Community Study 23
Parent of minor child Not parent Total All Jewish adults 12 88 100 Jewish engagement Personal 10 90 100 Involved 16 84 100 Immersed 10 90 100
Table 2.8. Jewish engagement by parent status
Inmarried Intermarried Not married Total All Jewish adults 33 32 36 100 Jewish engagement Personal 14 50 36 100 Involved 34 21 45 100 Immersed 63 17 20 100
Table 2.9. Jewish engagement by marital status
Not at all or only a little important
Moderately important Very important Extremely important
2021-22 Long Beach Area Jewish Community Study 24
Figure 2.2. Being Jewish is a part of daily life (% Jewish adults)*
18% 22% 23% 1% 18% 34% 11% 2% 42% 37% 55% 28% 23% 7% 11% 69% All Jewish adults Personal Involved Immersed Not at all Not much Some A great deal 28% 35% 11% <1% 25% 26% 33% 8% 34% 28% 40% 36% 23% 11% 17% 56% All Jewish adults Personal Involved Immersed
Figure 2.3. Importance of being Jewish to how you think about yourself (% Jewish adults)*
There is widespread agreement among the engagement groups about the importance of certain aspects of being Jewish (Figures 2.4, 2.5). Almost all Jews in the Long Beach Area believe that remembering the Holocaust and working for justice and equality are important or essential aspects of being Jewish. Jewish adults in all engagement groups share these attitudes.
2021-22 Long Beach Area Jewish Community Study 25
Figure 2.4. Remembering the Holocaust is essential to being Jewish (% Jewish adults)
1% 3% 1% 0% 22% 21% 22% 21% 77% 76% 77% 79% All Jewish adults Personal Involved Immersed Not important Important Essential 10% 12% 8% 12% 29% 26% 34% 25% 60% 62% 58% 62% All Jewish adults Personal Involved Immersed Not important Important Essential
Figure 2.5. Working for justice and equality in society is essential to being Jewish (% Jewish adults)
Although the groups appear to differ more regarding the degree to which they feel leading an ethical and moral life is essential to being Jewish, these differences are not statistically significant (Figure 2.6).
Figure 2.6. Leading an ethical and moral life is essential to being Jewish (% Jewish adults)
2021-22 Long Beach Area Jewish Community Study 26
4% 6% 4% <1% 24% 33% 25% 10% 72% 61% 72% 90% All Jewish adults Personal Involved Immersed Not important Important Essential
There is greater variation in opinions about other aspects of being Jewish. More than half of Jewish adults in the Immersed group believe that taking care of Jews in need is an essential part of being Jewish (Figure 2.7), compared with 22% of Jewish adults in the Personal group. While 77% of the Immersed group believe that observing Jewish law is either important (52%) or essential (25%) to being Jewish, just 39% of the Personal group agree that it is important (35%) or essential (4%) (Figure 2.8).
2021-22 Long Beach Area Jewish Community Study 27
Figure 2.7. Taking care of Jews in need is essential to being Jewish (% Jewish adults)*
19% 25% 21% 4% 45% 53% 40% 38% 37% 22% 39% 58% All Jewish adults Personal Involved Immersed Not important Important Essential 46% 62% 45% 23% 44% 35% 49% 52% 9% 4% 6% 25% All Jewish adults Personal Involved Immersed Not important Important Essential
Figure 2.8. Observing Jewish law is essential to being Jewish (% Jewish adults)*
For many Jewish adults, their Jewish identity includes components of culture, ethnicity, religion, and community. The majority of Jewish adults agree that each of these elements is at least “some” of what it means to be Jewish. That “being Jewish is a matter of culture,” however, finds agreement with the largest share of Jewish adults (59% “a great deal” and 33% “some”) (Figure 2.9).
Not at all Not much Some A great deal
2021-22 Long Beach Area Jewish Community Study 28
5% 13% 16% 19% 3% 16% 16% 9% 33% 31% 31% 42% 59% 39% 37% 30% Culture Ethnicity Religion Community Being Jewish is a matter of...
Figure 2.9. Meaning of being Jewish (% Jewish adults)
Among the Personal engagement group, there is the broadest agreement about the importance of culture to the meaning of being Jewish, followed by ethnicity (Figure 2.10). This group also places more importance on the community aspect of being Jewish that it does the religious aspect.
2021-22 Long Beach Area Jewish Community Study 29
4% 13% 19% 23% 7% 12% 30% 17% 47% 43% 29% 44% 42% 32% 21% 15% Culture Ethnicity Religion Community Being Jewish is a matter of... Not at all Not much Some A great deal
Figure 2.10. Meaning of being Jewish (Personal engagement group) (% Jewish adults)
The Involved group also ranks culture as the most important aspect of being Jewish (Figure 2.11). However, religion is slightly more important than community for members of this group as compared to the Personal group.
2021-22 Long Beach Area Jewish Community Study 30
5% 14% 20% 25% 1% 23% 11% <1% 28% 25% 32% 45% 66% 38% 37% 25% Culture Ethnicity Religion Community Being Jewish is a matter of... Not much Not at all Some A great deal
Figure 2.11. Meaning of being Jewish (Involved engagement group) (% Jewish adults)
The Immersed group also ranks culture highest of the elements of being Jewish, followed by the religion and community categories (Figure 2.12). A slightly smaller but nonetheless large share agree that being Jewish is very much a matter of ethnicity.
2021-22 Long Beach Area Jewish Community Study 31
5% 10% 3% <1% 0% 13% 1% <1% 17% 23% 31% 32% 78% 55% 67% 67% Culture Ethnicity Religion Community Being Jewish is a matter of... Not at all Not much Some A great deal
Figure 2.12. Meaning of being Jewish (Immersed engagement group) (% Jewish adults)
Chapter 3. Jewish Children
Chapter highlights
This chapter focuses on the choices parents make about how to raise their children and the extent to which children participate in Jewish educational opportunities available in the Long Beach Area Jewish community. The goal is to describe the landscape of educational programs, including Jewish preschools; formal Jewish education programs, both part-time and full-time; and informal Jewish educational programs, including camp, youth groups, and others.
• There are 4,600 children in Long Beach Area Jewish households, including 3,600 who are Jewish in some way.
• Of all children in Jewish households, 78% are considered to be Jewish in some way by their parents. This includes 67% of children who are Jewish only and 11% who are Jewish and another religion. The majority of the remaining children have no religion.
• All children of inmarried parents are Jewish, and three quarters of children of intermarried parents are Jewish. Most of the remaining children of intermarried parents have no religion.
Jewish education
• Twelve percent of age-eligible Jewish children were enrolled in a Jewish-sponsored early childhood program during the 2021-22 school year.
• One third of Jewish students in grades K-12 participated in some form of Jewish schooling during the 2021-22 school year, including 22% in a part-time school and 14% in a day school or yeshiva.
• Forty percent of Jewish K-12 students were in some form of year-round Jewish education, including schooling, private tutoring, congregational classes, or a youth group.
• In summer 2021, 30% of Jewish K-12 students attended a Jewish camp as a camper or staff member.
• One quarter of households with at least one child younger than age 12 participated in Jewish-sponsored programming such as a Tot Shabbat, synagogue-based playgroup, or family holiday group.
• Nearly one third of households with at least one child younger than age 13 received books from PJ Library or PJ Our Way.
Children in Jewish households
Of the 4,600 children living in Jewish households in the Long Beach Area, 3,600 (78% of all children) are considered Jewish in some way (Table 3.1). Most of these children are considered by their parents to be exclusively Jewish (3,100, or 67% of all children), while some are considered to be Jewish and another religion (500, or 11% of all children).
The remaining 1,000 children who are not considered Jewish by their parents, either have no religion (17% of all children), are being raised exclusively in another religion (2% of all children), or their
2021-22 Long Beach Area Jewish Community Study 32
parents have not determined yet how they will be raised or did not provide enough information to assess their Jewish identities (2% of all children).
Table 3.1. Children in Jewish households
Note: For the remainder of this chapter, analyses do not include the children whose Jewish identity is undetermined.
The largest group of Jewish children (37%) is ages five or younger (Table 3.2).
3.2. Ages of Jewish children
About half of Jewish children in the Long Beach Area have intermarried parents (53%), and one quarter of Jewish children have inmarried parents (Figure 3.1). About one fifth (21%) of Jewish children are being raised by single parents.
2021-22 Long Beach Area Jewish Community Study 33
Number All children (%) Jewish children 3,600 78% Jewish 3,100 67% Jewish and another religion 500 11% Not Jewish 1,000 22% No religion 800 17% Another religion 100 2% Undetermined* 100 2% Total 4,600 100%
Table
All Jewish children (%) 0-5 37 5-12 28 13-17 32 Unknown 3 Total 100
Inmarried 25% Intermarried 53% Single 21%
Figure 3.1. Marital status of parents of Jewish children (% Jewish children)
Nearly all children of inmarried parents are considered by their parents to be exclusively Jewish (Figure 3.2). By contrast, 61% of the children of intermarried parents are exclusively Jewish (Figure 3.3). Of those remaining, 14% are considered by their parents to be Jewish and another religion, 21% to have no religion, and 4% are considered to be members of another religion.
2021-22 Long Beach Area Jewish Community Study 34
Figure 3.2. Jewish identity of children of inmarried parents (% children)
Jewish 99% Jewish and another religion 1% Jewish 61% Jewish and another religion 14% No religion 21% Another religion 4%
Figure 3.3. Jewish identity of children of intermarried parents (% children)
Jewish education
Jewish education occurs in Jewish preschools, formal classroom settings, such as day schools and part-time supplementary schools, and informal settings, including camps, youth groups, and peer trips to Israel.
Table 3.3 shows the early childhood programs available to Jewish children not yet in kindergarten during the 2021-22 school year. Twelve percent of preschool-aged Jewish children attended Jewish early childhood or preschool programs. Most of the other preschool-aged Jewish children were in a non-Jewish program or home-based program.
Unlike the tables and figures earlier in this chapter, which focused only on children who are not yet age 18, the analysis of K-12 Jewish education includes 18- and 19-year-old children who are still in high school. Because the vast majority of children in Jewish education are being raised Jewish in some way, the analysis below is restricted to those children.
Of Jewish children in grades K-12 during the 2021-22 school year, one third (33%) were enrolled in a formal Jewish school (Table 3.4). Part-time Jewish schools were attended by 22% of age-eligible Jewish children, and another 14% were enrolled in a full-time Jewish day school. Fifteen percent of Jewish K-12 students were enrolled in other Jewish programs, including 5% who took private classes or were tutored in Jewish topics, 3% who participated in congregational classes, and 8% who participated in a Jewish youth group. In total, 40% of K-12 Jewish children received some form of Jewish education during the 2021-22 school year.
adults who are still in high school
Parents whose pre-K and K-12 children were not enrolled in any form of Jewish schooling (early childhood program, full-time school, or Jewish part-time school) were asked about the reasons why their children did not attend a Jewish school. More than two thirds (68%) of children not in Jewish
2021-22 Long Beach Area Jewish Community Study 35
Age-eligible Jewish children (%) Jewish program 12 Non-Jewish program 24 Public program 11 Home-based program 22 No program 32 Total 100
Table 3.3. Enrollment in early childhood programs, 2021-22
students in
(%) Formal Jewish schooling 33 Part-time school 22 Full-time school 14 Other Jewish programs 15 Private classes or tutoring 5 Congregational classes 3 Jewish youth group 8 Any Jewish education 40
Analyses of K-12 Jewish education
Table 3.4. Enrollment in K-12 Jewish education, 2021-22 Jewish
K-12
Note:
include 18- and 19-year-old
schooling did not attend because of a lack of parental interest (Table 3.5), and about one quarter (22%) did not attend due to cost. Other reasons for not attending Jewish schools were related to issues with location or the lack of transportation (14%), program fit (13%), or children’s needs (12%).
Note: Total exceeds 100% because respondents could select more than one reason.
Jewish camping and teen Israel programs
One quarter (24%) of Jewish K-12 students in the Long Beach Area attended a Jewish day camp in summer 2021, and 12% attended an overnight camp.
Just 2% of Jewish children ages 12 and older have participated on an organized teen trip to Israel.
Lifecycle celebrations
Fifty-seven percent of age-eligible Jewish children have had a bar or bat mitzvah ceremony, and an additional 10% will have one in the future.
Children’s programs
In addition to formal and informal education, family program options outside of school or preschool include Tot Shabbat, synagogue-based playgroups, and family holiday programs. One quarter of Jewish households attended at least one of these programs in the past year, 10% participated in person, 2% online, and 13% participated online and in person.
The PJ Library and PJ Our Way programs send Jewish books to households with at least one child ages 12 or younger. Among eligible households, 31% received books and an additional 19% were not aware of the program.
2021-22 Long Beach Area Jewish Community Study 36
Not interested 68 Cost 22 Location or transportation 14 Not a good religious fit 13 No good fit for the child 12 Hours do not work with schedule 10 Something else 15
Table 3.5. Reasons for not attending Jewish school in 2021-22 Jewish children not in Jewish school
(%)
Jewish children in K-12 (%) Any Jewish camp 30 Day camp 24 Overnight camp 12
Table 3.6. Enrollment in Jewish camps, summer 2021
Chapter 4. Congregations and Rituals
Chapter highlights
Congregational life has long been a central avenue of participation for Jews in the United States, and membership in a congregation is one important way Jews affiliate with the Jewish community. However, regardless of congregational membership status, many Jews participate in religious rituals on a regular or intermittent basis at home. Religious and ritual observance constitute one of the means by which Jews in the Long Beach Area express their Jewish identities.
Congregations and services
• Twenty percent of Jewish households belong to a Jewish congregation, but just 13% belong to a congregation in the Long Beach Area; the remainder belong to congregations in other areas, in most cases the neighboring communities of Los Angeles and Orange County.
• About one quarter of Jewish adults currently belong to a congregation and another one third belonged to one at some point in their adult lives.
• Among synagogue-member households, the largest share (37%) belong to a congregation outside of the Long Beach Area. Thirty percent pay dues to a “brick-and-mortar” synagogue, one with a building, clergy, and traditional membership structure, and another 5% say they are members but do not pay dues. Eighteen percent of member households belong to a Chabad in the Long Beach Area.
• Half of Jewish adults attended at least one Jewish religious service in the previous year, whether in person or online. Fourteen percent attended services monthly or more, and about one third of adults attended a High Holiday service in 2021. Among those who are not synagogue members, 35% attended at least one service.
• About half of Jewish adults (52%) had no preference between in-person and online services, but 35% preferred to attend services in person.
Rituals
• The most commonly observed holiday practice in the Long Beach Area is lighting Hanukkah candles, with roughly three quarters of adults lighting Hanukkah candles in a typical year. About two thirds of intermarried adults and two thirds of non-members of synagogues lit Hanukkah candles.
• Fifty-nine percent of adults attended a Passover seder in 2021, and this practice is much more prevalent among those younger than age 50, of whom 83% attended a seder.
• About one third of adults keep kosher at any level, and one third fasted for at least part of the day during Yom Kippur 2021.
• Thirty-seven percent of Jewish households lit Shabbat candles at some point during the previous year, and 37% also had a special meal for Shabbat. About three quarters of synagogue members, and one quarter of non-members, engaged in either behavior.
2021-22 Long Beach Area Jewish Community Study 37
Congregation membership
In the Long Beach Area, 20% of Jewish households include someone who currently belongs to a Jewish congregation, whether a synagogue, independent minyan or chavurah, Chabad, or other worship community (Table 4.1). Nationally, 35% of Jewish households include a member of a Jewish congregation. Thirteen percent of Jewish households belong to a congregation in the Long Beach Area.
Most (89%) of the Immersed group belong to one or more congregations, as do 14% of members of the Involved group. By contrast, almost none of the Personal group are members of congregations.
Just over one quarter (28%) of Jewish households in the Surrounding Areas belong to one or more congregations, compared with 16% of households from the Long Beach region.
About half (45%) of inmarried households belong to a congregation compared to 11% of intermarried households and 18% of not married households.
Nine percent of all member households belong to more than one congregation (not shown in table).
Congregation Types
Synagogue: Typically has its own building, a conventional dues/membership structure, professional clergy, and programs or amenities commonly available in synagogues (e.g., Hebrew school). Usually appeals to a relatively narrow range of the denominational spectrum.
Independent minyan or chavurah: May lack its own building, conventional dues/membership structure, professional clergy, and/or amenities commonly available in synagogues.
Chabad: Typically has its own building, professional clergy, and programs or amenities commonly available in synagogues. Usually does not have a conventional dues/membership structure. Draws from across the denominational spectrum.
2021-22 Long Beach Area Jewish Community Study 38
Table 4.1. Congregation membership
Jewish engagement often changes over time and sometimes in response to events, such as the closure of synagogues during the COVID-19 pandemic. The survey asked those who were not current members if they ever belonged to a congregation during their adult lives.
In addition to current members (20%), another third (32%) of Jewish adults in the Long Beach Area belonged to a Jewish congregation at some point in their adult lives, and the remaining 41% of Jewish adults never belonged to a congregation (Table 4.2). Three quarters of Jews in the Personal engagement group never belonged to a congregation, while 24% previously belonged to a congregation. While a comparatively smaller share (30%) of the Involved group never belonged to a congregation, a much larger share more than half (57%) previously belonged to a congregation.
Half of inmarried Jewish adults are current members, with 29% previously and 21% never belonging to a congregation. In contrast, a smaller share (13%) of intermarried Jewish adults are current members, with 25% previously and 62% never belonging to a congregation. Among those who were
2021-22 Long Beach Area Jewish Community Study 39
Any congregation (in or outside Long Beach Area) Congregation in the Long Beach Area only All Jewish households 20 13 Jewish engagement Personal 1 1 Involved 14 5 Immersed 89 63 Age 18-49 16 11 50-64 20 15 65+ 21 11 Region Long Beach 16 10 Surrounding Areas 28 17 Marital status Inmarried 45 29 Intermarried 11 7 Not married 18 11 Minor child in household No child in household 20 12 Child in household 22 15 Financial situation Struggling 15 11 Enough 29 16 Extra 17 11 Well-off 17 11
not married, a small share (17%) are current members, the majority previously (41%) or never (42%) belonging to a congregation.
Table 4.2. Current and past congregation membership during adulthood
Of the 20% of Jewish households that have any congregational membership, about one third (30%) pay dues to a synagogue located in the Long Beach Area, and another 5% belong to a local congregation but do not pay dues (Table 4.3) Eighteen percent of congregation-member households belong to a Long Beach Area Chabad. More than one-third (37%) of congregationmember households belong to a congregation outside of the Long Beach Area. Most of these congregations are located in Los Angeles or Orange County (not shown in table).
2021-22 Long Beach Area Jewish Community Study 40
Current member Former member Never member Total All Jewish adults 27 32 41 100 Jewish engagement Personal 1 24 75 100 Involved 13 57 30 100 Immersed 94 4 2 100 Age 18-49 22 26 52 100 50-64 29 32 39 100 65+ 27 34 39 100 Region Long Beach 22 31 47 100 Surrounding Areas 33 33 34 100 Marital status Inmarried 50 29 21 100 Intermarried 13 25 62 100 Not married 17 41 42 100 Parent of minor child Not parent 27 32 41 100 Parent 22 32 46 100 Financial situation Struggling 18 24 58 100 Enough 35 39 27 100 Extra 21 39 40 100 Well-off 30 23 46 100
Table 4.3. Type of congregation membership
Religious services
Participation in congregational life is not limited to those with membership. While a quarter of Jewish adults are current congregational members (Table 4.2), half of Jewish adults attended a Jewish religious service at least once during the past year, either in person or online (Table 4.4). Fourteen percent of Jewish adults attended services at least once per month, and about one third (36%) attended services on the High Holidays in 2021.
Three quarters (76%) of inmarried Jewish adults attended a Jewish religious service over the previous year, compared with one quarter (28%) of intermarried Jewish adults and about half (47%) of those who are not married.
2021-22 Long Beach Area Jewish Community Study 41
Beach Synagogue, dues paying Synagogue, no dues Chabad Independent minyan Congregation-member households 30 5 18 3 37 Jewish engagement Personal Involved 15 8 5 <1 63 Immersed 35 3 24 2 28 Age 18-49 24 11 19 0 27 50-64 37 8 28 4 26 65+ 30 1 10 3 45 Region Long Beach 27 7 22 <1 34 Surrounding Areas 35 3 14 6 40 Marital status Inmarried 30 9 18 <1 34 Intermarried 40 1 14 6 39 Not married 26 2 21 4 39 Minor child in household No child in household 30 4 16 4 40 Child in household 34 8 25 0 24 Financial situation Struggling Enough 31 5 14 4 45 Extra 34 5 25 7 39 Well-off 30 0 16 0 24
total
of congregation.
Long Beach Area Congregation Outside of Greater Long
Note: Row
does not add to 100% because respondents could select more than one type
About one-in-five (18%) Jewish adults who are not congregational members attended services during High Holidays 2021, compared with 87% of those who are currently congregational members (Table 4.4).
Those who attended a Jewish service in the past year were asked about their preferences for attending religious services in the future. Of those, one third (35%) indicated that they prefer to attend in person, 13% prefer online, while about half indicated that they prefer both options (Table 4.5).
2021-22 Long Beach Area Jewish Community Study 42
All Jewish adults 50 14 36 Jewish engagement Personal 4 0 0 Involved 70 2 40 Immersed 100 63 93 Age 18-49 50 12 30 50-64 59 15 47 65+ 43 15 30 Region Long Beach 44 10 32 Surrounding Areas 59 19 41 Marital status Inmarried 76 27 59 Intermarried 28 5 23 Not married 47 11 26 Parent of minor child Not parent 50 15 37 Parent 53 8 26 Financial situation Struggling 39 7 30 Enough 66 22 50 Extra 52 10 31 Well-off 40 13 32 Congregation member No 35 1 18 Yes 95 53 87
Table 4.4. Religious service attendance Services during past year, ever Services during past year, monthly High Holidays, 2021
Table 4.5. Preference for religious services
Jewish rituals
Most Jewish adults in the Long Beach Area celebrate Jewish holidays and observe some Jewish rituals. Three quarters of Jewish adults (74%) light Hanukkah candles in a typical year, and almost two thirds (59%) attended or hosted a Passover seder in 2021 (Table 4.6). Close to one third (32%) of Jewish adults keep any of the laws of kashrut or fasted for at least part of Yom Kippur in 2021 (34%).
Jewish adults ages 18 to 49 were more likely, compared with older adults, to have attended a seder in 2021.
2021-22 Long Beach Area Jewish Community Study 43
In person only Online only Both Total Jewish adults who attended services 35 13 52 100 Jewish engagement Personal -- -- -- 100 Involved 22 19 59 100 Immersed 50 5 45 100 Age 18-49 30 10 60 100 50-64 31 14 55 100 65+ 42 14 45 100 Region Long Beach 33 22 45 100 Surrounding Areas 37 4 59 100 Marital status Inmarried 44 9 48 100 Intermarried 32 13 55 100 Not married 23 19 58 100 Parent of minor child Not parent 33 14 53 100 Parent 49 2 49 100 Financial situation Struggling Enough 35 13 52 100 Extra 36 10 54 100 Well-off 60 18 23 100 Congregation member No 23 16 61 100 Yes 47 10 43 100
In the past, congregational membership was generally tied to engagement in Jewish life. However, the Jewish activities of non-members in the Long Beach Area Jewish community suggest congregational membership is not always the best indicator of Jewish engagement. About two thirds of non-members light Hanukkah candles, and half hosted or attended a seder during the past year.
Table 4.6. Ritual practices
*An additional 17% of Jewish adults did not fast for medical reasons.
Compared with the celebration of Jewish holidays (Table 4.6), fewer Jewish households engage with Jewish life by marking Shabbat with a special meal or candle lighting (Table 4.7). Jewish households with members younger than age 50 (59%) were more likely to have had a Shabbat dinner in the past year, compared with those ages 50-64 and those 65 and older (35% and 29% respectively). Jewish households with children were more likely to have had a special meal for Shabbat (51%) than households without children (34%) in the past year Congregation members were more likely to have
2021-22 Long Beach Area Jewish Community Study 44
All Jewish adults 74 59 32 34 Jewish engagement Personal 62 29 7 15 Involved 74 73 40 32 Immersed 94 86 64 72 Age 18-49 72 83 44 32 50-64 77 56 34 38 65+ 71 48 25 32 Region Long Beach 68 57 32 35 Surrounding Areas 81 61 33 33 Marital status Inmarried 94 82 45 48 Intermarried 69 37 19 32 Not married 60 57 33 24 Parent of minor child Not parent 72 57 32 35 Parent 84 65 34 22 Financial situation Struggling 81 58 27 37 Enough 69 59 30 44 Extra 73 67 39 25 Well-off 72 51 36 37 Congregation member No 67 51 22 23 Yes 92 80 59 64
Hanukkah candles, typical year Seder, 2021 Keeps kosher, any level Fasted Yom Kippur, 2021*
always or almost always had a Shabbat dinner (21%) or light Shabbat candles (33%), compared with non-congregation members (4% respectively).
Table 4.7. Marking Shabbat
2021-22 Long Beach Area Jewish Community Study 45
Shabbat dinner, past year Shabbat candles, past year Ever Always or almost always Ever Always or almost always All Jewish households 37 7 37 10 Jewish engagement Personal 3 0 2 0 Involved 57 6 56 8 Immersed 88 32 88 40 Age 18-49 59 7 46 7 50-64 35 7 41 10 65+ 29 7 28 9 Region Long Beach 37 7 33 9 Surrounding Areas 37 7 43 11 Marital status Inmarried 56 15 63 27 Intermarried 29 3 28 5 Not married 36 8 34 6 Minor child in household No child in household 34 7 34 9 Child in household 51 7 48 13 Financial situation Struggling 34 4 41 10 Enough 43 8 40 14 Extra 37 9 41 8 Well-off 35 8 26 6 Congregation member No 27 4 27 4 Yes 75 21 76 33
Chapter 5. Jewish Organizations and Philanthropy
Chapter highlights
The Long Beach Area Jewish community offers a wide range of opportunities for adults and families to engage in Jewish communal life. Jews join organizations and programs in person and online, attending cultural, educational, religious, and social programmatic offerings. They volunteer their time and donate their money to Jewish and non-Jewish causes.
This chapter describes the many ways in which Jews in the Long Beach Area interact and participate with their fellow community members and organizations
Memberships
• Seven percent of Jewish households belong to the Alpert JCC. The membership rate is the same for those living in the Long Beach region and those who live in the Surrounding Areas. However, a larger share of adults in the Long Beach region participated in programs sponsored by the JCC than those in the Surrounding Areas.
Program participation and individual activities
• Half of Jewish adults participated in a Jewish program, in person or online, in the previous year, including 11% of the Personal group, 64% of the Involved group, and 96% of the Immersed group.
• Nearly three quarters of Jewish adults participated in cultural activities (Jewish or otherwise), and about half participated in outdoor or active activities. Thirty-six percent of Jewish adults participated in educational and social action activities.
• About one-in-five Jewish adults participated in a program sponsored by a local Jewish synagogue, and 13% participated in a program sponsored by a local Chabad. A larger share of inmarried than intermarried or single adults participated in these programs.
• The most commonly attended types of Jewish programs were religious (attended by 22% of Jewish adults) or educational (19%). While 11% of all adults attended a social action program, 22% of adults ages 18-49 attended this type of program.
• Nearly all Jewish adults engaged in individual Jewish activities over the past year, most commonly talking about Jewish topics (93%), eating traditional Jewish foods (92%), or reading books, watching movies or TV, or listening to music that was Jewish focused (80%).
Volunteering and philanthropy
• Forty-two percent of Jewish adults volunteered for at least one organization or cause in the previous year, including 9% who volunteered only for Jewish organizations, 24% who volunteered only for non-Jewish organizations, and 9% who volunteered for both.
2021-22 Long Beach Area Jewish Community Study 46
• More than half (56%) of Jewish households donated to a Jewish organization in the past year, and 6% donated to Jewish Long Beach or the Alpert JCC. Fewer financially struggling households compared to other households made any Jewish donations.
• About one quarter of Jewish adults said that Jewish congregations are one of the most important causes to which they might donate or volunteer. However, a greater share of Jewish adults reported that a variety of non-Jewish causes are important to them, including health and human services (61%) and social justice (50%).
Organization membership and participation
Organizational membership is another way that households in the Long Beach Area community engage in Jewish life. Seven percent of Jewish households are members of the Alpert JCC, 8% are members of a local Jewish organization aside from the Alpert JCC or synagogues, and 7% are members of an informal or grassroots group in the area (Table 5.1). Significantly more households from the Immersed group belong to Jewish organizations aside from the JCC or synagogues (30%), compared to the Involved group (8%). Households in the Personal and Involved groups are equally involved (5%) in the Alpert JCC. Those households with members ages 65 and older are twice as likely (11%) as those with younger Jewish adults (5%) to be members of a Jewish organization aside from the Alpert JCC or synagogues.
2021-22 Long Beach Area Jewish Community Study 47
Table 5.1. Organization memberships in the Long Beach Area Alpert
Jewish adults engage most often in activities that are primarily cultural (72%) and outdoor or active (51%) (Table 5.2a) Activities that are primarily educational (36%) and those that are primarily social action (36%) appear to be less appealing
2021-22 Long Beach Area Jewish Community Study 48
JCC Jewish organizations or clubs in Greater Long Beach
All Jewish households 7 8 7 Jewish engagement Personal 5 0 0 Involved 5 8 8 Immersed 14 30 23 Age 18-49 5 5 13 50-64 4 5 4 65+ 9 11 6 Region Long Beach 7 7 7 Surrounding Areas 7 8 6 Marital status Inmarried 12 17 15 Intermarried 5 4 5 Not married 6 7 5 Child in household No child in household 6 8 5 Child in household 11 7 16 Financial situation Struggling 6 3 5 Enough 8 6 11 Extra 6 5 5 Well-off 6 12 4
Informal or grassroots Jewish group in the Long Beach Area
Table 5.2a. Types of activities regularly engaged in (including Jewish and non-Jewish settings)
About one quarter of Jewish adults in the Long Beach Area community are engaged in primarily social activities (Table 5.2b). However, Jewish adults ages 18-49 (47%) are significantly more likely to engage in primarily social activities, compared with those ages 65 and older (11%). Intermarried Jewish adults (39%) are more likely to engage in primarily social activities, compared with those who are inmarried (17%) and those who are not married (22%).
2021-22 Long Beach Area Jewish Community Study 49
Primarily cultural Primarily outdoors or active Primarily educational Primarily social action All Jewish adults 72 51 36 36 Jewish engagement Personal 76 50 29 30 Involved 68 55 34 34 Immersed 72 49 50 52 Age 18-49 76 62 34 38 50-64 77 52 38 42 65+ 66 45 34 31 Region Long Beach 72 46 32 34 Surrounding Areas 72 60 40 40 Marital status Inmarried 69 55 33 33 Intermarried 77 58 30 38 Not married 70 42 42 38 Parent of minor child Not parent 72 50 34 35 Parent 75 62 51 47 Financial situation Struggling 65 54 28 27 Enough 81 54 44 52 Extra 71 45 37 27 Well-off 74 54 32 33
Table 5.2b. Types of activities regularly engaged in (including Jewish and non-Jewish settings)
While the previous tables refer to all activities, whether or not in a Jewish setting, the remaining tables in this chapter describe activities and programs that take place in Jewish settings or are sponsored by Jewish organizations.
In the year prior to the study, about half of Jewish adults in the Long Beach Area never participated in Jewish programs, 26% participated rarely, 15% sometimes, and 11% often (Table 5.3). Participation differed widely across engagement groups. In the Personal group, 89% never participate in any programs. In the Immersed group, 36% participated sometimes, and 45% participated often.
2021-22 Long Beach Area Jewish Community Study 50
Primarily social Primarily spiritual or religious Primarily political Other All Jewish adults 26 20 17 11 Jewish engagement Personal 30 8 16 13 Involved 23 14 20 10 Immersed 23 52 15 9 Age 18-49 47 23 30 10 50-64 30 28 16 8 65+ 11 12 11 13 Region Long Beach 31 17 17 10 Surrounding Areas 18 25 17 12 Marital status Inmarried 17 24 14 12 Intermarried 39 17 26 9 Not married 22 20 12 10 Parent of minor child Not parent 25 21 18 12 Parent 31 17 14 <1 Financial situation Struggling 32 20 3 7 Enough 34 41 28 13 Extra 16 12 8 10 Well-off 27 8 21 15
Table 5.3. Frequency of Jewish program participation, past year
2021-22 Long Beach Area Jewish Community Study 51
Never Rarely Sometimes Often Total All Jewish adults 49 26 15 11 100 Jewish engagement Personal 89 8 3 <1 100 Involved 36 47 14 2 100 Immersed 4 15 36 45 100 Age 18-49 29 42 16 13 100 50-64 51 24 16 9 100 65+ 57 19 13 11 100 Region Long Beach 47 30 12 11 100 Surrounding Areas 51 20 19 11 100 Marital status Inmarried 43 19 21 17 100 Intermarried 65 18 11 6 100 Not married 41 39 11 9 100 Parent of minor child Not parent 47 27 15 11 100 Parent 58 20 13 8 100 Financial situation Struggling 46 31 16 6 100 Enough 52 17 16 16 100 Extra 42 38 15 6 100 Well-off 63 10 15 13 100
Table 5.4 focuses on participation in four sponsored programs in the Long Beach Area and the ways in which people participated. The largest share of Jewish adults participated in programs with local congregations (aside from religious services).
2021-22 Long Beach Area Jewish Community Study 52
Participated in any way Did not participate Participated in person only Participated online only Participated in person and online A congregation in the Long Beach Area (aside from religious services) 21 79 7 7 8 A Chabad in the Long Beach Area 13 87 6 5 2 Alpert JCC 10 90 4 3 3 Jewish Long Beach 7 93 3 3 2
Table 5.4 Type of participation by program sponsor
Table 5.5 looks at program participation and sponsoring organization by subgroups. People in the Long Beach region (14%) were more likely than people from the Surrounding Areas (5%) to participate in a program sponsored by the Alpert JCC.
2021-22 Long Beach Area Jewish Community Study 53
A
All Jewish adults 21 13 10 7 Jewish engagement Personal 1 0 3 <1 Involved 16 8 13 8 Immersed 66 44 17 21 Age 18-49 29 13 12 12 50-64 21 14 7 7 65+ 17 11 11 4 Region Long Beach 19 13 14 8 Surrounding Areas 24 12 5 7 Marital status Inmarried 38 23 16 13 Intermarried 9 7 5 3 Not married 16 8 9 7 Parent of minor child Not parent 21 13 10 8 Parent 23 13 13 4 Financial situation Struggling 12 10 6 3 Enough 27 17 13 11 Extra 18 9 10 2 Well-off 25 18 12 10
Table 5.5. Sponsors of Jewish programs, past year A congregation in the Long Beach Area
Chabad in the Long Beach Area Alpert JCC Jewish Long Beach
Long Beach Area Jews participated in a variety of types of programs (Tables 5.6a and 5.6b). About one-in-five Jewish adults attended primarily religious programs (22%) or primarily educational programs (19%).
Jewish adults younger than age 50 were significantly more likely (22%) to participate in social action programs, compared with those ages 50 to 64 (10%) and those ages 65 and older (5%). Those younger than age 50 were also significantly more likely (14%) to participate in primarily social programs, compared with those ages 50 to 64 (4%) and those ages 65 and older (1%).
2021-22 Long Beach Area Jewish Community Study 54
Primarily religious (aside from services) Primarily educational Primarily cultural Primarily social action All Jewish adults 22 19 12 11 Jewish engagement Personal 0 3 <1 <1 Involved 20 13 13 11 Immersed 65 59 32 28 Age 18-49 29 16 14 22 50-64 19 25 13 10 65+ 22 17 11 5 Region Long Beach 18 16 10 12 Surrounding Areas 29 24 16 9 Marital status Inmarried 34 28 19 13 Intermarried 8 9 12 10 Not married 23 20 7 10 Parent of minor child Not parent 22 20 13 11 Parent 19 16 9 9 Financial situation Struggling 13 20 11 14 Enough 30 27 21 12 Extra 17 19 10 9 Well-off 17 11 10 11
Table 5.6a. Type of program sponsored by Jewish organization, past year
Table
2021-22 Long Beach Area Jewish Community Study 55
Primarily outdoors or active Primarily social Primarily political Other All Jewish adults 5 5 3 2 Jewish engagement Personal 1 <1 0 3 Involved 6 7 1 1 Immersed 12 11 14 2 Age 18-49 9 14 2 1 50-64 6 4 6 2 65+ 3 1 2 2 Region Long Beach 2 4 3 2 Surrounding Areas 10 7 5 2 Marital status Inmarried 14 10 6 1 Intermarried <1 5 3 2 Not married 2 1 2 2 Parent of minor child Not parent 4 4 4 2 Parent 12 13 1 <1 Financial situation Struggling <1 2 1 4 Enough 7 2 6 1 Extra 7 5 1 2 Well-off 6 6 7 1
5.6b. Type of program sponsored by Jewish organization, past year
Jewish-focused activities
In addition to participation in formal organizations and programs, Jewish adults engage in Jewish life through informal activities, such as discussing Jewish topics, eating traditional Jewish foods, reading Jewish books, watching movies or TV, or listening to music (Tables 5.7a and 5.7b). Nearly all Jewish adults (93%) in the Long Beach Area Jewish community discussed Jewish topics during the past year, including about one third (29%) who did so often. Nearly all Jewish adults (92%) also ate Jewish foods, including about one quarter (23%) who did so often; similarly, most Jewish adults (80%) read books, watch movies or TV, or listen to music with Jewish themes, including 19% who consumed these aspects of Jewish culture often.
Most Jewish adults in the Immersed group (59%) discussed Jewish topics often, compared with the Personal (5%) and Involved (30%) groups. Those younger than age 50 were more likely (96%) than those ages 50 to 64 (73%) and 65 and older (77%) to have read books, watched movies or TV, or to have listened to music with Jewish themes in the past year. Jewish adults from the Surrounding Areas (32%) were more likely to eat Jewish foods often, compared with those from the Long Beach Area (17%).
2021-22 Long Beach Area Jewish Community Study 56
Table 5.7a. Jewish-focused activities, past year
2021-22 Long Beach Area Jewish Community Study 57
Talk about Jewish topics Eat traditional Jewish foods Read books, watch movies or TV, listen to music Ever Often Ever Often Ever Often All Jewish adults 93 29 92 23 80 19 Jewish engagement Personal 87 5 84 8 64 7 Involved 94 30 96 24 84 14 Immersed 100 59 99 48 100 47 Age 18-49 98 45 91 20 96 17 50-64 95 24 93 22 73 15 65+ 88 24 92 26 77 23 Region Long Beach 92 31 94 17 85 18 Surrounding Areas 94 25 89 32 73 20 Marital status Inmarried 94 34 89 32 83 25 Intermarried 91 21 90 13 66 13 Not married 93 31 96 24 89 18 Parent of minor child Not parent 92 29 94 24 81 20 Parent 97 23 79 14 72 14 Financial situation Struggling 93 41 91 28 81 20 Enough 98 30 97 30 86 24 Extra 92 22 87 13 76 14 Well-off 85 21 95 23 72 22
During the past year, about three quarters of Jewish adults (70%) in the Long Beach Area Jewish community read Jewish publications, including 20% who did so often (Table 5.7b). About half of Jewish adults (48%) read or posted on social media about Jewish life, including 7% who did so often. Finally, 42% of Jewish adults studied Jewish texts, including 8% who did so often.
Jewish adults ages 18 to 49 had the largest share among the age groups (81%) of those who read Jewish publications in the past year, and often read or posted on social media about Jewish life (17%).
Table 5.7b. Jewish-focused activities, past year
2021-22 Long Beach Area Jewish Community Study 58
Jewish publications Read or post on social media about Jewish life Study Jewish texts Ever Often Ever Often Ever Often All Jewish adults 70 20 48 7 42 8 Jewish engagement Personal 45 3 35 0 7 0 Involved 78 16 45 5 49 5 Immersed 100 57 78 24 88 28 Age 18-49 81 19 57 17 40 14 50-64 78 17 59 7 51 8 65+ 58 22 34 1 36 5 Region Long Beach 72 18 48 5 35 9 Surrounding Areas 68 22 50 11 52 7 Marital status Inmarried 73 27 48 10 55 12 Intermarried 57 16 56 3 20 4 Not married 80 16 43 9 49 9 Parent of minor child Not parent 71 21 47 7 41 7 Parent 71 14 66 14 48 11 Financial situation Struggling 81 21 62 8 38 7 Enough 72 29 55 14 56 19 Extra 67 13 42 4 39 4 Well-off 60 20 35 1 30 5
Read
Volunteering and philanthropy
In the Long Beach Area Jewish community, almost half of Jewish adults (42%) volunteered in the past year, 9% volunteered exclusively for or with Jewish organizations, 9% volunteered for or with both Jewish and non-Jewish organizations, and 24% volunteered exclusively for or with non-Jewish organizations (Table 5.8).
The types of volunteering differ based on respondent characteristics. Members of the Immersed group had the largest share who volunteered with exclusively Jewish causes (25%) and with both Jewish and non-Jewish organizations (32%), Personal and Involved groups had the largest shares who volunteered for exclusively non-Jewish organizations (30% and 27% respectively).
Table 5.8. Volunteering in past year
2021-22 Long Beach Area Jewish Community Study 59
Both Jewish and non-Jewish Jewish only Non-Jewish only Did not volunteer or don’t know Total All Jewish adults 9 9 24 58 100 Jewish engagement Personal 2 3 30 65 100 Involved 3 7 27 64 100 Immersed 32 25 8 35 100 Age 18-49 9 12 25 54 100 50-64 11 6 36 47 100 65+ 7 10 14 69 100 Region Long Beach 9 11 26 54 100 Surrounding Areas 9 7 21 63 100 Marital status Inmarried 11 17 20 51 100 Intermarried 11 3 29 57 100 Not married 5 6 24 64 100 Parent of minor child Not parent 9 9 22 59 100 Parent 8 7 38 47 100 Financial situation Struggling 6 3 19 72 100 Enough 14 15 33 38 100 Extra 6 9 22 64 100 Well-off 10 11 28 51 100
Most Jewish households (85%) reported making a charitable contribution in the past year (Table 5.9). About half gave to both Jewish and non-Jewish organizations, 5% gave only to Jewish organizations, and 29% gave only to non-Jewish organizations.
Jewish households in the Personal (49%) and Involved (18%) engagement groups had larger shares that donated only to non-Jewish organizations, compared to households in the Immersed group (1%).
Those Jewish households in the Immersed and Involved engagement groups had larger shares that donated to both Jewish and non-Jewish organizations (85% and 64%, respectively), compared to households in the Personal group (27%). Financially well-off households had the largest share that donated to non-Jewish organizations (40%), compared with households that were less financially comfortable.
Six percent of Jewish households donated to Jewish Long Beach or the Alpert JCC.
2021-22 Long Beach Area Jewish Community Study 60
Table 5.9. Donations in past year
Regardless of their status as volunteers or donors, respondents were asked about the most important causes for which they might volunteer or to which they might donate (Table 5.10a and 5.10b).
Among the causes that Jewish adults in the Long Beach Area community indicated volunteering for or donating to, the most popular was health and human services (61%), followed by social justice (50%), and the environment (36%). With regard to explicitly Jewish-related causes, 23% of Jewish adults cited Jewish congregations, and 19% cited Jewish education or Israel (both 19%) as important causes for volunteering or philanthropy (Figure 5.1).
2021-22 Long Beach Area Jewish Community Study 61
Both Jewish and non-Jewish Jewish only Non-Jewish only Did not donate or don’t know Donated to Jewish Long Beach or Alpert JCC All Jewish households 51 5 29 15 6 Jewish engagement Personal 27 <1 49 23 1 Involved 64 7 18 11 8 Immersed 85 14 1 <1 14 Age 18-49 47 3 31 19 3 50-64 50 8 26 16 6 65+ 53 3 31 12 7 Region Long Beach 50 3 31 15 5 Surrounding Areas 52 8 26 14 7 Marital status Inmarried 65 4 16 15 15 Intermarried 47 5 39 9 5 Not married 48 5 26 20 3 Minor child in household No child in household 49 5 31 14 6 Child in household 60 5 18 18 5 Financial situation Struggling 41 4 19 36 5 Enough 57 5 29 10 5 Extra 49 6 31 14 5 Well-off 53 4 40 3 9
Figure 5.1. Important cause for volunteering or donating (% Jewish adults)
Note: Causes that are specifically Jewish are indicated in blue.
For those in the Immersed group, the relative order of important Jewish causes is the same as that for all Jewish adults (Table 5.10). This is also the case for those Jewish adults who are inmarried. However, for those in the Personal and Involved groups, interest in Israel is slightly higher than interest in Jewish education.
2021-22 Long Beach Area Jewish Community Study 62
8% 12% 19% 19% 23% 28% 31% 36% 50% 61% Hillel Something else Israel Jewish education Jewish congregation Other education Arts and culture Environment Social justice Health and human services
Table 5.10. Most important Jewish causes for volunteering or donating
2021-22 Long Beach Area Jewish Community Study 63
Jewish congregation Jewish education Israel Hillel All Jewish adults 23 19 19 8 Jewish engagement Personal 6 10 14 1 Involved 18 7 13 4 Immersed 63 60 37 31 Age 18-49 18 16 17 5 50-64 31 25 17 7 65+ 18 17 20 11 Region Long Beach 20 20 16 9 Surrounding Areas 27 19 23 8 Marital status Inmarried 37 32 23 19 Intermarried 15 15 16 3 Not married 17 11 16 3 Parent of minor child Not parent 24 19 20 9 Parent 16 21 11 7 Financial situation Struggling 28 28 32 3 Enough 31 19 22 10 Extra 18 16 14 5 Well-off 20 16 11 18
There are few differences in important non-Jewish causes by demographic group (Table 5.11).
Table 5.11. Most important non-Jewish causes for volunteering or donating Health and human services
2021-22 Long Beach Area Jewish Community Study 64
Social justice Environment Arts and culture Other education Something else All Jewish adults 61 50 36 31 28 12 Jewish engagement Personal 63 52 41 28 24 14 Involved 60 46 30 34 24 11 Immersed 58 52 37 32 44 9 Age 18-49 74 48 44 37 40 24 50-64 62 55 39 26 21 8 65+ 53 46 29 34 28 8 Region Long Beach 61 48 42 33 29 16 Surrounding Areas 60 52 27 29 26 5 Marital status Inmarried 55 50 32 24 33 8 Intermarried 67 56 38 25 24 17 Not married 61 45 36 43 27 10 Parent of minor child Not parent 62 50 36 34 28 13 Parent 56 44 33 17 35 4 Financial situation Struggling 68 58 49 32 24 23 Enough 65 56 34 34 24 3 Extra 64 44 26 25 26 13 Well-off 47 43 34 41 33 10
Chapter 6. Community, Connections, and Concerns
Chapter highlights
Jews in the Long Beach Area have many ways of expressing their connection to the Jewish community. Some feel a sense of belonging to the worldwide or local Jewish community, to an online community, or to Jewish friends. Some conditions encourage participation in the Jewish community, whereas some limitations prevent people from their desired involvement. Jewish adults are also concerned about antisemitism in the United States and wider world. This chapter explores feelings of belonging, connections to the Jewish community and Jewish friends, welcoming conditions and perceived barriers to participation in the local Jewish community, and concerns about and experiences of antisemitism.
Feelings of belonging and satisfaction with participation
• Nearly three quarters (72%) of Jewish adults feel some sense of belonging to the Long Beach Area Jewish community. This includes about half of intermarried Jewish adults, compared to 79% of single adults and 83% of inmarried adults.
• Two thirds of Jewish adults are somewhat or very satisfied with their level of participation with the Long Beach Area Jewish community. Eighty percent of Jewish adults ages 18-49 are somewhat (67%) or very satisfied (13%), compared to about 60% of older adults.
• About 30% of the Personal engagement group and 40% of the Involved Group are not at all or not too satisfied with their participation in the Long Beach Area Jewish community.
• About one third of Jewish adults who do not feel any sense of belonging to the Long Beach Area Jewish community are not at all (17%) or not too (16%) satisfied with their level of participation.
Welcoming and limiting conditions
• Nearly three quarters of Jewish adults feel welcome and comfortable at Jewish programs when they know someone there, and over half feel welcome and comfortable when they are personally invited. Nearly half of Jewish adults feel comfortable when people with diverse backgrounds attend programs. All of these conditions were more important to younger adults than to older adults.
• Jewish adults in households that include members of key subgroups were asked about their impressions of Jewish organizations. These households include someone who is LGBTQ, someone who has a health issue or disability, someone who is intermarried, and someone who identifies as a person of color. Few Jewish adults in these households described Jewish organizations as unwelcoming. However, large shares of Jewish adults with a household member in one of these categories had no opinion about whether Jewish organizations are welcoming; this may indicate that these individuals are not involved enough to have formed an opinion.
2021-22 Long Beach Area Jewish Community Study 65
• Eighty percent of all Jewish adults encountered at least one condition that limited their desired participation in the Long Beach Area Jewish community. The most frequently encountered condition was not knowing many people (41%). Three quarters of Jewish adults ages 18-49 cited this condition, compared to about one third of older Jewish adults.
• The next two most common limitations to desired participation in the Long Beach Area Jewish community were not finding interesting activities (34%) and the COVID-19 pandemic (33%).
Antisemitism
• Three quarters of Jewish adults are very concerned about antisemitism around the world, and 69% are very concerned about antisemitism in the United States. Fifteen percent of Jewish adults personally experienced antisemitism in the previous year.
Feelings of connection to the Jewish community
Nearly all Jewish adults in the Long Beach Area (94%) feel at least some sense of belonging to the Jewish people, including 41% who feel a great deal of belonging (Table 6.1). By contrast, about three quarters (72%) of Jewish adults feel some sense of belonging to the Long Beach Area Jewish community specifically, including 9% who feel a great deal of belonging. Connections to an online Jewish community are weaker, with half (52%) feeling some sense of belonging and 7% who feel a great deal of belonging.
Feelings of belonging vary by Jewish engagement. About three quarters (73%) of the Immersed group feel a great deal of belonging to the Jewish people, compared with one quarter (25%) of the Personal group. In addition, one quarter (25%) of the Immersed group feel a great deal of belonging to the Long Beach Area Jewish community, compared to 4% of the Involved group and 1% of the Personal group.
2021-22 Long Beach Area Jewish Community Study 66
Table 6.1. Feeling
a sense of
belonging
to…
The Jewish people The Long Beach Area Jewish community An online Jewish community
2021-22 Long Beach Area Jewish Community Study 67
Any A great deal Any A great deal Any A great deal All Jewish adults 94 41 72 9 52 7 Jewish engagement Personal 86 25 50 1 33 0 Involved 99 38 78 4 56 2 Immersed 98 73 95 25 77 28 Age 18-49 100 30 83 17 65 7 50-64 89 34 62 9 50 8 65+ 94 52 74 5 47 5 Region Long Beach 92 38 73 11 51 5 Surrounding Areas 95 45 71 8 54 9 Marital status Inmarried 97 54 83 15 59 10 Intermarried 86 32 53 7 42 4 Not married 96 37 79 7 55 6 Parent of minor child Not parent 95 43 73 10 54 7 Parent 83 29 65 7 42 5 Financial situation Struggling 92 39 67 17 60 3 Enough 95 48 73 6 62 13 Extra 97 30 80 5 48 3 Well-off 94 41 62 11 41 3
Two thirds of Jewish adults are satisfied with their level of participation in the Long Beach Area Jewish community, including about one quarter (23%) who are very satisfied and close to a half (43%) who are somewhat satisfied (Table 6.2). About one third of Jewish adults are not satisfied with their level of participation, including 22% who are not too satisfied and 13% who are not at all satisfied.
Jewish engagement groups have different degrees of satisfaction when it comes to their level of participation in the Jewish community. Forty-one percent of those in the Personal group are very satisfied with the level of their participation, compared with 21% of the Immersed group and 7% of the Involved group. However, there are still many in the Personal group who are looking for more connection: One fifth (19%) are not too satisfied with their level of participation and 11% are not at all satisfied.
Those ages 65 and older have the greatest share one third who are very satisfied with their level of participation, compared with 19% of those ages 50 to 64 and 13% of those ages 49 and younger.
Satisfaction with the level of one’s participation is also related to finances. People who are financially struggling are least likely to be very satisfied (13%) with their level of participation, compared with those who are well-off (38%).
Those who feel no sense of belonging to the Long Beach Area Jewish community are also most likely to not be satisfied with their level of participation (33%), including 16% that are not too satisfied and 17% who are not at all satisfied, compared to those who feel a great deal of belonging but are not satisfied with their level of participation (1%).
2021-22 Long Beach Area Jewish Community Study 68
Table 6.2. Satisfaction with level of participation in the Long Beach Area Jewish community
2021-22 Long Beach Area Jewish Community Study 69
Not at all satisfied Not too satisfied Somewhat satisfied Very satisfied Total All Jewish adults 13 22 43 23 100 Jewish engagement Personal 11 19 29 41 100 Involved 15 26 53 7 100 Immersed 5 21 54 21 100 Age 18-49 3 18 67 13 100 50-64 9 31 41 19 100 65+ 19 16 33 32 100 Region Long Beach 13 21 45 21 100 Surrounding Areas 13 23 39 25 100 Marital status Inmarried 20 15 44 21 100 Intermarried 8 24 40 27 100 Not married 10 25 45 20 100 Parent of minor child Not parent 14 23 41 22 100 Parent 2 13 54 30 100 Financial situation Struggling 16 38 28 13 100 Enough 14 29 40 16 100 Extra 8 15 58 19 100 Well-off 6 10 37 38 100 Belonging to the Long Beach Area Jewish community Not at all 17 16 23 44 100 Not much 10 22 50 18 100 Some 15 29 49 7 100 A great deal 1 9 58 32 100
Welcoming and limiting conditions
Knowing the conditions that make individuals feel welcome in Jewish spaces, as well as those that are barriers to participation, can guide community organizations in outreach efforts.
When asked what makes people feel welcome and comfortable at Jewish events, most Jewish adults (89%) identified at least one condition (Tables 6.3a and 6.3b). Three quarters (74%) of Jewish adults feel more welcome when they know other people, and more than half (57%) said that being personally invited makes them feel welcome and comfortable. Close to half of Jewish adults (46%) said they feel welcome and comfortable when people with diverse backgrounds attend, while slightly fewer (40%) said they feel welcome when they see themselves reflected in the people who attend.
Jewish engagement groups differ in their assessments of which conditions which make them feel welcome and comfortable. Larger shares of the Immersed group indicated that they feel welcome when they see themselves reflected in the people who attend, compared with 42% of the Involved and 19% of the Personal group. People ages 49 and younger (67%) are most likely to indicate that they feel welcome and comfortable when people with diverse backgrounds attend, compared with those ages 50 to 64 (50%) and those ages 65 and older (32%).
2021-22 Long Beach Area Jewish Community Study 70
Table 6.3a. Conditions that make people feel welcome and comfortable at Jewish programs
2021-22 Long Beach Area Jewish Community Study 71
Any welcoming condition Know other people there Personally invited People with diverse backgrounds attend Reflected in people who attend All Jewish adults 89 74 57 46 40 Jewish engagement Personal 76 59 49 34 19 Involved 97 81 62 55 42 Immersed 97 86 60 53 72 Age 18-49 96 90 68 67 56 50-64 93 74 63 50 51 65+ 82 65 46 32 21 Region Long Beach 92 76 60 50 35 Surrounding Areas 85 72 53 41 46 Marital status Inmarried 92 77 48 42 53 Intermarried 83 69 64 49 32 Not married 91 75 59 48 34 Parent of minor child Not parent 88 72 57 45 37 Parent 94 84 54 63 66 Financial situation Struggling 96 73 70 50 41 Enough 96 71 59 55 49 Extra 84 76 47 51 42 Well-off 81 70 50 27 28 Belonging to the Long Beach Area Jewish community Not at all 80 54 57 37 27 Not much 90 75 42 52 36 Some 93 83 62 46 47 A great deal 100 95 87 57 60 Satisfaction with participation Not at all / Not too satisfied 99 85 71 45 41 Somewhat satisfied 94 80 56 56 48 Very satisfied 63 45 40 33 24
People mentioned that they feel welcome when Jewish rituals are explained (34%), when policies around inclusion and diversity are made explicit (27%), when events have no religious components (24%), and when they are encouraged to take a leadership role (10%).
Larger shares of those from the Personal engagement group (34%) indicated that they feel welcome when events have no religious components, compared with the Involved (21%) and Immersed (11%) groups. More people ages 18 to 49 (40%) indicated that they feel welcome when events have no religious components, compared with those ages 50 to 64 (25%) and those ages 65 and older (14%).
2021-22 Long Beach Area Jewish Community Study 72
Table 6.3b. Conditions that make people feel welcome and comfortable at Jewish programs
2021-22 Long Beach Area Jewish Community Study 73
rituals are explained Policies around inclusion and diversity are made explicit Events have no religious components Encouraged to take a leadership role Something else All Jewish adults 34 27 24 10 6 Jewish engagement Personal 28 22 34 7 0 Involved 35 30 21 8 2 Immersed 42 32 11 21 15 Age 18-49 51 41 40 18 2 50-64 35 29 25 13 2 65+ 24 19 14 3 7 Region Long Beach 39 29 30 11 9 Surrounding Areas 28 26 15 8 2 Marital status Inmarried 24 17 12 12 8 Intermarried 38 34 32 5 2 Not married 40 31 28 13 3 Parent of minor child Not parent 36 28 24 11 7 Parent 16 24 24 4 2 Financial situation Struggling 48 30 34 13 12 Enough 38 38 30 13 6 Extra 36 23 20 4 <1 Well-off 14 14 17 6 9 Belonging to the Long Beach Area Jewish community Not at all 18 23 31 4 1 Not much 39 21 23 3 3 Some 39 31 15 14 2 A great deal 47 37 31 38 25 Satisfaction with participation Not at all / Not too satisfied 38 25 22 10 3 Somewhat satisfied 40 33 25 13 6 Very satisfied 17 22 26 6 2
Jewish
Jewish adults in the Long Beach Area are limited in their desired communal participation by a number of conditions (Tables 6.4a and 6.4b). Four-in-five Jewish adults indicated they experience at least one barrier to increased participation. Forty-one percent of Jewish adults indicated that not knowing many people limits their participation, and this share rises to 75% of those ages 18 to 49. About one third of Jewish adults said their participation is limited because they have not found interesting activities. One third (33%) of Jewish adults feel limited in their ability to participate in the community because of COVID-19, including close to half of the Involved (47%) and Immersed (39%) groups. One fifth of Jewish adults (21%) say the community’s offerings are too expensive, including 22% of those who are not parents and half (49%) of those who are struggling financially.
2021-22 Long Beach Area Jewish Community Study 74
Table 6.4a. Conditions that limit participation in the Long Beach Area Jewish community
2021-22 Long Beach Area Jewish Community Study 75
Any limiting condition Don’t know many people Haven’t found interesting activities COVID-19 pandemic Too expensive All Jewish adults 80 41 34 33 21 Jewish engagement Personal 71 39 30 14 24 Involved 89 50 44 47 23 Immersed 81 29 25 39 11 Age 18-49 91 75 48 44 20 50-64 75 33 29 35 29 65+ 79 30 31 24 14 Region Long Beach 82 46 38 30 19 Surrounding Areas 78 35 29 37 23 Marital status Inmarried 83 27 40 28 20 Intermarried 75 52 27 22 23 Not married 83 45 37 47 19 Parent of minor child Not parent 81 41 34 35 22 Parent 76 50 40 22 7 Financial situation Struggling 87 61 30 36 49 Enough 81 36 34 31 29 Extra 83 48 35 39 15 Well-off 69 28 40 13 2 Belonging to the Long Beach Area Jewish community Not at all 63 41 27 11 18 Not much 91 49 50 44 20 Some 85 39 26 43 21 A great deal 78 26 32 26 25 Satisfaction with participation Not at all / Not too satisfied 93 56 40 36 37 Somewhat satisfied 86 44 38 42 17 Very satisfied 49 15 18 10 3
Fewer Jewish adults from Long Beach (8%), compared with those living in the Surrounding Areas (24%) indicated that their participation in the community is limited by inconvenient locations. One third of Jewish adults said their participation is limited because they are not confident in their Jewish knowledge. Thirteen percent of Jewish adults said their participation is limited because their political views are unwelcome, including one quarter of the Immersed engagement group (27%) and 24% of those who are well-off. Twelve percent of Jewish adults said that feeling unwelcome limits their participation.
2021-22 Long Beach Area Jewish Community Study 76
Table 6.4b. Conditions that limit participation in the Long Beach Area Jewish community
2021-22 Long Beach Area Jewish Community Study 77
Location not convenient Not confident in Jewish knowledge Political views are unwelcome Feel unwelcome Something else All Jewish adults 15 14 13 12 15 Jewish engagement Personal 11 19 11 7 13 Involved 20 15 7 18 18 Immersed 13 2 27 12 12 Age 18-49 16 23 7 8 20 50-64 13 11 14 11 11 65+ 16 11 16 9 15 Region Long Beach 8 18 12 13 15 Surrounding Areas 24 8 14 12 14 Marital status Inmarried 15 13 19 10 21 Intermarried 13 22 10 12 6 Not married 15 7 10 16 17 Parent of minor child Not parent 14 13 15 13 14 Parent 23 18 2 5 18 Financial situation Struggling 10 28 10 7 13 Enough 12 15 21 17 12 Extra 31 9 4 17 19 Well-off 5 12 24 8 11 Belonging to the Long Beach Area Jewish community Not at all 4 13 13 9 11 Not much 25 13 6 16 17 Some 17 12 19 13 17 A great deal 6 3 16 < 1 9 Satisfaction with participation Not at all / Not too satisfied 16 12 11 9 20 Somewhat satisfied 18 19 13 19 12 Very satisfied 6 5 17 4 11
Jewish adults in households that include members of key subgroups were asked about their impressions of Jewish organizations (Table 6.5). These households include someone who is LGBTQ, someone who has a health issue or disability, someone who is intermarried, and/or someone who identifies as person of color.
Table 6.5 illustrates how Jewish adults in households with members of these subgroups perceive Jewish organizations. In all cases, few consider Jewish organizations to be not at all or not too welcoming. However, about half of Jewish adults in these households have no opinion, suggesting they are not involved enough to have formed an impression.
Of Jewish adults in households with an LGBTQ member, over half consider Jewish organizations to be very (36%) or somewhat (23%) welcoming to LGBTQ people, and one third (36%) have no opinion.
About half of Jewish adults in households with someone who has a health issue or disability consider Jewish organizations to be very (26%) or somewhat (22%) welcoming, and 46% have no opinion.
Of Jewish adults in intermarried households, less than half consider Jewish organizations to be very (29%) or somewhat (13%) welcoming, and half (49%) have no opinion.
Of Jewish adults in households that include a person of color, over half consider Jewish organizations to be very (29%) or somewhat (25%) welcoming to people of color, and over one third (39%) have no opinion.
2021-22 Long Beach Area Jewish Community Study 78
who are
household) LGBTQ people People with disabilities or special needs Interfaith families People of color Not at all welcoming 5 4 3 0 Not too welcoming 0 2 6 7 Somewhat welcoming 23 22 13 25 Very welcoming 36 26 29 29 Don’t know 36 46 49 39 Total 100 100 100 100
Table 6.5. Consider Jewish organizations in the Long Beach Area to be welcoming to… (% respondents
part of each type of
Concerns about and experiences with antisemitism
The majority of Jewish adults in the Long Beach Area are very concerned about antisemitism in the United States (69%) and around the world (75%; Table 6.6).
The Immersed group has the largest share of the engagement groups that feels very concerned about antisemitism around the world (91%). A smaller share of those ages 18 to 49 (45%), compared with those ages 50 to 64 (80%), are very concerned about antisemitism in the United States. About three quarters of parents, compared with about half of people who are not parents, are very concerned about antisemitism in the United States and around the world.
Fifteen percent of Jewish adults personally experienced antisemitism in the past year.
2021-22 Long Beach Area Jewish Community Study 79
Table 6.6. Antisemitism
Sixty-two survey respondents provided brief comments about the antisemitism incidents they have experienced. Of these, about half (30) described perceived microaggressions, stereotypes, slights, or “jokes.”
Friends, not members of the tribe, making comments or ‘jokes’ about ‘Jews.’ These are stereotypical, imprinted in the utterers’ psyches, mostly since childhood. They either have not a clue as to how ignorant, uninformed, and unbecoming these are, or do not care.
Just comments like, ‘We don’t go to that hospital because it’s where all the Jews go ’
Coworker used verbal antisemitic slur as a response when asked to wear a mask as mandated in the workplace.
[C]omments about ‘looking Jewish’ and about ‘taking so much time off class’ as a professor by secretary staff in my department.
2021-22 Long Beach Area Jewish Community Study 80
Very concerned, in the United States Very concerned, around the world Personally experienced in past year All Jewish adults 69 75 15 Jewish engagement Personal 65 63 18 Involved 73 79 8 Immersed 71 91 20 Age 18-49 45 63 18 50-64 80 79 17 65+ 75 80 11 Region Long Beach 67 72 15 Surrounding Areas 72 81 14 Marital status Inmarried 70 78 7 Intermarried 64 66 25 Not married 73 81 12 Parent of minor child Not parent 73 79 14 Parent 44 53 20 Financial situation Struggling 72 72 29 Enough 68 83 15 Extra 78 76 12 Well-off 56 66 5
The remaining antisemitic incidents were moderate and included vandalism and aggression. Examples of moderate experiences included:
As a teacher, swastikas drawn on my classroom door.
I have a mezuzah on the door frame to the front of my home. Someone wrote ‘Dirty Jew’ on my door with a marker.
Individuals screaming derogatory remarks from a passing car.
2021-22 Long Beach Area Jewish Community Study 81
Chapter 7. Israel
Chapter highlights
Israel plays an important role in the Jewish identity of many Jewish adults in the Long Beach Area. The proportion of Jewish adults in the Long Beach Area who have traveled to Israel is similar to that in the national Jewish community, as is the share of Jewish adults in the Long Beach Area who follow the news about Israel closely. A similar proportion of Jewish adults in the Long Beach Area express a strong sense of emotional attachment to Israel as among all US Jewish adults.
• More than half of Jewish adults in the Long Beach Area are somewhat (42%) or very (18%) emotionally attached to Israel. Nationally, 32% of Jewish adults are somewhat attached, and 25% are very attached to Israel. 10
• Half of Jewish adults in the Long Beach Area have been to Israel at least once, including around one quarter who have been multiple times (19%) or previously lived there (8%). Forty-five percent of US Jews have been to Israel at least once. 11
• Relatively few Jewish adults in the Long Beach Area have traveled to Israel on organized programs, whether educational or volunteer trips (9%), trips sponsored by Jewish organizations (8%), or long-term programs (6%). Informal travel is more common, with nearly one quarter of Jewish adults having traveled to Israel on vacation, and 21% who visited family or friends there. Nearly one quarter of adults ages 18-49 have been to Israel on an educational or volunteer trip, and about half have been on a Birthright Israel trip.
• Nearly two thirds of Jewish adults follow news about Israel somewhat (39%) or very (23%) closely.
Emotional attachment to Israel
The majority of Jewish adults in the Long Beach Area are emotionally attached to Israel, with 42% feeling somewhat attached and 18% feeling very attached (Table 7.1). Taken together, the proportion who are attached to Israel (60%) is similar to that among all US Jewish adults (58%). 12 The majority of each engagement group feel some level of attachment, although about one third (30%) of the Personal group feel not at all attached, compared to 10-14% of the other engagement groups.
There is a strong correlation between Israel travel and emotional attachment. Almost one third of Jewish adults who have never been to Israel feel not at all attached.
2021-22 Long Beach Area Jewish Community Study 82
Table 7.1. Emotional attachment to Israel
2021-22 Long Beach Area Jewish Community Study 83
Not at all attached Not too attached Somewhat attached Very attached Total All Jewish adults 19 21 42 18 100 Jewish engagement Personal 30 22 44 4 100 Involved 14 26 46 14 100 Immersed 10 11 31 49 100 Age 18-49 12 21 49 18 100 50-64 24 21 35 19 100 65+ 19 21 43 17 100 Region Long Beach 16 26 41 17 100 Surrounding Areas 24 14 43 20 100 Marital status Inmarried 14 19 37 30 100 Intermarried 35 22 32 12 100 Not married 10 22 55 13 100 Parent of minor child Not parent 17 21 43 19 100 Parent 37 19 27 16 100 Financial situation Struggling 18 28 33 21 100 Enough 19 17 43 21 100 Extra 24 15 48 13 100 Well-off 19 23 34 24 100 Travel to Israel Never 31 26 37 6 100 Once 10 28 45 16 100 More than once 3 6 57 34 100 I lived in Israel 1 4 28 68 100
About half of Long Beach Area Jews have been to Israel, but frequency of travel varies by Jewish engagement and age (Table 7.2). Two thirds of the Personal engagement group (63%) have never travelled to Israel, compared with one third (31%) of the Immersed. More than one third (38%) of Jewish adults ages 18 to 49 have visited Israel more than once, compared with 8% of those ages 50 to 64.
Table 7.2. Travel to Israel
2021-22 Long Beach Area Jewish Community Study 84
Never Once More than once Lived in Israel Total All Jewish adults 49 24 19 8 100 Jewish engagement Personal 63 26 7 4 100 Involved 47 23 23 7 100 Immersed 31 21 32 16 100 Age 18-49 20 26 38 16 100 50-64 67 18 8 7 100 65+ 51 27 18 4 100 Region Long Beach 41 27 22 10 100 Surrounding Areas 61 19 15 5 100 Marital status Inmarried 42 29 24 5 100 Intermarried 62 19 7 12 100 Not married 45 23 25 7 100 Parent of minor child Not parent 49 25 19 7 100 Parent 52 16 18 13 100 Financial situation Struggling 61 17 7 15 100 Enough 52 30 9 8 100 Extra 46 17 33 4 100 Well-off 40 32 20 8 100
Long Beach Area Jews travel to Israel both with organized groups and on their own (Table 7.3). Trips related to Birthright Israel (46% of age-eligible adults), vacation (24%) and visiting family or friends (21%) are the main types of Israel travel.
Table 7.3. Types of travel to Israel
* Trip sponsored by federation, synagogue, or other Jewish organization.
2021-22 Long Beach Area Jewish Community Study 85
Birthright Israel (age-eligible) Vacation Visits to family or friends Educational or volunteer trip Sponsored trip* Long-term program Business trip All Jewish adults 46 24 21 9 8 6 1 Jewish engagement Personal 18 13 <1 <1 4 0 Involved 26 15 14 10 4 1 Immersed 11 29 47 14 18 11 2 Age 18-49 48 26 28 23 13 11 2 50-64 16 15 5 6 3 <1 65+ 29 22 5 7 5 1 Region Long Beach 57 23 24 12 11 8 1 Surrounding Areas 26 18 5 4 2 1 Marital status Inmarried 14 32 34 6 10 6 3 Intermarried 19 18 7 3 6 <1 Not married -- 21 13 14 10 5 1 Parent of minor child Not parent 24 21 10 8 5 1 Parent 16 26 27 4 12 10 1 Financial situation Struggling -- 21 17 2 2 5 0 Enough 17 26 6 4 5 2 Extra 25 15 17 14 3 1 Well-off 34 32 4 7 5 1
News about Israel
Two thirds (62%) of Jewish adults in the Long Beach Area follow news about Israel closely, with more than one third (39%) following news somewhat closely, and about a quarter (23%) following news very closely (Table 7.4). Forty-two percent of Jewish adults in the Immersed engagement group follow news about Israel very closely. Frequency of Israel trips is associated with following news about Israel. Those who lived in Israel (72%) and visited more than once (41%) follow news about Israel very closely.
2021-22 Long Beach Area Jewish Community Study 86
Table 7.4. Follow news about Israel
2021-22 Long Beach Area Jewish Community Study 87
Not at all closely Not too closely Somewhat closely Very closely Total All Jewish adults 9 30 39 23 100 Jewish engagement Personal 14 34 45 7 100 Involved 9 32 33 26 100 Immersed <1 19 39 42 100 Age 18-49 1 26 44 30 100 50-64 8 36 34 22 100 65+ 7 29 43 21 100 Region Long Beach 6 26 43 26 100 Surrounding Areas 14 35 33 18 100 Marital status Inmarried 10 27 39 24 100 Intermarried 12 31 38 19 100 Not married 5 30 40 25 100 Parent of minor child Not parent 6 30 39 25 100 Parent 30 20 42 8 100 Financial situation Struggling 9 21 43 27 100 Enough 3 31 42 24 100 Extra 19 22 41 18 100 Well-off 4 39 27 29 100 Travel to Israel Never 17 35 36 12 100 Once 1 30 55 14 100 More than once 1 21 37 41 100 I lived in Israel <1 14 14 72 100 Attachment to Israel Not at all attached 43 29 21 7 100 Not too attached 4 54 39 4 100 Somewhat attached 0 30 52 18 100 Very attached 0 3 26 72 100
About one third of Jewish adults consider caring about Israel as essential to being Jewish, and nearly half (46%) consider it important (Figure 7.1). Twenty percent consider Israel to be not at all important to being Jewish.
2021-22 Long Beach Area Jewish Community Study 88
20% 18% 27% 11% 46% 51% 44% 39% 34% 31% 29% 49% All Jewish adults Personal Involved Immersed Not important Important Essential
Figure 7.1. Caring about Israel is essential to being Jewish (% Jewish adults)
Chapter 8. Health Needs and Financial Well-Being
Chapter highlights
Jewish organizations in the Long Beach Area devote a significant share of their resources toward caring for families and individuals in need. The community’s economic stability has provided sufficient means to provide for the needs of many. Nevertheless, it is clear that there are some unmet needs in the Jewish community.
Like the overall Jewish community in the United States, the Long Beach Area Jewish community is highly educated and economically comfortable. Most Jewish households describe themselves as having enough money to meet their needs, including about half of households that say they “have a little extra” or are “well-off.” Yet there are a significant number of households with unmet financial and health needs, including some whose needs preclude their participation in Jewish life.
Health and social service needs
• Nearly one quarter of Jewish households include a member whose work, school, or activities are limited by a chronic health issue, special need, or disability. In fewer than 1% of Jewish households, the person with the health issue is a child.
• Among the Jewish households that include someone who has a health issue, 29% did not receive all services needed to manage the health issue within the previous three months.
• Thirty percent of Jewish adults believe it is somewhat (25%) or very (5%) important that the social services they receive be provided by a Jewish organization.
• Thirteen percent of Jewish households with a member ages 65 or older have at least one member who needs assistance with the activities of daily living.
• About 10% of financially struggling adults reported emotional or mental health difficulties.
• Among adults in households in which someone has a health issue, 20% reported loneliness in the prior week, and 8% reported emotional or mental health difficulties in the prior week.
Education and employment
• The Jewish community of the Long Beach Area is highly educated; over two thirds of adults have a bachelor’s degree, including 45% who have a graduate degree.
• About half of Jewish adults were working at the time of the study and another 38% were retired.
Finances
• One quarter of households describe their financial situations as well-off, 18% say they cannot make ends meet or are just managing to make ends meet (referred to in this report as “struggling”). A larger share of adults ages 65 and older are well-off, compared to those younger than age 65.
2021-22 Long Beach Area Jewish Community Study 89
• While 18% of all Jewish households say their financial situations have worsened since early 2020 (before the COVID-19 pandemic), fully 50% of struggling households say their situations have worsened.
• Six percent of households could not pay off in full an unexpected $400 expense.
• Eleven percent of households earn under 250% of the federal poverty level. Twelve percent of households receive some form of a public benefit.
• Eight percent of households experienced an economic hardship within the previous year, and an additional 2% experienced an economic hardship between one to three years ago.
• Eighteen percent of Jewish households limited their participation in Jewish life because of their financial situation.
Financial situation and income
To assess financial well-being, each survey respondent was asked to provide a subjective assessment of their household’s financial situation. One percent of Jewish households in the Long Beach Area said they cannot make ends meet, and another 17% stated they are just managing to make ends meet (Table 8.1). For purposes of this report, these two groups are combined into a single category referred to as “struggling” and constitute 18% of Jewish households. About one quarter of Jewish households (27%) stated they have enough money, one third (30%) said they have extra money, and one quarter (25%) described themselves as well-off.
8.1. Financial situation
The financial situation of Jewish households does not vary significantly by Jewish engagement, geography, marital status, or whether there is a minor child in the household (Table 8.2). The older age group, including households ages 65 and older, includes the largest share of well-off households (38%).
In addition to the 18% of households that were struggling at the time of the study, another 10% reported that they experienced financial struggles during the three years prior to the study (not shown in table).
2021-22 Long Beach Area Jewish Community Study 90
Table
Report category Response option Jewish households (%) Struggling Cannot make ends meet 1 Just managing to make ends meet 17 Enough Have enough money 27 Extra Have extra money 30 Well-off Well-off 25 Total 100
Members of Jewish households were asked to consider how their financial situation might have changed since the COVID-19 pandemic began (Table 8.3). Half of the households that are financially struggling reported their situation had worsened in that time period.
Fourteen percent of Jewish households in the Long Beach Area have incomes of less than $50,000, and 15% of Jewish households make $200,000 or more (Table 8.4). Another 23% of households,
2021-22 Long Beach Area Jewish Community Study 91
Struggling Enough Extra Well-off Total All Jewish households 18 27 30 25 100 Jewish engagement Personal 21 24 27 28 100 Involved 16 26 36 22 100 Immersed 12 41 25 22 100 Age 18-49 24 26 37 13 100 50-64 26 22 37 14 100 65+ 9 32 21 38 100 Region Long Beach 20 26 28 26 100 Surrounding Areas 13 31 34 22 100 Marital status Inmarried 12 26 38 25 100 Intermarried 14 28 29 29 100 Not married 24 28 27 21 100 Minor child in household No child in household 15 29 29 27 100 Child in household 30 20 36 13 100
Table 8.2. Financial situation by subgroup
Worse than before (%) About the same (%) Better than before (%) Total All Jewish households 18 53 29 100 Financial situation Struggling 50 40 10 100 Enough 23 61 16 100 Extra 6 59 35 100 Well-off 5 48 47 100
Table 8.3. Change in financial situation since 2020
however, declined to provide income information. Because household income does not account for assets, income is not fully correlated with self-described financial situation.
2021-22 Long Beach Area Jewish Community Study 92
Less than $50,000 $50,000$74,999 $75,000$99,999 $100,000$149,999 $150,000$199,999 $200,000 or more Don't know/ Prefer not to answer Total All Jewish households 14 9 8 17 15 15 23 100 Jewish engagement Personal 17 6 7 15 21 15 19 100 Involved 14 12 10 17 11 12 25 100 Immersed 7 8 7 19 8 21 30 100 Age 18-49 13 15 8 21 19 14 8 100 50-64 11 4 6 21 16 17 25 100 65+ 17 10 9 12 12 13 26 100 Region Long Beach 16 11 8 20 14 15 18 100 Surrounding Areas 11 6 8 11 17 15 32 100 Marital status Inmarried 2 6 10 17 19 20 26 100 Intermarried 5 4 3 22 16 27 23 100 Not married 28 15 12 12 12 1 21 100 Minor child in household No child in household 15 10 8 17 15 13 23 100 Child in household 11 1 9 15 13 27 21 100 Financial situation Struggling 42 10 5 14 10 <1 19 100 Enough 21 9 4 24 12 6 23 100 Extra 3 9 11 16 19 18 24 100 Well-off 1 8 10 13 16 32 21 100
Table 8.4. Household income
The US Department of Health and Human Services (HHS) determines the federal poverty level (FPL) annually, using a formula based on household income and household size. Using that formula, 4% of Jewish households in the Long Beach Area are below 100% FPL (Table 8.5). In all, 11% of Jewish households are below 250% FPL.
Many Jewish adults in the Long Beach Area expressed concerns about their future financial needs (Table 8.6). Among Jewish adults ages 40 and younger, 9% are not at all or not too (5%) confident in their ability to afford retirement. Twelve percent of all Jewish adults are not at all (3%) or not too (9%) confident that they will be able to keep their current savings and investments.
Six percent of all Jewish adults are not at all (2%) or not too (4%) confident that they will be able to afford healthcare. The same proportion of all Jewish adults (6%) are not at all (1%) or not too (5%) confident that they will be able to afford basic living expenses.
2021-22 Long Beach Area Jewish Community Study 93
All Jewish households < 250% FPL 11 < 100% FPL 4 100-149% FPL 3 150-249% FPL 4
Table 8.5. Federal poverty level
Not at all confident Not too confident Somewhat confident Very confident Does not apply Afford retirement (age >40) 9 5 38 45 3 Keep current savings/investments 3 9 38 46 4 Afford healthcare 2 4 25 66 3 Afford basic living expenses 1 5 14 77 3
Table 8.6 Confidence in financial future
2021-22 Long Beach Area Jewish Community Study 94
Afford retirement (age >40) Keep current savings/investments Afford healthcare Afford basic living expenses All Jewish adults 13 12 6 5* Jewish engagement Personal 13 13 3 3 Involved 10 8 8 1 Immersed 18 18 6 9 Age 18-49 n/a 7 8 12 50-64 n/a 20 10 5 65+ n/a 8 1 2 Region Long Beach 18 14 7 5 Surrounding Areas 8 9 4 6 Marital status Inmarried 9 7 2 2 Intermarried 14 12 4 7 Not married 17 16 11 7 Parent of minor child Not parent 13 12 6 6 Parent 14 12 3 0 Financial situation Struggling 53 43 22 26 Enough 10 11 5 0 Extra 2 2 1 1 Well-off 1 2 0 0
Table 8.7. Confident in financial future by subgroup (% not at all/not too confident)
Note: Discrepancy between Table 8.6 and 8.7 is due to rounding.
Twelve percent of Jewish households receive at least one of three types of public benefits (Table 8.8). Seven percent receive Medi-Cal or Children’s Health insurance, 5% receive income assistance, and 5% receive food assistance.
Table 8.8. Receipt of public benefits
Two benchmarks commonly used to assess financial vulnerability are receiving a public benefit and the ability to cover emergency expenses (Table 8.9). Twelve percent of all Jewish households receive a public benefit listed in Table 8.8, and 6% said they would be unable to pay in full an unexpected $400 emergency expense with cash, money currently in a bank account, or a credit card.
Larger shares of Jewish households with members younger than age 65 (18-20%) indicated that they are receiving one of the listed public benefits, compared with those ages 65 and older (5%). Greater shares of financially struggling households receive public benefits and are unable to afford $400 expenses, compared to the rest of the community.
2021-22 Long Beach Area Jewish Community Study 95
All Jewish households Any public benefit 12 Medi-Cal or Children’s Health Insurance Program 7 Income assistance 5 Food assistance 5
Table 8.9. Economic insecurity
2021-22 Long Beach Area Jewish Community Study 96
Receiving a public benefit Cannot afford $400 emergency expense All Jewish households 12 6 Jewish engagement Personal 15 8 Involved 10 5 Immersed 10 2 Age 18-49 20 8 50-64 18 9 65+ 5 3 Region Long Beach 13 6 Surrounding Areas 10 5 Marital status Inmarried 5 2 Intermarried 11 5 Not married 16 8 Minor child in household No child in household 11 6 Child in household 18 6 Financial situation Struggling 46 28 Enough 14 2 Extra 2 0 Well-off 0 3
The most common financial hardships faced by Jewish households in the Long Beach Area over the past year are the inability to pay for rent or for utilities (Table 8.10). Four percent of households were unable to pay for rent or utilities sometime in the past year, in addition to 2% of households that encountered this situation between one to three years ago. Three percent of households could not afford to pay for all the food they needed or the healthcare they needed in the past year.
2021-22 Long Beach Area Jewish Community Study 97
past year Between 1-3 years ago Any hardship 8 2 Rent 4 2 Utilities 4 2 Food 3 2 Healthcare 3 2
Table 8.10. Financial difficulties (% Jewish households who did not have enough money for…) Within
In total, 10% of Jewish households encountered at least one of these hardship over the past three years including 8% in the past year, and an additional 2% between one and three years ago (Table 8.11).
Larger shares of households ages 18 to 49 (15%) and ages 50 to 64 (10%) reported encountering hardships in the past year, compared with those ages 65 and older (3%). A higher share of single households (15%) faced hardships compared to coupled households (1-3%). In addition, more households that are struggling (42%) reported encountering hardships in the recent past compared to those that are better off financially.
2021-22 Long Beach Area Jewish Community Study 98
Table 8.11 Any financial difficulties
All Jewish households 90 8 2 Jewish engagement Personal 93 7 0 Involved 85 11 4 Immersed 92 5 3 Age 18-49 79 15 5 50-64 87 10 3 65+ 96 3 1 Region Long Beach 89 10 1 Surrounding Areas 91 5 4 Marital status Inmarried 93 1 5 Intermarried 96 3 1 Not married 83 15 2 Minor child in household No child in household 91 7 2 Child in household 83 15 1 Financial situation Struggling 50 42 9 Enough 95 3 2 Extra 100 0 <1 Well-off 100 0 0
No household hardship Hardship within past year Between 1-3 years ago
Educational attainment and employment
The Jewish population of the Long Beach Area is highly educated. Of Jewish adults not enrolled in high school, 23% have earned a bachelor’s degree, and another 45% have earned a graduate degree (Figure 8 1). Among Jews in the United States, 58% have a bachelor’s degree or higher
About half (49%) of Jewish adults in the Long Beach Area who are not in high school are working in at least one job, either full time (37%), part time (8%), or in multiple positions (4%; Table 8.12). More than one third of Jewish adults in the Long Beach Area (38%) are retired. Despite 9% of Jewish adults not working for pay, 2% were receiving unemployment benefits suggesting that the majority of this group may be unemployed by choice, perhaps as stay-at-home parents, or as fulltime students.
All Jewish adults
2021-22 Long Beach Area Jewish Community Study 99
Figure 8.1. Educational attainment
Table 8.12. Employment status
Yes, full-time in one job 37 Yes, part-time in one job 8 Yes, working in multiple positions 4 No, not working for pay 9 No, on temporary leave 4 No, retired 38 Total 100 High school diploma or less, 17% Associate or technical degree, 14% Bachelor’s degree, 23% Graduate or professional degree, 45%
Health and disability
Poor health, special needs, and disabilities can indicate the need for assistance from human service agencies. One quarter (24%) of Jewish households in the Long Beach Area include at least one person who is limited in their work, school, or activities by some sort of health issue, special need, or disability (Table 8.13). Three percent of Jewish households with children have a child with a limiting health issue (not shown in table)
2021-22 Long Beach Area Jewish Community Study 100
Household member limited by chronic health issue, special need, disability All Jewish households 24 Jewish engagement Personal 20 Involved 30 Immersed 19 Age 18-49 17 50-64 28 65+ 24 Region Long Beach 20 Surrounding Areas 30 Marital status Inmarried 28 Intermarried 24 Not married 21 Child in household No child in household 24 Child in household 22 Financial situation Struggling 34 Enough 28 Extra 16 Well-off 19
Table 8.13 Households with a chronic health issue, special need, or disability that limits work, school, or activities
The most commonly faced health situations are chronic illness and physical disability, each experienced by 12% of all Jewish households (Table 8.14). The third most common health issue is mental or emotional health problems (8%). About one third of households with health issues had needs which were unmet within the previous three months (not shown in table.)
Note: Differences in columns of this table are due to rounding.
2021-22 Long Beach Area Jewish Community Study 101
All Jewish households Households with a health issue Any health issue 24 100 Chronic illness 12 53 Physical disability 12 51 Mental or emotional health problems 8 32 Developmental or intellectual disability 1 5 Substance abuse or addiction 1 4 Dementia 1 4 Complication related to COVID-19 0 1 Other 2 7
Table 8.14. Specific health issues
Jewish adults were asked whether it was important to them that any needed social services be provided by a Jewish organization (Table 8.15). About one third (30%) said it is somewhat (25%) or very (5%) important that social services are provided by a Jewish organization.
Table 8.15. Importance that human services be provided by a Jewish organization
Thirteen percent of Jewish households with someone ages 65 or older have at least one person who needs assistance with activities of daily living such as doing housework, preparing meals, dressing, and undressing, taking a bath or a shower, or walking up and down the stairs.
Three percent of adults ages 55 and older live in an assisted living facility, nursing home, or an independent senior living building or community.
2021-22 Long Beach Area Jewish Community Study 102
Not at all important A little important Somewhat important Very important Total All Jewish adults 45 25 25 5 100 Jewish engagement Personal 62 16 21 <1 100 Involved 39 34 24 4 100 Immersed 25 27 34 15 100 Age 18-49 58 30 10 1 100 50-64 33 30 31 6 100 65+ 48 19 28 5 100 Region Long Beach 50 24 23 3 100 Surrounding Areas 38 27 28 7 100 Marital status Inmarried 34 26 34 6 100 Intermarried 54 26 19 2 100 Not married 46 25 22 6 100 Parent of minor child Not parent 43 25 27 5 100 Parent 57 33 8 1 100 Financial situation Struggling 30 23 42 5 100 Enough 39 39 17 4 100 Extra 44 29 21 6 100 Well-off 60 9 28 3 100 Health issue in household No 43 24 28 6 100 Yes 49 30 19 2 100
Personal support networks can be protective against feelings of loneliness and poor mental health (Table 8.16). More than half (53%) of the Jewish adults in the Long Beach Area said that they have no one or just a few people in their personal support network. Ten percent of Jewish adults said they were lonely often or all the time during the past week. Three percent of Jewish adults in the Long Beach Area said that they had emotional or mental health difficulties often or all the time during the past week.
Parents of minor children have larger support networks and fewer experiences of loneliness and mental health difficulties, in comparison to those without children. Although one’s financial situation is not related to support networks and loneliness, about 10% of financially struggling adults reported emotional or mental health difficulties.
Among Jewish adults in households in which someone has a health issue, 20% reported loneliness in the prior week, and 8% reported emotional or mental health difficulties in the prior week.
2021-22 Long Beach Area Jewish Community Study 103
Table 8.16. Support networks, feelings of loneliness, and emotional or mental health difficulties
2021-22 Long Beach Area Jewish Community Study 104
Personal support network: No one or just a few people Lonely in past week: Often, all the time Emotional or mental health difficulties in past week: Often, all the time All Jewish adults 53 10 3 Jewish engagement Personal 49 13 2 Involved 60 7 3 Immersed 47 10 7 Age 18-49 52 5 2 50-64 52 11 6 65+ 55 12 2 Region Long Beach 51 7 2 Surrounding Areas 56 15 5 Marital status Inmarried 45 5 2 Intermarried 48 6 3 Not married 66 15 5 Parent of minor child Not parent 55 12 4 Parent 32 1 1 Financial situation Struggling 61 15 10 Enough 63 12 4 Extra 53 7 1 Well-off 41 3 <1 Health issue in household No health issue 49 6 1 Someone has health issue 62 20 8
Impact of finances on Jewish life
About one-in-five Jewish households in the Long Beach Area had to limit or change their involvement in Jewish life due to their financial situation during the past year (Table 8.17). The most commonly experienced limitation is being unable to contribute to Jewish causes as much as they would have liked, which was reported by 13% of Jewish households. A small number of Jewish households with children did not enroll them in Jewish schools or camps for financial reasons or required financial assistance to enroll children in Jewish education, Jewish camp, or activities. A small number of synagogue-member households discontinued their synagogue membership for financial reasons.
Table 8.17. Financial limitations to Jewish life
2021-22 Long Beach Area Jewish Community Study 105
All Jewish households At least one limitation 18 Unable to contribute to Jewish causes as much as I would have liked 13 Unable to participate in some Jewish activities 9 Did not enroll children in Jewish education, camp, or activities (children in household) 1 Required financial assistance to enroll children in Jewish education, Jewish camp, or activities (children in household) 1 Discontinued synagogue membership 1 Required financial assistance to maintain synagogue membership (synagogue member) 2 Something else 2
Being limited in household participation in Jewish life by financial circumstances does not vary significantly by Jewish engagement, age, geography, marital, or parenting status (Table 8.18). Among the struggling group, 42% said finances limited their participation, more than any other group.
Table 8.18. Any financial limitation to Jewish life
2021-22 Long Beach Area Jewish Community Study 106
Financial situation limited participation in Jewish life All Jewish adults 18 Jewish engagement Personal 11 Involved 21 Immersed 27 Age 18-49 13 50-64 26 65+ 15 Region Long Beach 15 Surrounding Areas 23 Marital status Inmarried 21 Intermarried 12 Not married 21 Parent of minor child Not parent 19 Parent 11 Financial situation Struggling 42 Enough 24 Extra 7 Well-off 2
Chapter 9. in the words of community members
To provide an additional layer of insight into the beliefs and attitudes of members of the Long Beach Jewish community, the survey closed with the following open-ended question:
• Based on your own experience, what do you consider to be the strengths and gaps of the Long Beach Jewish community?
Responses to this question reinforce the themes presented throughout the report and provide further evidence of the opportunities available to the community, as well as areas for future growth. This chapter summarizes 398 responses to this question about strengths and gaps. Many respondents touched on multiple themes and may be included in more than one category. Some quotations have been edited for clarity or to preserve respondents’ anonymity.
The numbers in this chapter reflect the number of respondents who mentioned each of the addressed themes. Unlike the previous chapters, responses in this chapter are not weighted to be representative of the full Jewish community.
Community characteristics
Fifty-seven respondents offered general observations about the Long Beach community, of which 42 were positive.
The Long Beach Jewish Community is a wonderful community, filled with people who care deeply about the Jewish people.
Strong sense of community…Very caring and supportive.
Another 22 respondents expressed overarching concerns about the community.
It has changed a lot over the last five to ten years, and not in a way that we particularly like. It feels more like a business now, where before it felt more ‘hamish’ and more comfortable.
Not much sense of community...the Jewish community is not organized outside of the JCC.
Diversity and inclusion
Diversity and inclusion are important values to members of the Long Beach Jewish community (57). Of those mentioning diversity and inclusion, 38 praised community institutions for their efforts in fostering these values.
Strengths: Pretty welcoming to interfaith and LGBTQ. Fairly welcoming to Black/Brown people. Interfaith opinion is based on personal experience.
[The] community is welcoming to our bi-racial family.
2021-22 Long Beach Area Jewish Community Study 107
There were some, however, who felt that there was room for improvement in the Long Beach community when it came to diversity and inclusion, with 27 respondents providing feedback about how the community could make people of different backgrounds feel more welcome.
It needs the courage to understand that it greatly benefits from white privilege and that though many believe we are not racist or classist, we are and need to admit it and work to change.
Our lack of diversity on both the boards and in programming is a real gap.
I live in a mixed religion home and find some lack of proactive inclusiveness to multi-religious families.
Cohesiveness and unity
Twenty-four respondents provided feedback about the cohesiveness and unity of the Long Beach community, or the lack of unity. Nine noted that coordination of Jewish institutions contributed to their perception of the community as organized and unifying.
There is a central hub in Jewish Long Beach / JCC that connects all of the different organizations, people from different organizations/shuls can interact.
The connections between the local Jewish organizations are very good for us all.
More respondents (20) commented on the absence of cohesiveness or coordination, which created the impression of disunity and disorganization in the Long Beach Jewish community.
Each community is very siloed; hard to know what other synagogues or organizations are doing.
Not well organized, or centralized. Kind of all over the place.
Community could be strengthened by all coming together for major holiday celebrations such as… Hanukkah.
Issues of geography
The challenges and limitations of geography were raised by six respondents who mentioned distant community programs and institutions.
JCC Alpert was a great community school but too far to keep attending.
The synagogues I do attend are too far to attend every week for services.
What activities are there that would make me drive 20 miles or more to attend?
Communication
There were 30 respondents who commented on the effectiveness of communication within in the Long Beach Jewish community, eight of which were positive.
It is wonderful receiving information regarding Jewish life and concerns in Long Beach.
Feels like a lot of modern outreach via social media and email.
Another 22 respondents, however, described the need for clearer communication.
2021-22 Long Beach Area Jewish Community Study 108
There is no reaching out or following up for new people or if one seems to disappear. I get no info or news.
We need to look at new ways to do things to reach out to more people…As a federation, foundation, and community center, I’m not sure we really know who we are and what the purpose of these institutions are…The community as a whole needs to know more about us and what we do. There has been more outreach through social media, but more is necessary. There are a lot of Jews in the community, and we need to touch them and bring them into the tent.
Political Polarization
Eighteen respondents discussed polarization in the community, mostly related to responses to the pandemic, the US political situation, or the political situation in Israel. Some respondents were concerned about specific points of view that were expressed, while others were concerned about the lack of dialogue across differences.
I don’t understand why the Jewish communities in this country, and that includes my own family, are liberals and support the Democrat Party. The DNC is one of the most antisemitic political entities in the country. They are only concerned about getting more and keeping their power and control over the people. Look at what the Democrats are doing to our country right now with the illegitimate presidential administration of Joe Biden. They are tearing up the country and firing any essential worker who doesn’t agree with the government mandate to get the shot, against their constitutional rights. The American Jew has lost their way. They should be conservatives, not liberals.
Some comments focused specifically on Israel.
I am troubled by the implicit and sometimes explicit assumption that as Jews we must support the policies or government of the State of Israel. My view is the opposite. Everything I see tells me that it is our responsibility, based on our Jewish values, to stand with the Palestinian people (and by this, I do not mean their leaders, who are as appalling as Israel’s) against Israeli injustice.
I am sick of hearing Jews saying negative things about Palestinians, Arabs. Both sides are right and both sides are wrong.
Please… STOP assuming we (as Jews) all agree with your position on Israel.
Affordability
Finances and engagement in Jewish life
Issues of affordability were raised by 14 respondents. Three comments described ways in which synagogues and temples reduce financial barriers to participation.
Through the [congregation], there are many amazing opportunities…many [programs] are free or low cost.
Our [congregation]…accommodates all regardless of ability to meet financial dues.
2021-22 Long Beach Area Jewish Community Study 109
A larger number of comments (11) expressed concern over costs associated with Jewish education and community participation. Some noted that participation was completely unaffordable; others could afford to pay at a discounted rate, but the application process dissuaded them.
Costs of childcare [and] Jewish education prohibits some from participating, but we need to find more funds to offer all families a way to be part of the Jewish community.
We would love to send our children to overnight Jewish camp during the summer, but it is so expensive that [we] cannot do it.
Most activities are too expensive for my family. I would love to join the J, but it is too much for me to justify on my salary...It would be amazing to offer…a deep discount.
I cannot afford to join the Alpert Center, and do not want to go before someone to see what payment plan I can make based on my income. Because of that, I have not joined. Joining would provide some good outlets for meeting people and feeling involved.
Jewish life
Other comments about Jewish life (23) did not center on specific organizations.
Social justice
Ten respondents called for more attention to social justice.
I believe Jewish Long Beach needs to be more involved in advocating for the less fortunate in our community. Taking stands on reproductive justice, racial justice, issues associated with diversity, equity, and inclusion. Jewish Long Beach needs to be a prominent leader and become more committed to these areas.
There is no congregation which is actively engaged in social justice and volunteering.
Food
Another issue raised by some respondents (6) was the lack of Jewish food establishments in the Long Beach Jewish community. It is worth noting that none of these respondents were Orthodox, and only one observes kosher laws all of the time.
Limited access to Jewish or kosher shopping, not for people who keep kosher per se, but just for people who ‘do Jewish,’ like access to yahrzeit candles, challah, borsht, greeting cards, gifts.
The gaps are lack of kosher restaurants and kosher meat/chicken.
I had a hard time finding a shop to buy Shabbat candles and kosher restaurants (for my visiting sister-in-law).
Barriers to participation in Jewish life
Some respondents described themselves as unengaged (9) and described their reasons for lack of connection.
I am an extreme introvert and am quite comfortable not participating in community activities.
I have little to do with this community…which I feel very negatively towards.
2021-22 Long Beach Area Jewish Community Study 110
I think it’s hard to join a community late in life; therefore, my (our) non-participation is not necessarily due to gaps or weakness of the GLBJC, but rather to not having been brought up as part of such a community.
I do not know anything about the greater Long Beach Jewish community. I have not sought out any info and have not been provided any info.
Jewish organizations
The JCC and Federation
When commenting on the strengths and gaps in the Long Beach Jewish community, a significant number of respondents mentioned the JCC (44) and Federation (12). Among the positive responses related to both of these institutions (36), respondents mentioned the recent merger of the JCC and Jewish Long Beach (4) and the facilities and programs (34).
The leadership of the community is robust. The transition from separate JCC and JLB organizations to a single organization has been handed well, and the CEOs of the organizations worked well with the board and the community to ease the process.
The Alpert Jewish Community Center…makes me feel a part of a wonderful Jewish community.
Jewish Long Beach is a strong and well-respected Jewish community organization. There were others, however, who mentioned how these organizations could improve (24), with some commenting on the facilities and the roles of professional and lay leadership.
Alpert JCC building is in need of remodeling so it can be on par with many other JCCs nationwide in offering state of the art programs, equipment, etc.
I believe that the programs at the AJCC resisted change and programming was becoming stale before Covid. We need to look at new ways to do things to reach out to more people and not necessarily by spending more money on the campus.
I see the new leadership not allocating some of their workload that should be handled by volunteers.
The lack of learned understanding of the consequences associated with the budget, planning, and allocation process seem to be dismal.
Synagogues and religious leadership
Forty respondents discussed congregations, including synagogues and temples. About half (26) had positive views of the institutions and included praise for the diversity and accessibility of events and religious leadership. Respondents also noted the broader impact of synagogues and temples on congregants’ lives.
It has been very easy to attend [congregation] services by Zoom, and they have things that aren’t purely religious like a meditation class led by a woman online. That was fun.
When we participate at [congregation] or at the JCC, we have been grateful for the diversity in the population of people who also participate.
2021-22 Long Beach Area Jewish Community Study 111
The strengths are Rabbi […] and his family. His weekly emails and the warm welcome his whole family offer when we go to shul.
I think that my synagogue is doing a good job at enhancing the lives of its congregants.
The negative comments relating to synagogues and religious leadership were more wide-ranging (23), including varied opinions about the need for collaboration between the temples and more welcoming attitudes to members including mixed-religion families, and feelings related to efforts around diversity.
I would like to see more social and educational gatherings of multiple temples coming together.
I attended a service at [congregation] in Long Beach. I stood around after the service, but no one talked to me, and their parking situation was bad. I didn’t go back.
Early in my marriage, my wife attended a service at a local synagogue with me. She is not Jewish. A guest speaker spoke on how horrible it was for Jews to marry non-Jews. My wife fled in tears, and my hopes of being able to maintain a membership in a synagogue were dashed.
I often feel that the [congregation] and JCC attract and retain more diverse families and nonJewish people than more traditional families/people, thus causing more traditional families/people to not feel comfortable.”
Leadership, volunteering, and philanthropy
A number of respondents commented on the lay and professional leadership of the Long Beach Jewish community (18), 14 of whom offered positive feedback on the quality of leaders and their enthusiasm for their roles.
Excellent lay and professional leadership.
A significant number of people involved in volunteer leadership which is great.
Passionate and committed leaders.
Ten people made negative comments about lay leadership, with some noting the limited number of people willing to volunteer, and others suggesting there were a greater number willing but not selected to lead.
Same volunteers over and over.
I think that the community needs to be more inclusive of the people that are interested in being more involved at leadership level.
While a handful of respondents commented on fundraising successes, the majority (14) of comments about philanthropy were more negative.
The biggest challenges are getting people to volunteer and finding new sources of donations. It seems they’re always having to go back to the same deep pockets, and younger generations are not donating like the older generations did.
The organizations ask for money constantly.
2021-22 Long Beach Area Jewish Community Study 112
Program and activities
Among the strengths and gaps identified by members of the Long Beach Jewish community, 95 respondents commented on program offerings. There were 25 comments about programs in general, of which most (16) were positive and applauded community organizations for meeting their needs and enhancing Jewish life.
I am satisfied with the extent and number of Jewish activities available to me. [The community] provides interesting programs and an opportunity for a vibrant Jewish life.
Other respondents (9) were more critical of program offerings.
Planning is poor for some of the events, a noticeable special treatment of some people over others at some events.
I’m generally not interested in the programs offered.
The programs are not as exciting as I would like them to be.
Types of programs offered
Twenty-seven people mentioned their interests in specific types of programs. Of this group, 10 respondents described current programs that fit their interests.
We like events that are about the environment or social justice; we like music, plays, culture.
I am part of a PJ Library group, and that’s been quite nice. It isn’t religious focused, which makes me more comfortable because I feel like I don’t know a lot about the religion, and I like the cultural and community aspect of Judaism.
Through the [congregation] there are many amazing opportunities for…adults as well in areas of Jewish education/lectures, culture/films, and many social events.
Other respondents (15), however, noted that there were insufficient programs about Jewish learning (8), Jewish culture (4), and social events (3).
Not much ‘non-establishment’ Jewish energy, analogous to IKAR, Reboot, Pico-Union.
We need more explanation of Jewish customs and rituals to foster a greater understanding of why we perform certain practices. People are more inclined to participate when they have more meaning in their actions.
Would be great if there were more adult activities (sports teams, social events, etc.) that build connection between Jewish people in a more casual way.
Programs targeted to specific groups
Among the 14 respondents who requested target programs for young adults, few (3) were themselves young adults. Older respondents (11) shared their hopes that relevant programming might motivate young adults to become more engaged.
As a young Jewish professional, I’ve found there is a lack of opportunities for young Jewish adults in the area, and that is something I'd like to see more of in this community.
2021-22 Long Beach Area Jewish Community Study 113
As a Jewish millennial, I find a gap in activities, social groups, etc., that appeal to both my age and religion. I would like to see more opportunities for younger Jewish women to gather.
[There are] many programs for Jewish children, parents, or older adults, but not for the 20-30s age group.
Children, teenagers, and families were collectively (15) identified as requiring specific communal facilities and programs. Five of these comments were from parents who commented on particular facilities and programs.
Love the kids swimming programs.
The strengths…[include] [congregation]’s teen programming.
Another 21 comments mentioned the absence of programs for children
[The community] forgot about the youth. No programs for teenagers to meet other teenagers.
There are not enough fun teen related events to keep kids connected to their faith after their bar/bat mitzvah.
Older adults (15) commented on programs targeted for their demographic. Six of those responses praised program offerings for older adults and seniors.
I was introduced to [the JCC’s programs], particularly a widows’ group that met once a week. That became very important to me.
Wednesday lunch/social hour for the elderly.
Other seniors (4) mentioned gaps in programming.
I wish the Jewish center would have activities that you could do for seniors...[ones that] if I don’t go, I would feel missed, or that I missed something. More things to volunteer for. Have phone calls for people who live all alone and friendship thing. Familiar check-in.
It would be helpful if the AJCC or Jewish Long Beach would help with transportation for seniors, such as a bus similar to the one they have for the children. Transportation is a big issue as more of us are living longer and not able to drive.
2021-22 Long Beach Area Jewish Community Study 114
Chapter 10. future directions
The words of community members, taken together with the findings presented in chapters 1-8, contribute to a detailed portrait of the Jewish community the Long Beach Area. This study has described community members’ demographic characteristics, participation in Jewish communal life as well as their private Jewish activities, and their attitudes about Judaism, Israel, and the local Jewish community. This chapter summarizes some emerging themes that community organizations can use as their starting point for planning for the future.
Deepen feeling of belonging to the community
Although about three quarters of Jewish adults feel some sense of belonging to the Long Beach Area Jewish community, fewer feel a strong sense of belonging (one-in-ten) Even among Jewish adults in the Immersed group, only about one quarter feel a strong sense of belonging. This lack of strong connection is shared across different age groups and regions. These findings suggest that there is room to build upon a sense of community and deepen personal connections
On the other hand, two thirds of Jewish adults are satisfied with their level of participation in the Long Beach Area Jewish community, including about one quarter (23%) who are very satisfied and close to a half (43%) who are somewhat satisfied. One third of Jewish adults, however, are not satisfied with their level of participation, including 22% who are not too satisfied and 13% who are not at all satisfied.
Among those in the Immersed engagement group, about one quarter are not satisfied with their current level of participation. In the Personal engagement group, 30% are not satisfied, and among the Involved engagement group, about 40% are not satisfied. While lack of satisfaction can be seen as a problem, it is better understood as an opportunity, and a sign that those Jewish individuals would like to be more involved if the right opportunities presented themselves.
Undoubtedly, some of the reasons for dissatisfaction stem from limitations due to the COVID-19 pandemic. At the time of the survey, one third of Jewish adults said that their participation in Jewish activities was limited due to the pandemic. It is hoped, however, that these limitations will be less of a burden by the time this report is released.
The remainder of this chapter points to other barriers to participation in Jewish life and opportunities to address them.
Foster personal connections
Personal connections are one of the main drivers of participation in Jewish activities. Three quarters of Jewish adults say that they feel more comfortable at Jewish events when they know other people there, and over half appreciate a personal invitation. Three quarters of Jewish adults under age 50 say that one of the reasons that they do not attend Jewish events is because they do not know many people at those gatherings. This is also true for more than half of Jewish adults who are not satisfied with their current level of participation in Jewish life.
2021-22 Long Beach Area Jewish Community Study 115
The need for personal connections goes beyond participation in Jewish life and extends to overall well-being. More than half of Jewish adults say that they have at most a few people who they can call on for help if needed. These numbers are similarly high across all demographic groups. Reaching out to individuals personally whether with regard to an event or participation in an informal group could deepen connections among community members.
Reduce financial barriers
One quarter of households describe their financial situations as well-off, 18% say they cannot make ends meet or are just managing to make ends meet (referred to in this report as “struggling”). A larger share of adults ages 65 and older are well-off, compared to those younger than age 65.
Satisfaction with the level of one’s participation in the Jewish community is related to finances. People who are financially struggling are least likely to be very satisfied (13%) with their level of participation in Jewish life, compared with those who are well-off (38%). While one-in-five Jewish adults say that they consider Jewish activities to be too expensive, half of financially struggling Jewish adults report that cost is a barrier to participation. Similarly, one-in-five children were not enrolled in Jewish schools because of the cost.
In all, 18% of Jewish households limited their participation in Jewish life because of their financial situation. Finding ways to reduce costs is likely to increase participation.
Expand Jewish preschool participation
Jewish preschool has less reach than other forms of Jewish education which suggests the potential for expansion. Among Jewish children in K-12, 40% were in some form of year-round Jewish education, including schooling, private tutoring, congregational classes, or a youth group, including one third who were in part-time school, day school, or yeshiva. In contrast, 12% of age-eligible Jewish children were enrolled in a Jewish-sponsored early childhood program during the 2021-22 school year. Many preschool age families are known to the community, since one quarter of households with at least one child younger than age 12 participated in Jewish-sponsored programming, such as a Tot Shabbat, synagogue-based playgroup, or family holiday group, and nearly one third receive PJ Library or PJ Our Way books.
Among children who are not in any Jewish school, two thirds of their parents indicated that they were not interested, and almost a quarter (22%) cited cost as the reason. Expanding funding for Jewish pre-school could help shape the community for years to come.
Address social service needs
Jewish organizations need support to provide for the health needs of its community members. Nearly one quarter of Jewish households include a member whose work, school, or activities are limited by a chronic health issue, special need, or disability. In fewer than 1% of Jewish households, the person with the health issue is a child. Among the Jewish households that include someone who has a health issue, 29% did not receive all services needed to manage the health issue within the
2021-22 Long Beach Area Jewish Community Study 116
previous three months. Thirty percent of Jewish adults believe it is somewhat (25%) or very (5%) important that the social services they receive be provided by a Jewish organization.
Some groups have been particularly affected by the dramatic rise in mental health needs since the beginning of the COVID-19 pandemic. While 3% of all Jewish adults reported emotional or mental health struggles in the past week, 10% of financially struggling adults reported emotional or mental health difficulties, and 8% of those with a chronic health issue reported these difficulties. Jewish communal organizations may wish to consider expanding the services for these individuals or intensifying organizational outreach efforts to connect people to existing services.
Conclusion
These recommendations emerge from data collected systematically from nearly 600 Jewish households between October 2021 and March 2022. This study is part of a long tradition of using the tools of social science to assess the size, character, interests, needs, and concerns of a local Jewish community. The study measures participation in communal and individual Jewish practices, institutional engagement, unmet needs, and many other aspects of Jewish life in the Long Beach area. We hope that this snapshot of the community will stimulate discussion about how best to enhance the lives of community members and strengthen the community as a whole.
2021-22 Long Beach Area Jewish Community Study 117
Notes
1 Leonard Saxe, Theodore Sasson, and Janet Krasner Aronson, “Pew’s Portrait of American Jewry: A Reassessment of the Assimilation Narrative,” in American Jewish Year Book 2014, ed. A. Dashefsky and I. Sheskin (New York, NY: Springer International Publishing, 2015), 78–81.
2 ACS 5-year estimates, 2020.
3 Pew Research Center, “Jewish Americans in 2020.” (Washington, DC: Pew Research Center, 2021.)
4 Pew Research Center, “Jewish Americans in 2020.”
5 Pew Research Center, “Jewish Americans in 2020.”
6 Pew Research Center, “Jewish Americans in 2020.”
7 Pew Research Center, “Jewish Americans in 2020.”
8 Pew Research Center, “Jewish Americans in 2020.”
9 See also Janet Krasner Aronson et al., “A New Approach to Understanding Contemporary Jewish Engagement,” Contemporary Jewry 39 (2018): 91–113.
10 Pew Research Center, “Jewish Americans in 2020.”
11 Pew Research Center, “Jewish Americans in 2020.”
12 Pew Research Center, “Jewish Americans in 2020.”
2021-22 Long Beach Area Jewish Community Study 118
