

Rice Extension
SunRice
Powere d by


Rice Extension Overview
Welcome to the second edition of the Rice Extension Annual Summary. This summary aims to take a snapshot in time of the season that was, capturing and analysing key crop data and showcasing what went well, what didn’t and how we can manage for it. Throughout this report, you’ll learn more about key research, development and extension activities supported by Rice Extension during Crop Year 2024 (CY24). This document is distributed to all rice growers and relevant stakeholders as a source of reference and learning.
This report utilises all available industry data, documenting yield and timing over 53,000ha. As part of this, Rice Extension collected individual data for over 23,000ha across 785 paddocks, to accurately record nitrogen use and benchmark water use.
Our Focus Sites – Grower-to-grower collaboration and learnings
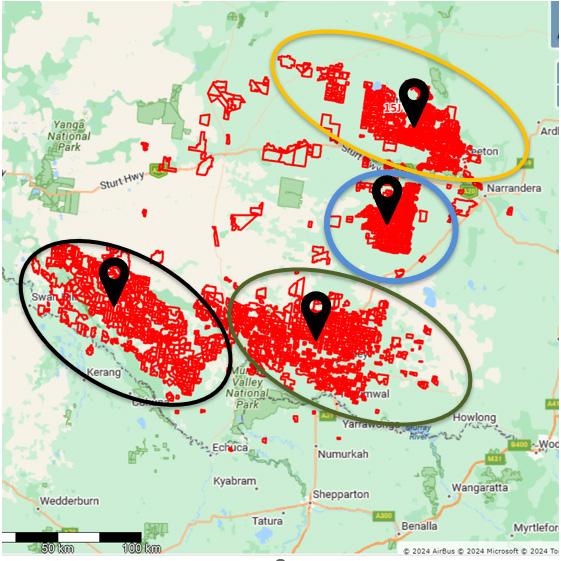
A major component of the CY24 season was the introduction of Focus Site extension activities, which saw the establishment of four on-farm commercial-scale trials. Collaborating directly with growers, we were able to facilitate the planting of sites and the creation of Reference Groups in key regions: Murrumbidgee Irrigation Area (MIA), Coleambally Irrigation Area (CIA), Western Murray Valley (WMV) and Eastern Murray Valley (EMV).
Each site had a dedicated Reference Group comprised of the site owner grower, peers and advisors. Throughout CY24, each Reference Group had discussions about management options, using all tools and data available to them so they could make informed and timely decisions.
The aim of this collaborative approach is to create, improve or discover strategies to maximise yield, profitability, water use and input use efficiency. These insights and learnings will be shared with growers and other stakeholders to support efficiencies across the industry. Initial outcomes and learnings are outlined from page 30.
The success of these sites in CY24 will see them implemented on a larger scale for Crop Year 2025 (CY25). All growers involved in the CY24 sites and Reference Groups are again involved, with an extra site in the EMV and an expansion of the Reference Group numbers to enhance discussion and outcomes. Field days hosted at key crop timings will be an opportunity to showcase these sites to other stakeholders.
Often there is no ‘right answer’ in management decisions, just ones that may prove ‘better’ than others. The value is gained through the discussion and selection of one option over another. These discussions by the Reference Groups will be documented and sent to all growers. By sharing the decision-making process with growers, it aims to communicate what tools have been used by the group and why they chose the final decision. It also ensures growers have the opportunity to consider and act on these decisions in a timely manner.
Maximising crop performance and profitability
The importance of timing was a recurring theme across most Rice Extension activities and reports in CY24. When optimal timing decisions are paired with appropriate addressing of soil constraints, even crop establishment, adequate nutrition and water management, outcomes are excellent. However, even if all factors are perfect, but key timings are off, yield and profitability will be adversely affected.
Challenges and opportunities ahead
The rice industry is facing ongoing challenges due to water policy, increasing input costs and highly variable water allocations, which are driving the need to improve water use efficiency and profitability. Figure 16, later in this report shows the average industry water use has a downward trend decline of almost two megalitres per hectare in the past ten years. However, even though we are hitting record yields of over 16T/ha in all valleys, the average yield has not increased.
Using current varieties, irrigation technology and agronomic practices, the top yielding 20% of crops are 2–3 T/ha above the average in every season, variety and region. This demonstrates a potential for dramatic yield increases.
Throughout this document, we hope you’ll find there are opportunities for us to build a robust, resilient and highly profitable rice-based farming system. Learning from each other through collaboration and knowledge sharing, while showcasing the crops and tools available to make informed and timely decisions, is the role of Rice Extension and the purpose of the Focus Sites. We welcome your feedback on how we can add value to you as growers, advisors, researchers and other industry stakeholders.
We hope the Annual Summary will provide relevant and purposeful information to accurately capture the CY24 rice season and the exciting work done by everyone to make our industry what it is today.
The Rice Extension team would like to thank everyone who shared their detailed crop data, experience and time. We also want to recognise our appreciation for our Focus Site growers and individuals who contributed to the Reference Groups.
A special thanks also goes to James Brinkoff and the Team at the Applied Agricultural Remote Sensing Centre (AARSC) at the University of New England for much of the analyses and graphs in this report. This is part of the AgriFutures project PRO-013078 — Real-time remote sensing-based monitoring for the rice industry.
Our team looks forward to working with you for a successful CY25 season.
See you in the paddock.
Regards,
The Rice Extension Team
AgriFutures fully fund the Rice Extension project with in-kind support from the SunRice Group and Rice Research Australia in collaboration with Ricegrowers’ Association of Australia. The program has a clear vision to ensure Australian rice growers are global leaders in a sustainable rice-based farming system. This will be achieved through knowledge sharing, innovative thinking and a collaborative science-based approach. The Purpose of Rice Extension is to connect rice growers with essential information for rice-based farming systems to increase the adoption of research that improves water productivity, profitability and sustainability.
Meet the Team


Mark Groat
Manager of Grower Services and Rice Extension
Living and working in the Murrumbidgee Irrigation Area (MIA), Mark has been involved in the irrigation and rice industry for over 20 years. From an agronomic background, he has worked with numerous irrigated crops and water efficiency projects throughout eastern Australia at the farm and valley level. Mark began with the SunRice Group’s Grower Services team in 2016, collaborating with growers, researchers and industry to enhance the rice-based farming system in the Riverina. In 2017, he received a Nuffield Scholarship to study farming systems and water use efficiency practices in temperate rice systems throughout different parts of the world.
Anna Jewell
Field Extension Officer
With a Bachelor of Agricultural Science and over 17 years of experience in the agricultural sector, Anna is an asset to the team. Before joining Rice Extension, she worked in the industry with multinational companies, ASX listed and private organisations. Anna began her journey in the rice industry a decade ago at RRAPL and the SunRice Group’s Gower Services team and is passionate about seeing the industry innovate to drive farm productivity.


Virginia Porcile
Field Extension/Agronomy Officer, Grower Services
Having joined our team in October 2023, Virginia is based in Leeton/Griffith. With an agronomic background and postgraduate studies in Extension & Consultancy from Massey University, New Zealand, she brings over 20 years of experience. Her career spans pastures research and various extension projects in the New Zealand dairy industry and the beef and sheep industry in Uruguay, South America. Through various extension strategies and the development of diverse networks, Virginia has dedicated her career to bridging the gap between researchers, scientists, growers and rural professionals.
Andrew Todd
Field Extension/Agronomy Officer, Rice Extension
Andrew joined the Rice Extension team in February 2024 and is based in the Leeton office. Having grown up in the area, Andrew developed a passion for all things agriculture from a young age and has pursued this throughout his career. With a background in both agronomic and plant breeding Research and Development, working for various companies across central and southern NSW, he brings 18 years of field experience to the team. Outside of work, Andrew and his wife farm rice with his family on their property at Murrami.
Jessica Anderson (Sturgess)
Communications Manager
With a background in marketing, communications and agriculture, it makes sense that Jessica does all things communications for Rice Extension. Originally from a small farm at Coleambally, her family now run a sheep and cattle property in the Southern Highlands. Jessica joined the Rice Extension team in January 2023 and brings a strong passion for the rural sector and sustainability, along with a set of communications skills, driving Rice Extension into a new digital age.

CY23 SunRice Grower of the Year
In its sixth year, the annual Grower of the Year Award is designed to showcase the best in the rice growing business, highlighting innovation in production and irrigation methods, as well as water efficiency.
The CY23 SunRice Grower of the Year Award was awarded to Robert and April Andreazza of Willbriggie, just south of Griffith. Their passion for the industry was evident in their continued advocacy for growing rice, innovative techniques and willingness to take on and share information. In CY23, their yields alone equated to 22 million meals around the world — something they’re immensely proud of.
We touched base with them to learn more about their experience.
What did winning SunRice Grower of the Year mean to you?
We are very proud and feel honoured to have been acknowledged for being loyal and passionate ricegrowers. It makes the last 30 years of being a ricegrower all the more rewarding. We have gained valuable insights into the industry as a whole and gained many friendships and connections along the way.
How has your journey developed over the past year?
We have found that with the exposure of Grower of the Year, we have made a lot more contacts, both personally and professionally, from within the industry. We have grown in confidence in terms of media exposure and public speaking. It has allowed us to improve upon certain aspects of our business by exposing us to the many facets of the Australian rice industry and by utilising its resources where possible.
What’s the biggest change you’ve implemented across your enterprise since winning Grower of the Year?
It has probably highlighted the need for us to look more deeply into the use of technology. We look forward to seeing the benefits of more thorough soil sampling and the implementation of various forms of precision agriculture within our business. While the use of some technologies doesn’t necessarily come easily for us, it certainly is the way of the future and a necessity in agriculture today.
Moving towards the future, what does sustainability look like for you?
The main focus on sustainability for us is without a doubt centred around water. Driving water use efficiency with techniques such as direct drilling and landforming to improve farm layouts are having significant impacts on lowering our water use. The goal is to produce more paddy tonnes with less overall input costs, whether that’s through minimising water, fertiliser, fuel or chemical use.
What would you say to rice growers that are wanting to make sustainable change within their operations?
We feel the best way forward is to educate yourself on improving farm practices to be more efficient. Make use of the many informative and free resources the rice industry has to offer. You must also be willing to try new things and not be scared of change. It may begin with just trialling a paddock or two to begin with until you are comfortable making that change across the board. Networking with your peers is also a great way to further your knowledge on new techniques and practices.
Any other comments?
We are very grateful for this journey, it has; without a doubt, been one of the most rewarding experiences of our life. We encourage everyone to get involved in the rice industry in whatever capacity you feel works for you, as there is so much to gain from doing so. The Australian rice industry is dynamic and progressive, and we are very proud to be playing a small part in its evolution.
CY24 Rice Crop Summary Overview
80 crops achieved over 14T/ha
Every season has its own set of challenges and opportunities, and CY24 was no different. Recent changes to water policy, accessibility of new technologies and the constant influence of weather events on farming all impacted the results of the CY24 season.
CY24 achieved individual record yields in all Valleys, with a top yield of 16.8T/ha recorded in the MIA. The Murray Valley also recorded two crops over 16T/ha, and a total of 80 crops achieved over 14T/ha. Despite these positive results, the total CY24 landed slightly below the five-year average. Establishment issues in the Western Murray Valley (WMV) resulted in a yield 12% below average, while the Eastern Murray Valley (EMV) yielded 5% below average and Coleambally produced 8% below average. In contrast, the MIA was able to perform 5% above average.
Key weather events throughout the season included:
• A relatively dry spring providing good conditions for ground preparation ahead of the CY24 planting season;
• Persistent windy conditions making crop establishment challenging, with many growers flushing 2–3 times more than normal to ensure emerging seedlings could break through the soil surface; and
• Persistent winds also making establishment conditions seem colder than normal, although minimum temperatures were only slightly below average. Maximum temperatures throughout the period were consistent with long-term averages.

Figure 1: Seasonal Riverina region minimum and maximum temperatures for CY24 compared with previous seasons
Influences on key periods
Breaking the seasonal temperatures down into three periods — sowing to panicle initiation (PI), PI to flowering and flowering to harvest — and comparing these to previous seasons can provide valuable insight into crop performance. The period from sowing to PI (Figure 2) indicates it was more consistent with long-term averages than both the CY23 and CY22 seasons, suggesting that persistent winds challenged establishment rather than low temperatures.
The average maximum and minimum temperatures in the period between PI and flowering (Figure 3) were comparable to the previous three seasons, which is below the long-term average. Although conditions during this period were cool, little cold-induced sterility was observed, as overnight temperatures remained favourable and clear and sunny days ensured good growing conditions.
Both maximum and minimum temperatures were well above average during the flowering to harvest period (Figure 4). When combined with significant harvest rainfall events, this presented a unique set of challenges for drainage decisions and the resultant harvested paddy quality for most crops sown early in the window.

Figure 2: CY24 average minimum and maximum temperatures for the period from sowing to PI

3:
average minimum and maximum temperatures for the period from PI to flowering

Figure
CY24
Figure 4: CY24 average minimum and maximum temperatures for the period from flowering to harvest
Figure 5 compares CY24 results with previous seasons, apportioning yields to high (67–100%), middle (33–67%) and lower (0–33%) segments. Mean yields of each group for the CY24 season were 13.5T/ha, 11.8T/ha and 9.3T/ha respectively. Therefore, a yield gap of 4.2T/ha existed between the high and low yield groupings. This result is consistent in all regions every year and shows the potential of current varieties, agronomic practices and management systems.

The introduction of the University of New England (UNE) Rice Management Dashboard in CY23 provided a change in the digital management tools available to manage rice crops in the Riverina. A key output, the N index curve, is produced at the paddock level for every crop, updating throughout the season as new images become available from the Sentinel-2 satellite.
The N index is the ratio of near-infrared and red edge bands derived from Sentinel-2 satellite imagery data. It has a very high correlation with mid-season nitrogen uptake. The figure below shows the differences in the N index over the course of the season between the high, middle, and lower yield groups. The highest-yielding crops in CY24 reached their peak N index earlier and had a higher N index than lower yield groups.
Additionally, the higher yield crops had early and even crop establishment (consistent with the recommended planting window), plant population evenly above 100 plants/m2, and optimal nutrition and irrigation management, consistent with crop demands and timing.

Figure 5: Riverina rice industry yield groupings over time
Figure 6: N index curves for
CY24 Rice Crop
Estimated yield penalty of 80–90kg/ha/day when PI is delayed past the optimum
From highest to lowest yield, it’s evident the timing of crop management activities remains a major constraint to increasing the overall industry average yield. This is further illustrated in Figure 7, which shows the decline in yield over time relative to various critical points in the growing season for different sowing methods.
Regardless of sowing method, there is an estimated yield penalty of 80–90kg/ha/day that PI is delayed past the optimum for any given season. This demonstrates the importance of achieving PI and flowering within the target window of early January.

The CY24 season displayed similar trends to the long-term yield results shown above, with a steeper decline in yield over time for delays in both PI and flowering dates. Yield loss per day that PI was delayed in CY24 was estimated to be 110kg/ha/day. Earlier sown (dry broadcast/aerial) and earlier permanent water (direct drill) crops had a clear yield advantage and there were some exceptionally high yields achieved regardless of sowing method.
Most high yielding crops were sown early in the recommended planting window for the variety and sowing method. Good establishment, followed by timely and optimal nutrition and irrigation management ensured PI occurred in early January and provided the foundation for high yielding crops.
The strongest phenological relationship to yield is the timing of PI and flowering dates, not planting or permanent water dates. While planting dates are important to achieve the required PI date, they can be manipulated with irrigation management, particularly in drill sown crops.
Figure 7: Riverina rice industry yield groupings over time

8: CY24 yield vs timing for sowing, permanent water, panicle initiation and flowering dates across all growing regions
The strongest phenological relationship to yield is the timing of PI and flowering dates
Figure
Planting trends
The medium grain variety V071 accounted for the majority of area planted, making up 87% of the total 54,000ha (approximately). Areas planted with specialty varieties were low due to V071’s continued success across a range of seasonal conditions.

Three-quarters of the rice grown in the MIA and all but one crop in the CIA were direct drilled, while the EMV saw a 60:40 split between direct drill and dry broadcast/aerial crops. In contrast, this trend was reversed in the WMV, with 60% of the crop dry broadcast or aerially sown. Figure 10 shows the split between the sowing techniques across the industry over time, highlighting the value of flexible sowing options for growers to ensure adaptability to seasonal conditions, as well as managing the risk of herbicide resistance.

Figure 9: Proportion of individual varieties that make up the total crop size by crop year
Figure 10: Riverina rice industry sowing method summary by crop year
Regional insights
Across the regions, average yields varied slightly, with the MIA above average while Coleambally and EMV were below. The WMV showed the most significant variation, at 12% below average, largely due to establishment issues and severe wildlife pressure. Approximately 13% of the crop area in the WMV needed to be resown, considerably higher than the expected figure of 1.5%. Table 1 shows the historic differences between the regional average and the top 20% of yields at the farm level.
Categorising these average regional yields into high, middle and lower groupings to analyse in conjunction with regional N indices highlights key differences between growing regions.
Figure 11 shows top yields (green area) are achieved with earlier PI and flowering dates as per Figure 8, assuming adequate nutrition and even plant population. The actual average yields by grouping are in Table 2, with a more detailed analysis included in Appendix 1.

Table 1: Riverina rice industry regional average and top 20% yields over time
Figure 11A: CY24 regional comparison of predicted sowing date for defined yield groupings

11B: CY24 regional comparison of predicted permanent water date for defined yield groupings

11C: CY24 regional comparison of predicted PI date for defined yield groupings
Figure
Figure
Table 2: Mean yield of groupings for each Riverina growing region
Crops in the MIA, on average, had significantly higher and earlier peak N indices, while crops in the WMV were significantly below and later than all other regions (Figure 12). The results for WMV are impacted by the aforementioned establishment challenges.
Interestingly, while crops in the CIA had a higher N index than both the EMV and WMV, they were also significantly later in their peak N index when compared to all other regions, as indicated in Figure 13. Crops in the CIA were mostly planted on time but had a later permanent water date (Figure 11), a later PI date and, consequently, a later flowering date. This demonstrates that while good nutrition is critical for high yields, it cannot make up for suboptimal timing.


Figure 12: N index curves for the Riverina rice growing regions in CY24 compared to Days After Flowering (DAFL)
Figure 13: N index curves for the Riverina rice growing regions in CY24 by date
Benchmarking – yield, nitrogen and water use efficiency
Following the success of the rice industry benchmarking program in CY23, Rice Extension again embarked on an ambitious survey of growers at the end of the CY24 harvest. In total, 43% of the crop area was addressed in the survey, focusing on capturing accurate nutrient and water inputs, as well as general farming systems information from growers. All growing regions and varieties were included in the crop survey, with V071 the dominant variety at 87% of the total surveyed area. A summary of the surveyed V071 crop area, yields and nitrogen data is presented in Table 3.

Table 3: Summary of benchmarked CY24 V071 crop area, yield and nitrogen data
Figure 14: CY24 average yield by benchmarking locality
Of the paddocks yielding over 14 T/ha, 14.7kg of N/ha was applied per tonne of grain yield
In line with previously presented modelled data, Figure 14 shows crops in the MIA had significantly higher average yields than both the CIA and Murray Valley regions in CY24. The subregions listed are those for which grower benchmark data has been analysed and presented back to individual growers.
Of the paddocks surveyed, 84 paddocks (12.4%) yielded over 14T/ha, with an average of 220kg/ha of nitrogen applied. This equated to 14.7kg of applied nitrogen per tonne of grain yield, demonstrating the positive relationship between accurate nitrogen inputs on yield and profitability.
When comparing CY24 with the past three seasons, it is evident that nitrogen efficiencies can change significantly between each growing season. Nitrogen applications are considered appropriate for crop yield potential if the yield is between 15–17kg N/t. Values below 15kg N/t yield indicate higher levels of residual soil nitrogen available to the rice crop, not that more nitrogen would achieve a higher yield.
Conversely, values above 18kg N/t yield would suggest one of two things. Firstly, an inefficient method of nitrogen application was used, resulting in poor N uptake; for example, urea spread onto wet soil surface. Alternatively, yield may have been limited by a factor other than N, such as crop phenology timing, soil or nutrient constraints, suboptimal plant stand or cold temperatures. The values in Figure 15 support the N index curves in Figures 12 and 13, suggesting crops in the CIA had sufficient nitrogen applied for a higher potential yield than was achieved due to their later flowering date.

Figure 15: Average kilograms of applied nitrogen per tonne of grain yield for medium grain varieties grown in the Riverina region over the past four years
Top
Yield
– Is it all about Nitrogen?
When yields above 14T/ha are achieved, there is often a lot of questions about how much nitrogen was used, but the correlation isn’t as significant as most people would expect. Table 4 shows the amount of total nitrogen used/ha for both the average across the region and the top 30% of all surveyed. This accounts for between 2 and 4T/ha difference in yield for no significant increase in nitrogen. This means that money is spent on nitrogen for no return.
Table 4: Total nitrogen used across regions on average and in top 30%. Numbers in brackets are urea equivalent.
Given the above results, there are other influences to yield which are more significant than nitrogen. In order, the following are the main contributors to yield;
1. Addressing paddock constraints
• Soil test
• Soil amelioration with lime or gypsum
• Nutrient deficiencies of phosphorus, zinc, and sulphur
• Drainage issues to get water on and off quickly (beds may be an option)
• Weed control
2. Planting time and irrigation management to achieve PI in the first week of January
3. Achieving even and consistent plant population
4. Then – and only then – is nitrogen the biggest influence on yield.
Those in the top 30% achieved 2 – 4T/ha better yield with no extra nitrogen (or water) because they set this foundation up first.
Top 30% achieved 2-4T/ha better yield for no extra nitrogen or water
Conclusion

Figure 16: Riverina rice industry yield and water use summary over time
Figure 16 shows the yield (T/ha), water use (ML/ha) and water use per tonne (ML/T) of the Riverina rice industry over the past 12 seasons. Looking at each line individually:
• Water Use (blue line) has shown a clear decreasing trend since 2013. Over this time, sowing methods have changed from 90% water seeded (aerial or dry broadcast) to over 60% drill sown. Irrigation layouts and design have also changed drastically with high flows and precision depth control, drainage and recycling.
• Yield (orange line) indicates that while the top end of yield has increased dramatically in recent years, yield across the industry has not increased significantly in the last ten years. Table 1 highlights this yield trend in more detail by region, also showing that while the top 20% of yield is spread consistently across all regions and varieties at 2–3T/ ha above average, it has not increased over time.
• Water Use Efficiency (grey line) shows an increasing (better) trend. Water Use Efficiency (WUE) is measured in T/ ML. Therefore, increasing WUE is a combination of decreasing water use and/or increasing yield. As water is one of the major costs of growing rice, increasing WUE is a high priority for research, extension and the future of crop production. This positive result stems from using current varieties, irrigation technologies and agronomic practices, with some individual growers exceeding WUE of 1.5T/ML.
Overall, we know that there are growers exceeding yields of 16T/ha in all Valleys and individual growers exceeding WUE of 1.5T/ML. This is using current varieties, irrigation technology and agronomic practices. Opportunities abound in enhancing a robust, resilient and highly profitable rice-based farming system. Learning from others within the industry provides huge potential to increase crop yield and decrease crop water use by adopting management practices and tools to make informed and timely decisions.
Appendix 1
The following tables summarise the regional yields by yield grouping and provide a comparison of drill and water seeded systems.
Table 5: MIA CY24 yield groupings for drill and water seeded systems
Table 6: CIA CY24 yield groupings for drill and water seeded systems
10-Jan 28-Dec 7-Jan 6-Jan
14-Feb 28-Jan 10-Feb 9-Feb
Table 7: EMV CY24 yield groupings for drill and water seeded systems
Table 8: WMV CY24 yield groupings for drill and water seeded systems

CY24 Locality Summaries
All growers received the following graphs as individual yield data reports. Each graph displays a yield analysis of all farms within the reporting locality from highest to lowest yield. Locality yield averages are compared in Figure 14.
Varieties are identified by the colours shown in the key to the right of the graph. Each column along the x-axis represents an individual crop.


Figure 17: CY24 yield comparison for Benerembah
Figure 18: CY24 yield comparison for Coleambally


Figure 19: CY24 yield comparison for Deniliquin
Figure 20: CY24 yield comparison for Gogeldrie
Figure 21: CY24 yield comparison for Jerilderie


Figure 22: CY24 yield comparison for Leeton
Figure 23: CY24 yield comparison for Logie Brae
Figure 24: CY24 yield comparison for Moulamein


Figure 25: CY24 yield comparison for Murrami
Figure 26: CY24 yield comparison for Tharbogang
Figure 27: CY24 yield comparison for Wakool


Figure 28: CY24 yield comparison for Warrawidgee
Figure 29: CY24 yield comparison for Widgelli
Figure 30: CY24 yield comparison for Wilbriggie

Figure 31: CY24 yield comparison for Yenda
Focus Sites
In 2023, four commercial-sized Focus Sites (one in each of the Riverina irrigation areas) were established in a collaborative effort between Rice Extension and rice growers.
The Focus Sites are used to demonstrate, monitor and evaluate the impact of combined applied research, technologies and tools in commercial farming systems. These tools help to identify and address constraints and monitor crops in real time. This enables timely and informed decisions to maximise crop yield and nutrient and water use efficiency.
Through regular monitoring, data collection, research insights and personal experiences, local farmers and advisors come together to discuss options when making key decisions about crop management. This peer learning process promotes knowledge sharing within the rice community.
Focus Sites are established on commercial-scale farms (Figure 32), where specific rice paddocks (or bays in some cases) are selected as the focus points for the season (Photo 1). Each paddock/bay is managed according to a combination of research-based technologies, best practices and cutting-edge digital tools.
Figure 32. Rice Extension established Focus Sites in the Murrumbidgee, Coleambally, Eastern Murray and Western Murray Irrigation Areas in 2023


The entire process is closely monitored by a group of local rice growers and advisors who form the ‘Reference Group’. Members of the group participate in decision-making processes and actively contribute and learn from each other. This collaborative environment includes extension officers and local service providers (Figure 33). The Reference Group meets regularly to discuss and make decisions about future crop management at key stages, including preparation and planting, establishment and pre-permanent water, panicle initiation and drainage. This collaborative approach fosters learning, problem-solving and mutual support, with the Focus Site providing the basis for collaboration (Photo 2).
The Focus Site methodology communicates the key discussions and reasons for final crop management decisions to the wider grower community. This is done through on-site field days and timely digital communications, highlighting the importance of making critical management decisions at the right time. Additionally, ‘focus’ field days on topics such as soil constraints, automation, nutrition, weeds and breeding trials are made available for groups of growers and advisors throughout the season.


Photo 1. CY24 MIA Focus Site aerial view showing both paddocks selected CREDIT: Mark Groat.
Figure 33. The Focus Site approach engages different groups or sectors within the rice farming community to share knowledge and learn from each other
Photo 2. The Reference Group for the MIA Focus Site meet to discuss nitrogen and water management before panicle initiation (PI) in January 2024. CREDIT: Virginia Porcile
Objective
To demonstrate and evaluate the integration of applied research, advanced technologies and best management practices in commercial rice farming systems across the Riverina region. By establishing large-scale demonstration sites, the project aims to address key agronomic constraints, enhance crop performance and improve water and nutrient use efficiency. Through active collaboration between rice growers, advisors and extension officers, the Focus Sites foster knowledge sharing and peer learning, enabling timely, data-driven decision-making to maximise yields and sustainability in rice production.
Key learnings
• Engaging a committed Reference Group that challenges the status quo increases the value of the learning process and the final results for ALL involved.
• There often is no single ‘right’ answer — the real value lies in the discussions and interactions within the Reference Group, which help validate the final decision.
• Reference Group interaction is more effective when more information is available. This includes multiple past yield maps and imagery for summer and winter crops, landform maps, etc.
Actions
Data collection, monitoring and insights
A whole crop system approach is taken to identify constraints, monitor crop progress and make informed decisions for crop inputs and management in discussions with the farm owner and Reference Group members. Alongside regular crop monitoring, data on various aspects of crop management is collected and analysed (Figure 34). This includes:
• paddock history (including yield maps from previous summer and winter crops, and cut/fill maps)
• EM mapping and grid soil tests to identify constraints (e.g. varying soil zones, pH, calcium, sodium, phosphorus and CEC)
• soil preparation and layouts to suit crop rotation (e.g. beds, boarded)
• sowing method focused on water use efficiency (e.g. direct drill)
• weather (e.g. temperature, rainfall and radiation)
• crop establishment (e.g. plant counts)
• nutrient management (e.g. products, timing, rates and variable rate application where applicable)
• weeds, pests and diseases management (e.g. product, timing and rates)
• crop nitrogen uptake
• water management (e.g. timing, water depth and use)
• productivity (e.g. yield, quality, water use efficiency and nitrogen use per tonne of grain)
• economics (input costs and gross margin analysis).

Figure 34. The Focus Sites monitor and evaluate a range of factors to identify best management to maximise yield
Each site is equipped with a weather station, time-lapse cameras and an Agbot™ to monitor water depth. Additionally, AgriFlo Mace meters are installed to measure the inflow and outflow of water in each paddock or bay, allowing for precise water usage measurement (Photo 3).


Photo 3. From left, camera, Agbot™ and AgriFlo Mace meter installed in each Focus Site. CREDIT: Virginia Porcile
In addition, digital decision support tools are used to assist with key management decisions. These include:
• NDVI and NDRE imagery to assess variability in the paddock (https://maps.datafarming.com/farms).
• University of New England (UNE) Rice Management Dashboard (https://youtu.be/BKJIc8cF1o?si=r0a5hfsSFgKUEI9H) to monitor individual crop growth in real time compared to the previous five-year average for that variety, region and sowing method (Figure 35). The UNE Rice Management Dashboard also provides a zoned nitrogen uptake map (Figure 36).
These tools support critical management decisions including nitrogen rates and timing, and crop and water management to ensure key phenology dates (such as panicle initiation and flowering) occur within the appropriate window. They also indicate crop maturity and guide the timing of drainage to achieve optimum harvest conditions and grain quality.


Figure 35. A chart generated from the UNE Rice Management Dashboard showing real-time rice crop growth rates according to nitrogen index vs flowering imagery for a specific paddock
Figure 36. A map generated from the UNE Rice Management Dashboard shows crop nitrogen uptake (kg/ha) in two paddocks
Outcomes
Success stories and inspiration
These insights help the wider farming community make informed management decisions by providing real-world data and benchmark reporting.
Success stories from the Focus Sites provide tangible examples of successful strategies, motivating others to try new approaches. When farmers see positive outcomes at the Focus Sites, they are encouraged to implement changes on their own farms.
As shown in Figure 6, information collected in the feedback survey from the February 2024 RiceTalks events indicates that the Focus Sites also serve as demonstration sites where farmers can learn from their peers about innovative techniques and technologies in action. This hands-on learning approach helps them adopt new practices more effectively.
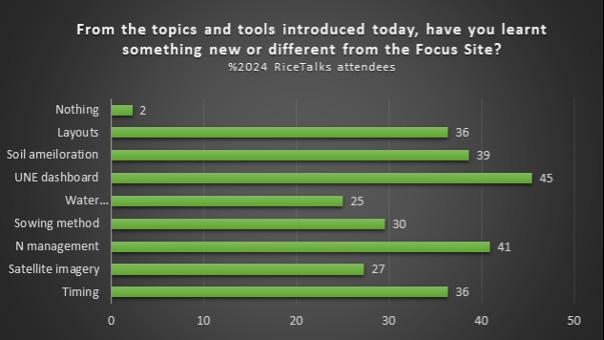
Figure 37. Information gathered from the February 2024 RiceTalks participants feedback survey shows the percentage of participants who learned about management practices and tools demonstrated on the Focus Sites
Networking and peer learning
Farmers often face isolation from research and extension services due to factors such as lack of time to attend events, slow connectivity, or remote locations. The Focus Site program aims to address this gap by acting as extension hubs, delivering research-based knowledge directly to farmers by showcasing practical solutions and innovations. Feedback from participants at the open events held at the Focus Sites (RiceTalks, February 2024) revealed strong interest in updates on crop management and progress, the latest digital tools for crop monitoring, and opportunities for networking and social engagement (Figure 38).

In summary, Focus Sites serve as living laboratories that foster learning, collaboration and innovation within the farming community. They contribute to successful agricultural extension by promoting knowledge sharing, collaboration, datadriven decision making, and inspiring positive change. Farmers benefit from these programs by learning from each other and adopting effective practices for their own farms.
These sites bridge the gap between research and practical application, supporting sustainable agricultural development and creating a trusted space for interaction and collaboration among local growers and consultants. This strategy also enables the monitoring and evaluation of the extension strategy’s effectiveness on target audiences.
The first season (CY24) provided valuable insights not only into crop management but also into understanding group dynamics and navigating the gap between ideal and real-life conditions in a commercial system with competing priorities. We are grateful for the time and contributions from the farm owners and Reference Group members, whose discussions created a rich learning environment for all.
Looking ahead to the new season (CY25), there are fresh opportunities for local farmers and consultants to join the Reference Groups, participate in public events and engage in this journey. If you are interested, please contact the Rice Extension team or approach any of the current group members.
Figure 38. Information gathered from the February 2024 RiceTalks participants feedback survey showing what value they would like to get from the Focus Sites for the next season


Photo 4. Open field days held at the Focus Sites during the CY24 season CREDIT: Virginia Porcile

MIA Focus Site
Location: Murrami
Grower: Patrick Sergi
Catchment: MIA
Focus Site Area: 58 ha
Patrick Sergi and his family own and manage an irrigated farming business in Murrami, NSW, specialising in rice, cotton, wheat and sheep production. Despite their dedication and efforts to maximise yield potential, farm rice yields have averaged 12–13T/ha in recent years. Driven by Patrick’s passion and commitment to improving yields and maximise profit, the MIA Focus Site was established in spring 2023. Two similar paddocks were selected for this initiative, one as the Focus Site and the other a comparison of ‘normal grower practice’.
Photo 5. MIA Reference Group meeting (February 2024) CREDIT: Virginia Porcile
Objective
Achieve a target yield of 15T/ha while maximising profit and water use efficiency through a combination of optimised timing of operations, addressing soil constraints, and using tools to monitor crop progress and make informed, timely decisions.
Key learnings
• Timing is everything — consistently getting everything right every time is critical for achieving high yields.
• Beds achieved a more even and consistent establishment compared to flat layouts.
• Soil and crop variability significantly impact yield and profitability if not adequately addressed before sowing.
• Extensive data and information (e.g. summer and winter crop yield maps, past imagery, cut/fill maps, etc.) improve decision making.
• A committed and interactive Reference Group that uses all available information plays a key role in achieving exceptional yield and profitability results.
Actions
Figure 38 shows the sequence of events for both the standard and focus paddocks during CY24, with the goal to reach PI in early January and target a yield of 15T/ha.

Figure 38. MIA Focus site sequence of events during the CY24 season for each paddock
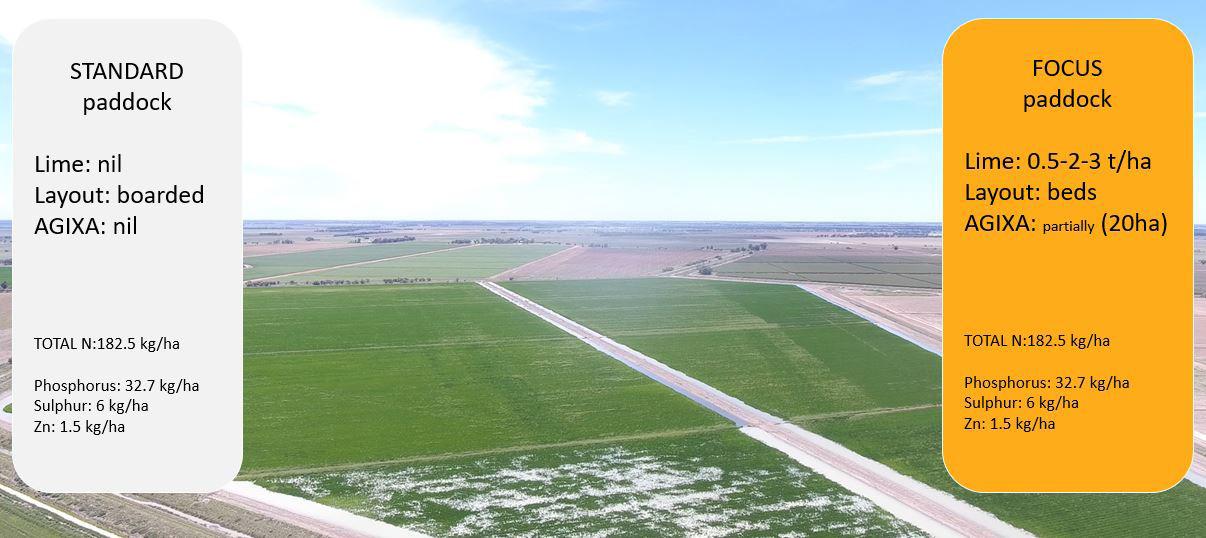
The main differences between the paddocks were soil amelioration (variable rate lime), layouts (ripped and shallow beds), variable rate nitrogen application at a later timing, and the application of Agixa® in the focus paddock (Photos 6 and 7).
Before permanent water application, the standard paddock was treated with a uniform rate of 250kg urea/ha plus 150kg/ ha GRAN AM®, while the focus paddock received an average of 310kg urea/ha on a variable rate of 260, 310 and 360kg/ha.
At PI (standard paddock end of December 2023, focus paddock early January 2024), the standard paddock was topdressed with a variable rate of 150–180kg/ha of Urea, whereas the focus paddock received a uniform rate of 160kg/ha. In summary, approximately 240kg/ha of total nitrogen was applied to each paddock through the growing season.


Photo 6. CY24 MIA Focus Site showing crop establishment on beds (focus paddock) CREDIT: Virginia Porcile
Photo 7. Aerial view of the CY24 MIA Focus Site showing the key differences between standard and focus paddock management
CREDIT: Mark Groat
Each paddock had three flushes, with permanent water applied two weeks earlier in the standard paddock. Total water use was 10ML/ha in the standard paddock compared to 11.35ML/ha in the focus paddock (Figure 39). There was a oneweek difference in PI, flowering and 22% moisture dates between the two paddocks. Harvest occurred 7–10 days later in the focus paddock, mainly due to weather conditions.

Despite challenging weather conditions at the start of the season, such as low temperatures and persistent winds, crop establishment met expectations. The focus paddock beds showed a more homogeneous emergence. Plant counts ranged from 185–245 plants/m² in the standard paddock and from 100 (in furrows) to 350 plants/m² in the focus paddock (Figure 40).

Figure 39. CY24 MIA Focus Site water management measured by Mace meters
Figure 40. Plant counting shows the difference between standard and focus paddocks
Alongside the regular in-crop checks, the crop was monitored using NDVI imagery (Figure 41), which then led to discussion within the Reference Group towards pre-PW Urea applications of 250kg/ha on the standard and variable rate zones of 260, 310 and 360kg/ha on the focus paddock.

(www.datafarming.com.au) from November 2023
The University of New England (UNE) Rice Management Dashboard assisted in predicting PW, PI, flowering and 22% moisture dates and monitoring the crop’s performance in comparison to the regional average for similar varieties over the past three years (Figure 42).
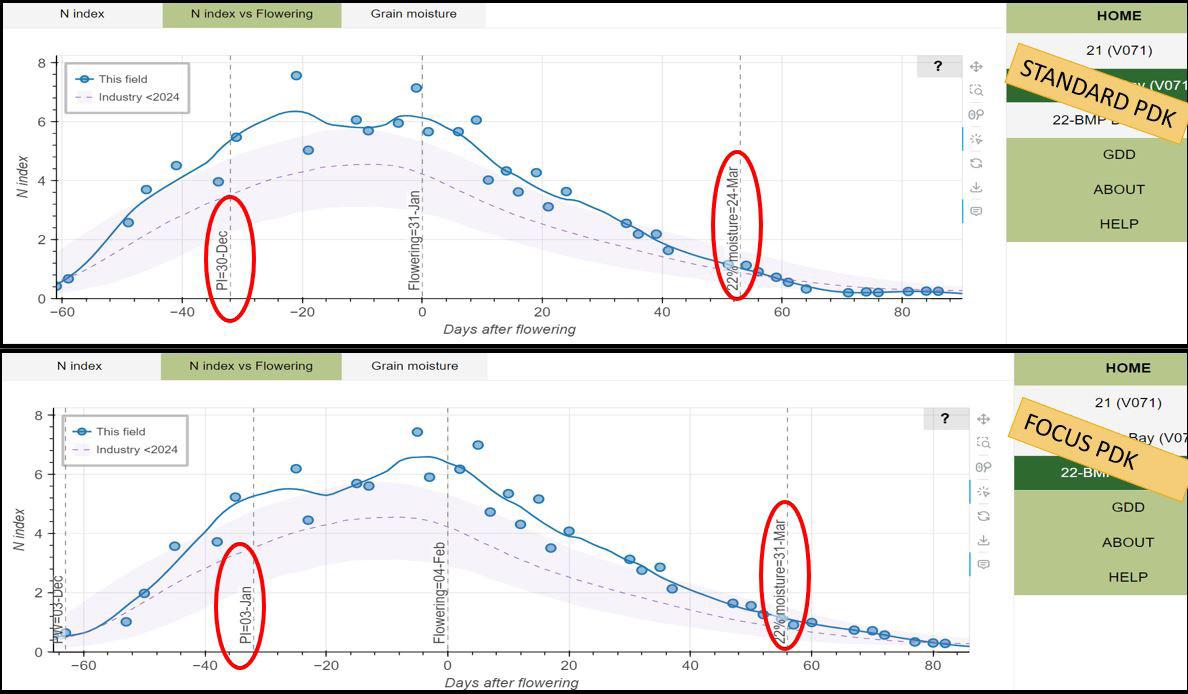
Figure 41. MIA Focus Site NDVI image
Figure 42. N index vs flowering crop evolution graph for MIA Focus Site paddocks, UNE Rice Management Dashboard
PI nitrogen uptake was monitored through the UNE Rice Management Dashboard. Combined with in-crop checks; this information assisted the farm owner and Reference Group in making the decision to apply a variable rate of 150–180kg/ ha of Urea to the standard paddock and a uniform rate of 160kg/ha to the focus paddock at PI.

Figure 43. MIA Focus Site NDIV image (www.datafarming.com.au) from November 2023
Outcomes
In terms of production and economic performance, both paddocks achieved target yields of 14.90 and 16.09T/ha yield in the standard and focus paddocks respectively. As shown in the yield map (Figure 44), variability was reduced in the focus paddock. Notably, in the standard paddock (left side of the picture), a blanket rate of nitrogen (250 urea plus 150 GRAN AM®) was applied at the five-leaf stage of the plant, along with permanent water. In contrast, the focus paddock received a variable rate of nitrogen (urea at 260, 310 and 360kg/ha) applied two weeks later, before permanent water.

Figure 44. MIA Focus Site yield map for each paddock
Details of crop production results are listed in Table 9 and economic performance in Table 10.
Table 9. Summary of CY24 yield, grain moisture, Paddy Vision Quality, water and nitrogen use efficiency for each one of MIA Focus Sites paddocks, MIA and all regions average for VO71
Grain yield was above initial expectations (14.9 and16.09T/ha), the gross margins were $3,785 and $3,909/ha, and per megalitre $371 and $327/ML for standard and focus paddocks respectively (Table 10).
Table 10. Summary of CY24 production and economic performance for the MIA Focus Site
*Estimated CY24 paddy price: $400/t price
** Water fixed costs incl. delivery: $27.24/ML, Measured water use: Standard = 10.02 ML/ha, Focus = 11.35ML/ha
In summary, a committed and interactive Reference Group, utilising extensive paddock history details to challenge management practices and application timing, contributed to achieving these exceptional crop yields and attractive economic performance.
What are growers and advisors getting from the MIA Focus Site?
A vital aspect of the project involves expanding the insights and experiences gained from various practices, technologies and tools used in decision making. To support this, open on-site events like field days, which promote farmer-to-farmer learning, are integral to the extension strategy. At the conclusion of the first season (CY24), we started assessing the knowledge, attitudes, skills and aspirations (KASA methodology) for practice change among growers and consultants who took part in the open events at the site.

Regarding intentions for change in the management of their next rice crops, responses from the open field days held at the Focus Site during the first season (Photo 8) indicate that:
• 59% of participants considered nitrogen management
• 50% thought about soil amelioration
• 32% considered the timing and use of satellite imagery
• less than 20% considered the use of digital tools, changes in water management, sowing methods and layouts (Figure 45).
Photo 8. Open field day held at MIA Focus Site in February 2024 gathering local growers, advisors and industry representatives CREDIT: Virginia Porcile

Figure 45. Practice change intentions collected from 2024 MIA Focus Site open field days (RiceTalks) attendees
We understand that this was the first time participants had direct contact with the Focus Site experience, so this monitoring will continue during upcoming seasons to assist in optimising the outcomes and benefits for growers.
The first season experience in the farmers’ own words:
• ‘I felt that the close interaction and discussion with other farmers in the decisions provided the most benefit.’ Focus Site grower.
• ‘Listening to others about their crop management made me think about the nitrogen rates I was applying.’ Reference Group member.
• ‘I can see it is possible to achieve 16T/ha and I want to achieve it as well.’ Reference Group member.
“I felt that the close interaction and discussion with other farmers in the decisions provided the most benefit.”


CIA Focus Site
Location: Coleambally
Grower: Justin Sutherland
Catchment: CIA Focus Site Area: 81 ha
Justin Sutherland, a third-generation rice farmer from Coleambally, NSW, manages his family’s farming business, which cultivates rice, corn, wheat and seed crops. In spring 2023, Justin’s motivation led to the establishment of the CIA Focus Site, where he experimented with growing rice on bed layouts for the first time. Two similar paddocks were selected, each employing a mix of different management practices. Justin and the Reference Group members collaborated to discuss and make decisions aimed at achieving the target yield.
The CIA region Focus Site of drill sown V071 showcased the benefits of beds to improve drainage and establishment, soil amelioration, water and nitrogen management, weed control and utilising the latest digital tools for monitoring. The site was also designed to provide a space for local growers and consultants to discuss and use information applicable to their own crops and businesses.
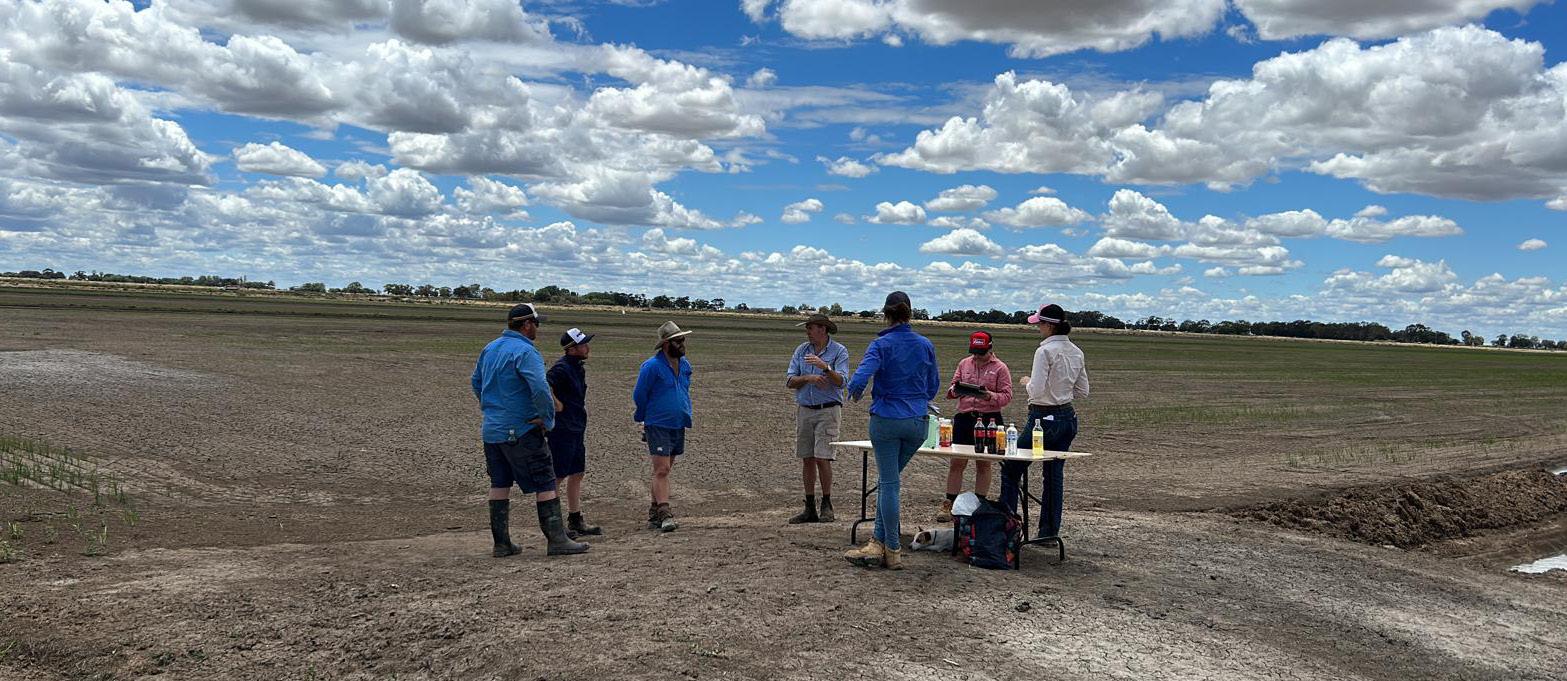
Photo 9: CIA Reference Group meeting discussing establishment and next management decision before PW (November 2023) CREDIT: Virginia Porcile
Objective
Achieve the target yield of 13T/ha while maximising profit and water use efficiency by combining optimum timing of operations, addressing soil constraints and implementing tactics and tools to monitor crop progress, leading to more informed decisions.
Key learnings
• The timing of operations such as soil preparation, sowing date, pre-water (PW) and urea applications directly impacts yield results.
• Bed layouts improve field drainage, leading to better crop establishment and more timely pre-harvest management activities.
• Variability within paddocks has a significant impact on yield and profitability.
• High nitrogen rates cannot compensate for poor crop establishment.
Actions
Figure 46 shows the sequence of events for standard and focus paddocks during CY24, with the aim to reach PI by early January and target a 13T/ha yield.

Figure 46. CIA Focus Site sequence of events during the CY24 season for each paddock
Sowing was delayed until 18 October 2023 due to time constraints and adverse weather conditions. The main differences between paddocks were soil amelioration (variable rate lime), layouts (shallow beds) and partial Agixa® application in the focus paddock (Photo 10). Both paddocks received 150kg/ha of Granulock® Z at sowing, variable rate urea prepermanent water and, in line with tissue test recommendations, no extra nitrogen was applied at PI. In terms of weed control, a two-way mix (Gramoxone® and Magister®) was applied after the first flush and Stomp® was applied after the second flush.
In the standard paddock, crop establishment varied from very poor, below 25 plants/m² (Figure 47) in the bottom bays of each paddock, to excellent, where bays averaged 205 plants/m². However, there was a fair amount of variability in this. The focus paddock averaged 265 plants/m², demonstrating the effectiveness of shallow beds in achieving more uniform plant populations. Even in the poorly established bottom bay, plant population of an even distribution of 36 plants/m2 was achieved.

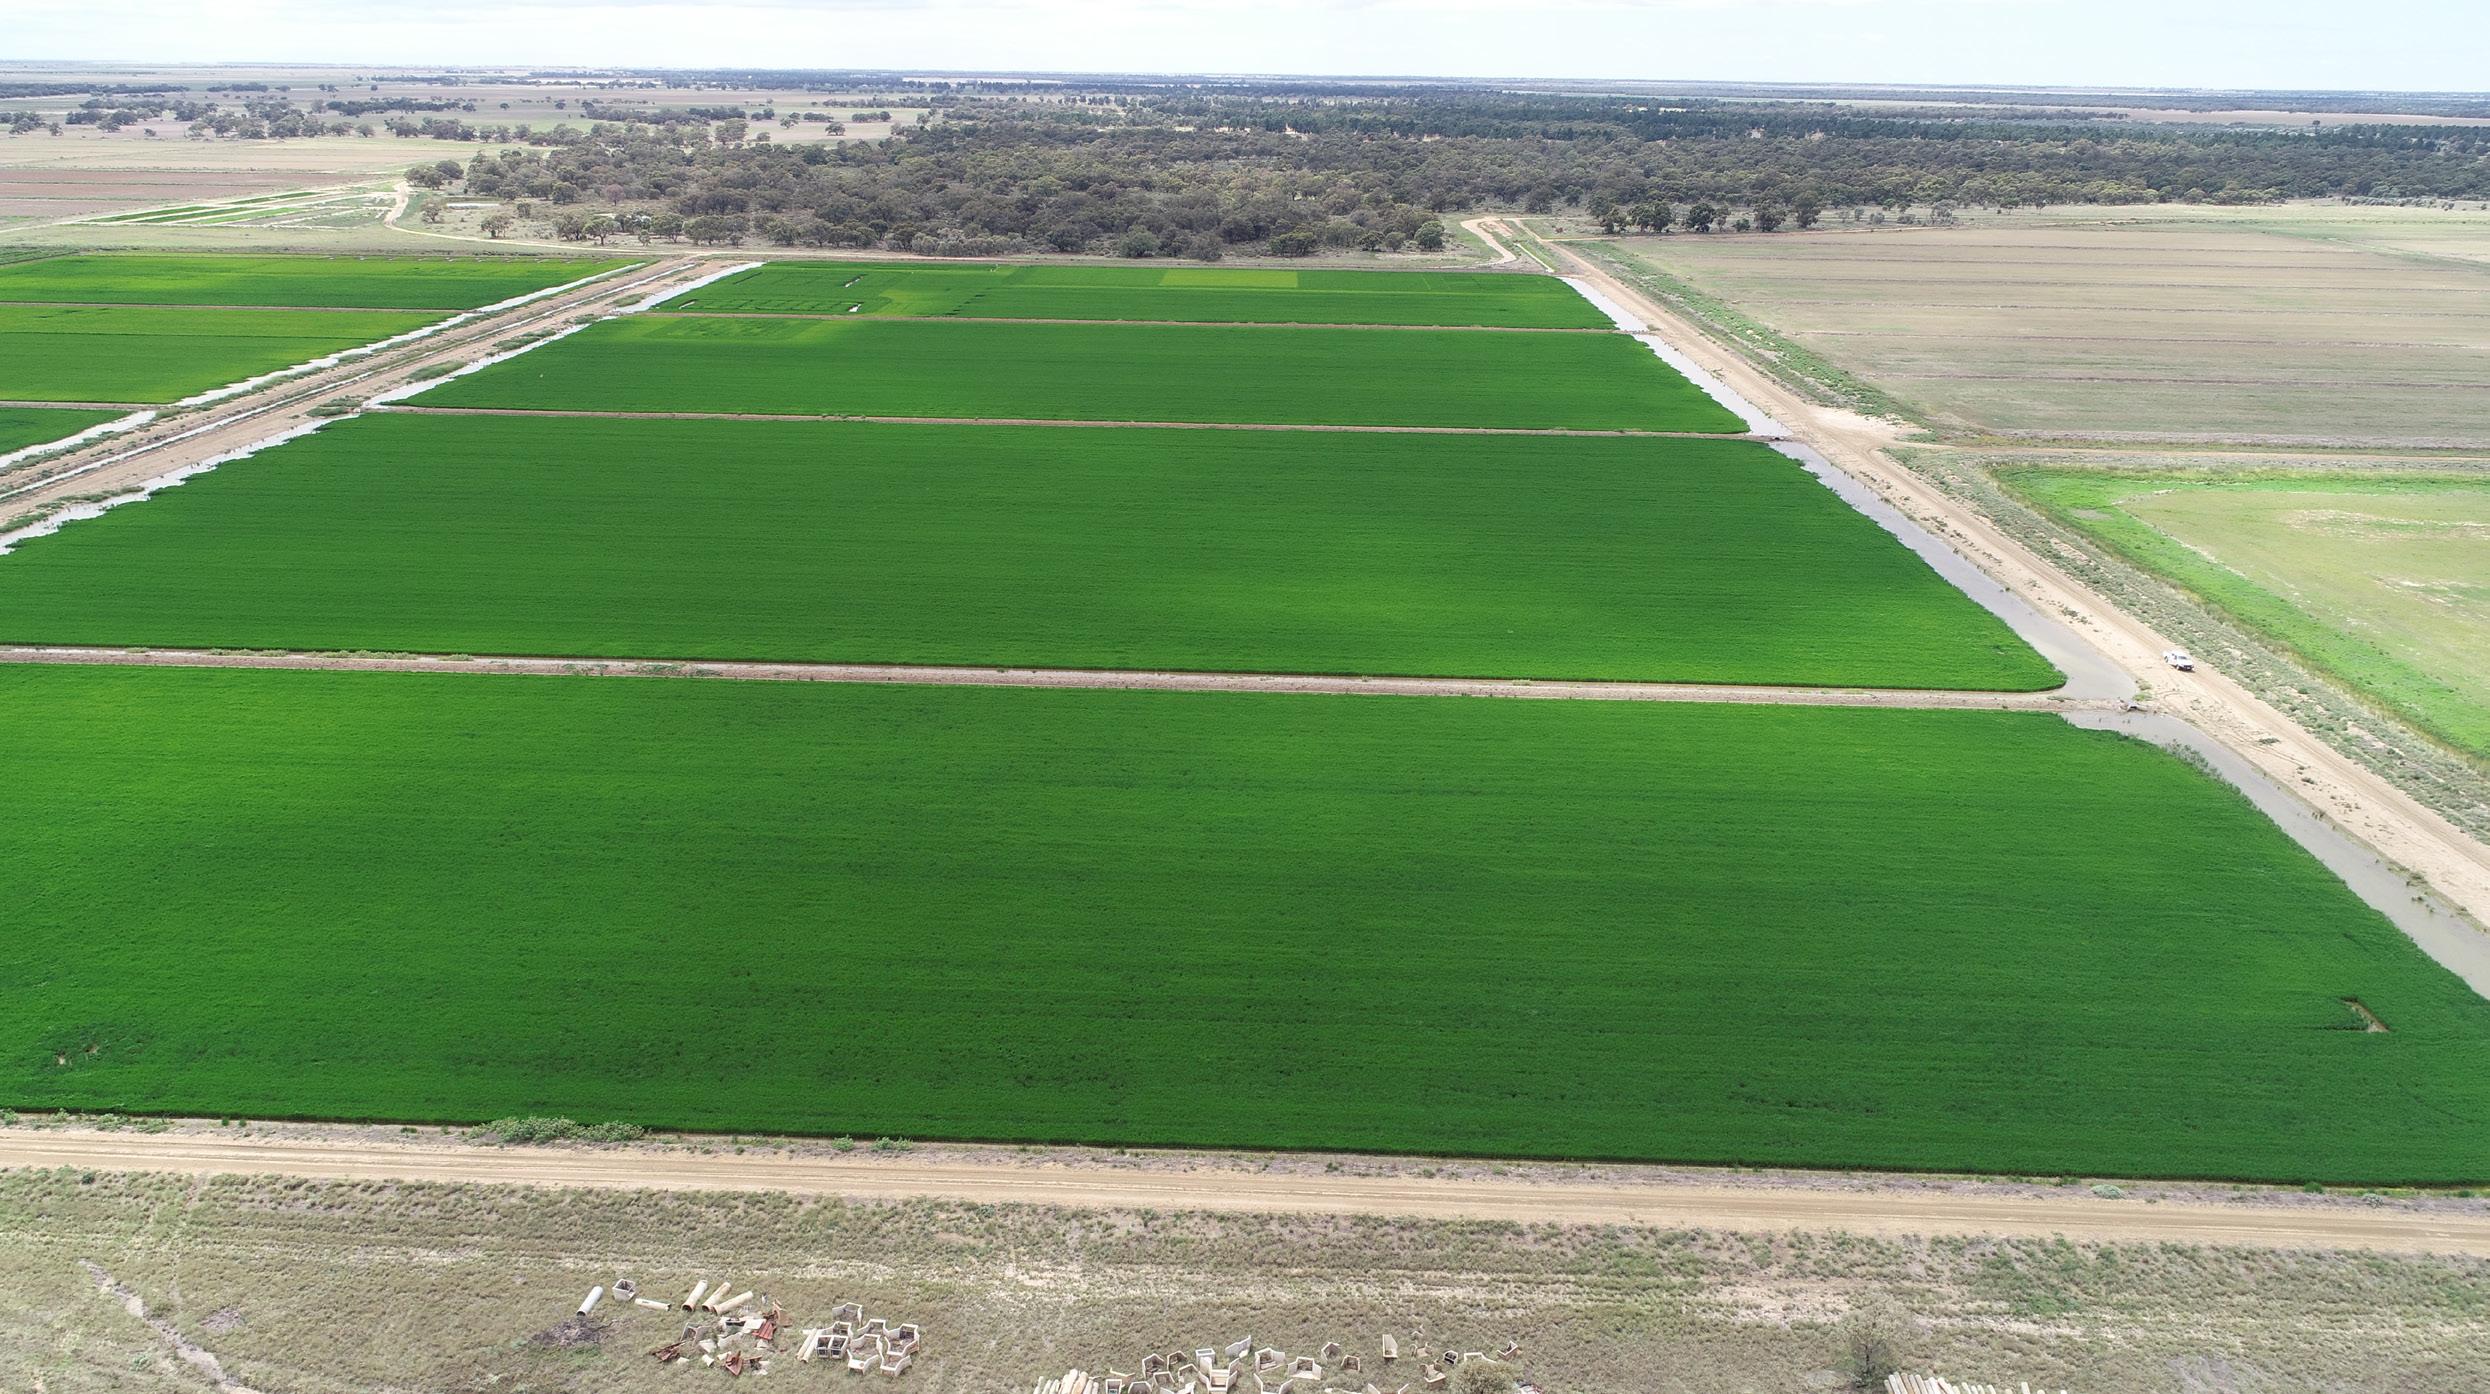
Photo 10. Aerial view of the CY24 CIA Focus Site showing differences between standard and focus paddocks CREDIT: Virginia Porcile
Figure 47. CY24 CIA Focus Site plant counting showing differences between the bottom bays (left) and the rest of the paddock, for standard and focus paddocks CREDIT: Virginia Porcile
Alongside the regular in-crop checks, the crop was monitored using NDVI imagery (Figure 48) to identify lower plant population areas in red and yellow, which were then validated with plant counts. Lower population bottom bays (in red) were resown with variable, mostly poor results due to duck damage.

Figure 48. CIA Focus Site NDVI image from November 2023, numbers show the range of established plants/m2 from plant counts, validated with in field counts
Information from Figure 49 led discussion within the Reference Group towards a variable rate nitrogen application from 320, 360 and 400kg/ha of Urea pre-permanent water (Figure 49). There was much discussion about the returns of high N rates on low population count areas. It was finally discussed that this was the poorer soil (much of which had good plant population) and could benefit from the extra N. Grower experience of ‘blowing’ areas in previous crops in this paddock added to this decision.

Figure 49. CY24 CIA Focus Site showing the range of N uptake (kg/ha)
PI nitrogen uptake was monitored through the UNE Rice Management Dashboard (Figure 50) showing the variability within each paddock ranging between less than 90 kg/ha to areas higher than 120 kg/ha (Figure 50).

Despite the low plant population on the bottom bays, both bays demonstrated the crop’s ability to compensate and recover after resowing and pre-permanent water (PPW) urea applications (Photo 11).
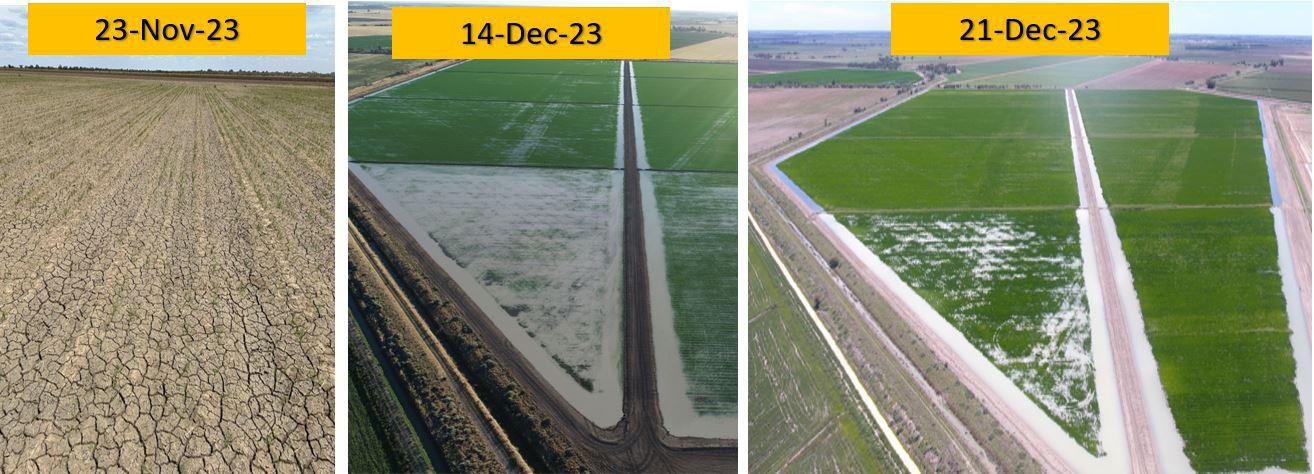
Figure 50. CY24 CIA Focus Site showing the variability in nitrogen uptake (kg/ha) November 2023
Photo 11. The CY24 CIA Focus Site shows the bottom bays’ plant population progress from plant counting on 23 November 2023 to after resowing and PPW urea application. CREDIT: Virginia Porcile
PI was predicted for 7 January 2024 and samples for the NIR tissue test were collected. Results showed no recommended extra N be applied, except for the bottom bay on the standard paddock (Sample C in Figure 51). The farmer’s decision was not to apply more N at this stage, so total N applied before PI was 166 kg/ha. Figure 52 shows the nitrogen uptake map by the end of January 2024.


Figure 51. CY24 CIA Focus Site PI Tissue Test results
Figure 42. Nitrogen uptake map at PI showing adequate N uptake across much of the standard and focus paddocks (end of January 2024)
The University of New England (UNE) Rice Management Dashboard assisted in monitoring the crop’s N index in comparison to the regional average for the same variety over the past three years (Figure 53). There was no difference in PI and flowering dates, while 22% moisture date was five days earlier in the focus paddock (Figure 54). Harvest occurred on 12 April 2024.


Figure 53. CY24 CIA Focus Site N index vs flowering crop evolution graph for each paddock (UNE Rice Management Dashboard)
Figure 54. CY24 CIA Focus Site 22% moisture prediction graph for each paddock (UNE Rice Management Dashboard)
In terms of water management, each paddock had three flushes, with permanent water applied at the same time (8 December 2023) in both standard paddocks. Total water use was 12.4 ML/ha in the standard paddock compared with 13.05 ML/ha in the focus paddock (Figure 55).

55. Water use of the CIA Focus Site for the CY24 season. Mace Meters were installed on the inlet and outlet of both paddocks to accurately capture actual paddock usage
Outcomes
Production and economic performance
At harvest (Table 11), both paddocks averaged 10.3T/ha. However, as shown in the following yield map (Figure 56), variability across the bottom bays of both fields significantly reduced the average.

Figure
Figure 56. CIA Focus Site yield map for each paddock
Crop production details are listed in Table 11, and economic performance is listed in Table 12.
Table 11. Summary of CY24 yield, grain quality, water and nitrogen use efficiency for each of the CIA Focus Site paddocks compared to the CIA and all regions averages for V071
Nitrogen use per tonne of grain
Even though grain yield was below target (10.3 vs 13T/ha), the crop gross margins were in line with farmer expectations and ranged between $2,053 and $2,300/ha for the focus and standard paddocks, respectively (Table 12). Gross margin per megalitre was $213.5 versus $186.3 respectively.
Table 12. Summary of CY24 production and economic performance for each of the CIA Focus Site paddocks
*Estimated CY24 paddy pool price: $400/t
**Water fixed costs incl. delivery: $27.24/ML, Measured water use: Standard = 12.35 ML/ha, Focus = 13ML/ha

Photo 21. CY24 CIA Focus Site open field day (February 2024) CREDIT: Virginia Porcile
What are growers and advisors getting from the CIA Focus Site?
The responses from the open field days held at the Focus Site during the first season (Figure 57) indicate that:
• 64% of participants considered layouts, specifically beds
• 50% thought about the timing of operations, such as soil preparation, sowing, irrigation, weed and nutrient management
• 43% considered sowing methods and the use of digital tools such as the UNE Dashboard to monitor crops
• 30% focused on soil amelioration
• 14% thought about water and nitrogen management, as well as using satellite imagery to monitor their next crops.

64% of participants considered layouts, specifically beds for their next rice crops
Figure 57. February 2024 open field day (RiceTalks) participants practice change intentions results from a post event survey
When asked about what worked well during the first season, Reference Group members shared:
• ‘Having a site specific to Colly is a bonus.’
• ‘Seeing demonstrations of things you want to trial at home on a farm in your region.’
• ‘Collaboration with a research organisation that is practical and works with growers.’
• ‘Standard vs grower paddocks.’
• ‘Face to face meetings.’
• ‘Beds vs no beds.’
• ‘Agixa results.’
Looking ahead to CY25, priorities will include optimising the timing of operations and addressing constraints. There will be a focus on fine-tuning water and nutrient management, implementing drone weed mapping and spraying, and showcasing irrigation automation. The Reference Group is excited to welcome new members and will double the number of local growers participating.


Photo 13: CIA Focus Site meeting analysing last season performance and planning upcoming one (CY25) CREDIT: Virginia Porcile.

WMV Focus Site
Location: Tullakol
Grower: Shaun Thomas
Catchment: WMV
Focus Site Area: 14 ha
The WMV Focus Site was established in spring 2023 on a newly acquired organic farm with a limited cropping history. It was freshly lasered with independent inlet and drainage points. Two similar bays were selected and set up with a combination of different management practices. The farmer and Reference Group members tested direct drill for the first time on this farm and they collaborated to discuss and make decisions aimed at achieving the target yield (Photo 15).
Photo 14. November 2023 open field day at the CY24 WMV Focus Site discussing establishment issues, current crop information and management plans going forward with local growers and agronomists CREDIT: Virginia Porcile
Objective
Maximise profit and water use efficiency while reaching a target yield of 12 T/ha by combining precise operation timing, addressing soil constraints and using advanced digital tools to monitor crop progress and make well-informed decisions.
Key learnings
• Timely crop establishment is critical for achieving high yields — low plant population cannot be compensated for later.
• Effective irrigation management during flushing and maintaining depth control after applying permanent water are key factors for high crop yields.
• Strategic management decisions were challenging and often uninformed due to the lack of key information and data, such as paddock history, past yield maps and crop growth information (imagery), exacerbated by continual cloudy conditions.
Actions
The following diagram (Figure 58) shows the sequence of events for the standard and focus bays during CY24 with the goal to reach PI in early January and targeting 12T/ha yield.

Figure 1. WMV Focus Site sequence of crop management events
The primary differences between the standard and focus bays were in soil amelioration and nutrient applications. In the standard bay, gypsum was applied at a rate of 1T/ha, while in the focus bay, it was applied at 2.5T/ha. The gypsum was incorporated using a speed tiller. For planting nutrition, the standard bay received a uniform rate of 100kg/ha of DAP, whereas the focus bay received a variable rate of 50 to 150kg/ha of DAP. Nitrogen application at pre-PW was 250kg/ha in the standard bay compared to 300kg/ha of urea in the focus bay (Photo 16).

Photo 15: WMV Reference Group meeting discussing establishment and plant count data (November 2023) CREDIT: Virginia Porcile
Photo 16. Aerial view of the CY24 WMV Focus Site bays highlighting the differences between standard and focus Bay. Note the water accumulation, which posed challenges for early water management CREDIT: Mark Groat
Outcomes
Production and economic performance
Cold temperatures below 15°C, combined with persistent winds in October 2023, generated establishment issues caused by crusting and significant seed sink. Despite seed being sown at 3–4cm, it sank to 10cm, most likely due to the freshly lasered and poorly structured soil. As a result, plant populations ranged from 0–130 plants/m2 in the standard bay to 10–120 plants/m2 in the focus bay (Photo 17).

Alongside the paddock walks, the crop was monitored using NDVI imagery (Figure 59) and the University of New England (UNE) Rice Management Dashboard. The crop’s performance was then compared to the regional average for the same variety over the past three years (Figure 60). Consistent with in-field observations, the growth curve indicated that the crop was performing below average until 15 days after flowering.

Photo 17. WMV Focus Site standard (left) and focus (right) bay overview showing a highly variable population at plant counting (November 2023) CREDIT: Virginia Porcile
Figure 59. WMV Focus Site NDVI image from 21 December 2024 confirming lower population areas in red and yellow
There was no difference in PI and flowering dates between the paddocks. However, the 22% moisture date was four days earlier in the standard paddock. Harvest occurred by 22 April 2024 (Figure 60).

Each bay had four flushes, with permanent water on 6 December 2023. Total water use was approximately 11 ML/ha (Figure 61).

Figure 60. N index vs flowering crop evolution curves for WMV Focus Site bays, UNE Rice Management Dashboard
Figure 61. Water use (ML/ha) for the WMV Focus Site
At harvest, the production performance results revealed a 0.9T/ha yield difference between bays. The crop yield aligned with the seasonal WMV average. However, CY24 yields in the WMV region were 12% below the regional average and below the average across all regions (Table 13).
Crop production details are listed in Table 13, with economic performance outlined in Table 14.
Table 13. Summary of V071 WMV Focus Site production, grain quality, water and nitrogen use efficiency in comparison to the 2024 WMV region and all regions harvest average
In terms of economic performance (Table 14), the gross margins were $2,594 per hectare for the standard bay and $2,150 per hectare for the focus bay. The difference in profitability is attributed to the higher yield and lower costs in the standard bay, including savings on gypsum, fertiliser, chemicals and water. Additionally, the gross margin per megalitre was $229 for the standard bay compared to $178 for the focus bay.
Table 14. Summary of CY24 production and economic performance for each WMV crop situation
FOCUS SITE: MIA
*Estimated CY24 paddy price: $400/t price
** Water fixed costs incl. delivery: $27.24/ML, Measured water use: 11 ML/ha
V071 STANDARD Bay FOCUS Bay
In summary:
• Poor establishment significantly limited crop yields.
88% of participants are now considering soil amelioration for their next crop
• Variable water depth, particularly during the microspore period, may have negatively impacted yields.
• The additional 50kg of nitrogen did not result in an economic yield response.
• The lack of paddock history and performance data made it challenging to identify constraints effectively
• Persistent overcast conditions led to poor satellite imagery, which affected the availability and timeliness of crucial information.
What are growers getting from the WMV Focus Site?
In February 2024, an open field day was held at the site to share the results and learnings from this experience with local growers and advisors. During the event, Reference Group members and soil specialists provided valuable insights on soil amelioration, nitrogen management, timing of operations, sowing, weed control and water and nutrient management. Following the event, participants were surveyed on how the information presented may influence their crop management practices. The results were promising:
• 88% of participants are now considering soil amelioration for their next crop.
• 38% are rethinking the timing of various operations (such as soil preparation, sowing, water, weed control and nutrient management).
• 13% are contemplating changes in water management, layout, sowing methods and the use of the UNE Dashboard to monitor their crops (Figure 62).

Figure 62. February 2024 open field day (RiceTalks) participants practice change intentions results from survey
The CY25 season brings new opportunities to set fresh production and economic targets, refine practices from last year, and experiment with innovations like the low-cost automation systems developed by Deakin University. We are also excited to welcome an expanded, vibrant Reference Group as we look forward to the upcoming season (Photo 18).


Photo 18. WMV expanded Reference Group meeting analysing the previous season (CY24) and planning for the next one (CY25) CREDIT: Virginia Porcile
EMV RRAPL
Location: Jerilderie
Grower: Rice Research Australia Pty Ltd (RRAPL) — Old Coree Catchment: EMV
Focus Site Area: 21 ha
The CY24 EMV Focus Site at RRAPL evaluated the production and economic performance of V071 under direct drill sowing, different soil amelioration and nitrogen rates and timing. The project addresses soil constraints, water and nutrient management, weed control and managing crop decisions using the latest digital monitoring tools.
Photo 19. Aerial view of CY24 EMV Focus Site at RRAPL (December 2023) CREDIT: Mark Groat
Objective
Optimise yield, enhance water use efficiency and maximise profit using a combination of strategies. This involves optimising the timing of operations, addressing soil constraints such as pH, sodium, calcium and phosphorus, varying nitrogen rates between pre PW and PI, and adjusting the timing of applications based on crop monitoring and digital tools that closely track crop progress. Additionally, the aim is to evaluate how far we can push V071 with pre-plant nitrogen to monitor its impact on yield response and lodging.
Key learnings
• Identify and address soil constraints prior to planting to maximise yield potential.
• Match nitrogen applications to crop yield potential and ensure efficient application to maximise plant uptake.
Actions
Figure 63 shows the sequence of events from pre-sowing through to harvest for the Focus Site during CY24. The goal was to reach PI in early January and target a yield of 15T/ha.
Planting occurred on 19 October, with the first flush completed by 23 October. On average, all bays received 150kg/ha of Granulock® Z through variable rate application between 100–175kg/ha based on soil test results (Figures 64a and 64b).
After the first flush, all bays were treated with a three-way mix of 0.5L/ha Gramoxone®, 1.2L/ha Magister® and 3.4L/ha Stomp®. Agixa® was applied on 11 December after PW.

Figure 63. CY24 EMV-RRAPL Focus Site crop management timeline
Four flushes were applied, with PW on 9 December at the early tillering stage of the crop. In-crop and remote monitoring, including NDVI imagery (Figure 67) and the University of New England (UNE) Rice Management Dashboard (Figures 68 and 69), occurred throughout the season.


Figure 64a: CY24 EMV-RRAPL Focus Site SOIL P (Colwell) — depth: 0-10 cm
Figure 64b: CY24 EMV-RRAPL Focus Site Prescription P map
Outcomes
Production and economic performance
A 21ha field was used to demonstrate (at a commercial scale) varying nitrogen rates to evaluate the production and economic performance of V071.
Soil constraints were managed using variable rates of lime, identified using grid soil tests, as shown in Figures 65a and 65b. Lime was applied at rates between 3 to 6.5T/ha, with an average of 5T/ha across the field. Soil pH ranged from below 4.8 to 5.2 (CaCl2). This lime application is part of an ongoing amelioration program aimed at addressing and preventing acidification under a long-term rice rotation.
Table 15 identifies each nitrogen application at pre PW and PI. Treatments as per Figures 67 and 68 were harvested with a commercial harvester and weighed individually to obtain yield results.
Table 15. Description of the demonstrations at the CY24 EMV-RRAPL Focus Site EMV (RRAPL)
Operation Name
1 (B2E)
2 (B2W)
3 (B3E)
4 (B3W)
5 (B4E)
6 (B4W)
All production and economic results are detailed in Table 17. In summary, the best performing treatment was 350kg/ha of PPW urea followed by 100kg/ha urea at PI. Up to 550kg/ha of urea PPW had no significant impact on yield and did not induce lodging.


Figure 65a. CY24 EMV-RRAPL Focus Site SOIL Ph (CaCl) — depth: 0-10 cm
Figure 65b. CY24 EMV-RRAPL Focus Site lime prescription treatments
As shown in Figures 66a and 66b, each bay had a different combination of N rate at pre-PW and PI.
16. CY24 EMV-RRAPL Focus Site treatments
Bay 3 West (B3W)
Bay 3 East (B3E)
Bay 2 East (B2E)
Bay 2 West (B2W)
urea @ PPW
Bay 4 West (B4W) 450kg/ha urea @ PPW
Bay 4 East (B4E) 350kg/ha urea @ PPW

66a. CY24 EMV-RRAPL Focus Site treatments showing different urea applications per bay at PPW
Figure
Table


Figure 66b. CY24 EMV-RRAPL Focus Site treatments showing different urea applications per bay at PI
Figure 67. EMV Focus Site NDVI image from January 2024

Figure 68. N index vs flowering crop evolution graph for EMV Focus Site paddocks, UNE Rice Management Dashboard

In summary, the results of the demonstrations from this season (Table 17) show that V071 responded to nitrogen doses from 161 to 253 kg N/ha without lodging. The following findings highlight key outcomes from the demonstrations:
• Urea applications split between PPW (80%) and PI (20%) achieved higher yields compared to a single application of 100% at PPW (B2E, B2W, B4W and B4E).
• 350kg/ha urea at PPW and 100kg/ha urea at PI achieved the highest yields and gross margins/ha (B3W). The application of an additional 100kg/ha of urea at PPW (450kg/ha) did not increase yield and resulted in $70/ha decrease in gross income (B3E).
• When nitrogen is applied 100% at PPW, the 550 kg/ha urea achieved the highest yield (14.5 T/ha) and obtained higher gross margins compared to 450 and 350kg/ha urea.
• Applying 100kg/ha of urea at PI on top of a base rate of 350kg/ha PPW resulted in a 2.5T/ha increase in yield over no PI nitrogen (15.6 vs 13.1T/ha). This produced an additional $892/ha of gross margin.
Figure 69. Nitrogen uptake (kg/ha) for EMV Focus Site paddocks, UNE Rice Management Dashboard
Table 17. CY24 EMV/RRAPL Focus Site production and economic results per treatment
What are growers and advisors getting from the EMV Focus Site?

A crucial aspect of the project is scaling up the insights gained from the different practices, technologies and tools used in the decision-making process. During the season, information was introduced and discussed with local growers and advisors at both the Establishment (October 2023) and RiceX (February 2024, Photo 20) field days.
For the CY25 season, the Focus Site will be moved to a growers’ field to promote peer learning within the local EMV community. A group of 12, including growers and consultants, will collaborate on managing the EMV Focus Site strategy. Key decisions will be communicated to the wider growing community, including the rationale behind various options considered. The main aim is to promote timeliness of operations and consideration of the relationship between nitrogen management, plant population and irrigation management, focusing on profitability, yields and input use efficiency.

Photo 20. CY24 EMV-RRAPL Focus Site information and results presented at the 2024 RRAPL field day CREDIT: Virginia Porcile
Photo 21. Reference Group meeting at CY25 EMV Focus Site at Josh Small’s farm CREDIT: Virginia Porcile

The Last Word: Your Questions Answered
I had a lot of trouble getting V071 to establish. Is poor seedling vigour a trait of V071?
Across the whole region, establishment of both drill and water seeded crops was challenging. So, the short answer is no — V071 does not have poor seedling vigour compared to other rice varieties.
This is the third season of commercial V071, making up 86% of total crop area in CY24. According to DPI trials (see Rice Variety Guide 2024–25 (www.dpi.nsw.gov.au) V071 has similar seedling vigour to both Reiziq and Sherpa.
In the two seasons prior to CY24, establishment was not flagged as an issue, and in DPI and Rice Breeding Australia (RBA) trials this season there was no difference in establishment observed between varieties planted side by side. By observation, there were two factors that contributed to tough establishment conditions in CY24:
1. Cool temperatures slowed seedling growth, and continually windy conditions dried out (and often crusted) the soil surface. Flushing was required 4–5 times on drill sown crops to re-wet the surface and alleviate crusting issues, which further cooled soil down and slowed seedling growth.
2. Establishment issues were more pronounced in paddocks that were worked and boarded to a fine tilth. This, combined with consistent windy conditions, enhanced crusting issues and, in some cases, resulted in soft, friable conditions. These factors contributed to seed sink, further complicating emergence.
Does Paddy Vision (PV) give lower whole grain or quality scores compared to the previous whole grain yield (WGY) measurement?
Quality scores measure cracks in the grain and immature grains. Immature grains refer to grains that ran out of moisture before maturity and turn to powder when milled. These are not green grains, which can be mature and still dry down to whole grains. There is a very high correlation between this measurement and WGY (as outlined in the PaddyVision fact sheet available at www.riceextension.au)
This is the third season of Paddy Vision. The first season it was run in parallel with the WGY measurement. The previous two seasons had excellent quality grain due to consistent mild dry down conditions.
In comparison, CY24 had hot dry down conditions which affected early crops, as heat at this stage caused poor grain structure and integrity. Warm conditions also occurred at drainage, meaning many crops were drained later and harvest started at lower moisture (around 17%) than the usual 22–24%. Dry grain with less than 17% moisture, that absorbs moisture and then dries down again is especially susceptible to cracking. Rain events during this period contributed further to these challenges.
PV quality scores are now measured for each truckload at delivery. This differs to the previous method in which an amalgamated sample was taken, with quality results received three months after harvest. The data received from PV is significantly more detailed and relevant, giving more opportunity for analysis and management.
Why can’t I get the yield from my repeat rice (rice on rice) crops?
As a general rule, we expect repeat crops to yield at least a tonne per hectare less than crops on fallow ground. We have minimal disease issues in our temperate rice systems of SE Australia, and with weed control and timing all being equal, this yield difference is largely impacted by nutrition.
DPI trials last season showed if phosphorus, sulphur and zinc are all adequate in the system, that an extra 60–80 kg/ha of pre-permanent water urea is required in double up crops compared to fallow crops.
What did the 16T/ha crops have in common?
Growers achieved a record 16.8T/ha rice yield this season, with yields greater than 16T/ha achieved in both the Murrumbidgee and Murray Valleys. The first question usually asked is how much nitrogen they applied. The answer is not much higher than the average crop that yielded 3–4T/ha less. In fact, nitrogen use per tonne of grain produced was usually lower.
What these crops did have in common was:
• They were planted early in the sowing window (not before) with panicle initiation early January.
• They had very even plant establishment across the whole paddock, between 150–250 plants per square metre. Not too thick (greater than 300 plants/m2), and not too thin (less than 100 plants/m2).
• They received excellent and consistent water management throughout both the vegetative and reproductive stages of the crop.
• The crops were very even across the whole paddock, no holes or low yielding areas.
Often the difference between a 13–14T/ha crop compared to a 16T/ha crop is the number of full grains in the head as opposed to flatheads. Crop bulk (and nitrogen management) is usually similar
Getting the timing, water management and nutrition right at all crop stages is the difference between a ‘good’ crop and an ‘exceptional’ crop — or an additional $800–$1,200/ha

Research Summaries
Rice Weed Management in Australia
PRO-013274, Malcolm Taylor, Agropraisals Pty. Ltd.
Objective
Improve the reliability and sustainability of weed control practices in drill and water seeded rice.
Activities for the CY24 season
Replicated field trials were conducted throughout the Riverina in growers’ fields with dedicated research paddies. The trials were designed to address:
• Four-way mixtures in drill sown rice
• Smartweed control
• Deferring STOMP application
• Alternatives to molinate in water seeded rice
• Trinexapac-ethyl anti-lodging treatments.
Photo 22: A smartweed escape in drill sown rice CREDIT: Malcolm Taylor
Key outcomes
1. SHARPEN (or LONDAX) continues to demonstrate safety to rice when tank mixed with GRAMOXONE plus MAGISTER plus STOMP for PFPE application (i.e. after the first flush irrigation). Smartweed, Bathurst burr and other broadleaf weeds appear susceptible to SHARPEN.
2. Post emergence application of BASAGRAN M60 (+/-LONDAX) is highly effective in controlling smartweed. Pre-sowing control of smartweed will be assisted by adding HAMMER or SHARPEN to glyphosate. STOMP offers some preemergence control of smartweed, while AGIXA is effective on young seedlings.
3. A new mode of action herbicide under development by FMC globally provided excellent control of both barnyard grass and silvertop grass in water seeded rice. Crop safety of this new compound was superior to the commercial standards of molinate and clomazone.
4. Deferring STOMP application in drill sown rice (after GRAMOXONE plus MAGISTER applied PFPE) can reduce the risk of rice injury. However, barnyard grass control can be compromised so the interval between the two applications should be minimised.
5. When applied at the early jointing stage, trinexapac-ethyl lowered rice panicle height and prevented lodging of Koshihikari rice, but it reduced rice grain yields of V071 by 3–8%.
Implications for growers
Improvements in the performance of post-flush, pre-emergence herbicide mixtures in drill sown rice are anticipated. However, more efficacy data is required before recommendations can be made.
Growers can now access an effective post emergence treatment (BASAGRAN M60 +/- LONDAX) for smartweed control. SHARPEN and HAMMER can be tank mixed with glyphosate to control emerged smartweed prior to sowing.
Field testing of four-way mixtures for drill sown rice and a return to evaluating programs for water seeded rice will continue next season.
I wish to thank the many ricegrowers who hosted my weedy field trials last season.
Malcolm Taylor | 0427 722 892


Advancing automation and smart sensing irrigation technologies in the rice industry
PRO-013247, John Hornbuckle, Professor (Irrigation and Agricultural Technologies), Deakin University
Objective
Advance and expand irrigation automation and smart sensing in the rice industry.
Activities for the CY24 season
During the CY24 season, farm Wi-Fi networks were successfully established across commercial rice farms using an approach developed by Deakin University. Wi-Fi nodes were set up to provide full farm coverage, operating with various available options: Starlink, 4G SIM card or fixed wireless. This approach allowed low-cost irrigation automation technologies to be installed across a range of irrigated outlets, automating both metal slide outlet gates and also tarp inserts.
Additionally, training materials and information on irrigation automation for rice growing were developed to provide a knowledge base for growers and extension officers.
Key outcomes
• The automation approach has now been successfully demonstrated across a number of rice farms with modifications made to tailor its application to various rice layouts. Integration of the automation technology across a range of irrigation outlet types has also been successfully achieved and linkage to a low-cost Wi-Fi float for automatically controlling bay water heights has been developed and tested.
• Feedback from growers on the use of irrigation automation approaches has been used to refine the systems and technology to make them simpler to use and more cost-effective.
• A knowledge hub website has also been developed at irrigationautomation.org, offering simple tutorials, videos, and information for growers and extension personnel to learn more about the simple, low-cost approaches to automation developed through this project.
Implications for growers
This low-cost technology can be implemented by growers for approximately $650 per outlet or less than $200 per hectare on typical-sized bays (with the cost per hectare decreasing as bay size increases).
On-farm automation provides several benefits, including improved lifestyle by eliminating late-night water changes and economic advantages through optimal control of irrigation water.
Next season
During the CY25 season, further expansion of the automation approaches will be undertaken, working with the Rice Extension team at Focus Sites across the Murrumbidgee, Coleambally and Western Murray Valleys. The project team will also be running further workshops to show growers how to build this technology themselves, implement it on-farm and expand the approach. Building of the automation units is quite simple and anyone who has the ability to send a message, use a screwdriver or weld a box (or knows a mate who can), has the ability to build and operate a Deakin Automation ALFIE.

Agronomy and remote sensing to maximise rice water productivity
PRO-013235: Brian Dunn, Tina Dunn, Alex Schultz and Josh Hart, Department of Primary Industries
Objective
Provide rice growers with best practice management guidelines for current and new rice varieties grown under a diverse range of water management practices and regions.
Collect crop phenology data to develop and update models for panicle initiation and maturity.
Provide valuable information to growers on nitrogen management and support the PI Tissue Test service with accurate NIR calibrations and nitrogen topdressing recommendations.
Activities for the CY24 season
The project had a successful season with 13 experiments established and completed. Five experiments allowed direct comparison of varieties for grain yield and agronomic traits. Three nitrogen experiments investigated nitrogen application rates, timing and efficiency for V071A. At four sites, large (45 x 45m) nitrogen plot experiments for remote sensing of nitrogen uptake were established.
A major component of this season’s research was the collection of phenology data from all experiments as well as 65 commercial field sites. The project also updated the NIR calibration allowing the PI Tissue Test service to provide accurate PI N topdressing recommendations for 240 rice fields covering 9,587 ha.
Key outcomes
Research results have been disseminated extensively to growers and agronomists through various Rice Extension activities and NSW DPI publications. The project outputs and extension activities conducted include:
• Rice Variety Guide 2024/25-Primefact 1112
• Rice nitrogen management-Primefact 22/619
• Individual growing guide for each rice variety
• Grower/agronomist meetings
• Four pre-season meetings — 240 growers/agronomists
• Agronomist pre-season — 25 agronomists
• Three grower BMP site meetings — 62 growers
• RRAPL Rice Field Day — 100 growers/agronomists
• AgriFutures Technical Research Update — 60 people
Improved accuracy of the PI and maturity date predictors were delivered through the UNE Grower Dashboards and the PI N uptake map was delivered for every rice field.
Implications for growers
The research conducted in this project has been effectively extended and widespread adoption has occurred across the industry. The research impact of higher yields, increased water productivity and higher profitability benefits both growers and industry by making rice a stronger competitor for water, with a higher $/ML return to growers.
Growers implemented our agronomic and nitrogen management recommendations for V071A, with some commercial fields obtaining record grain yields above 16 T/ha in the CY24 season.
The phenology data that was collected in our project has led to the development and improved accuracy of several crop growth models. The models have been incorporated into the UNE Dashboards which were widely extended by UNE and Rice Extension in CY24 and used by growers and agronomists with considerable praise of their benefit.
Next season
The current project finishes in November 2024 and is replaced by a new agronomy project led by Josh Hart and Alex Schultz from NSW DPI. This project will continue the variety and nitrogen research with experiments conducted across sowing methods and regions. Growing guides will be developed for any new varieties released and all NSW DPI Primefacts will be updated when required.
The new project also investigates the difficult decision of when to drain a rice crop for harvest. Extension of results will be undertaken in collaboration with Rice Extension.

Quick and Easy Precision Ag tools to increase rice yield and Water Use Efficiency (WUE)
PRO-013174: Tim Neale, Data Farming Pty Ltd
Objective
Deliver quick and easy Precision Agriculture (PA) tools to increase rice yield and WUE by reducing crop variability.
Activities for the CY24 season
Four tools have been released from the DataFarming project. These are available through the DataFarming platform (maps.datafarming.com) and include:
• In-season satellite imagery in high resolution for determining variability in rice fields
• Rapid-EM™ for fixing soil constraints with ameliorants
• Auto variable rate tool for fertilisers from satellite imagery
• Harvest moisture prediction tool.

Real-time remote-sensing based monitoring for the rice industry PRO-013078: Dr James Brinkhoff, University of New England
Objective
Build on past knowledge, investment, collaboration and existing frameworks to deliver a suite of real-time monitoring tools and alerts for improved decision making and benchmarking.
Develop remote sensing products to support improved yields, water productivity and profitability
Activities for the CY24 season
Activities for the CY24 season included updating models based on agronomy trial data from the Department of Primary Industries (DPI) through CY23, which encompassed parameters such as permanent water (PW), panicle initiation (PI) and flowering dates, nitrogen uptake, and grain moisture levels. Additionally, collaboration with DPI facilitated data collection from both commercial and experimental sites. Yield prediction models were developed using SunRice data from CY18–23 and validated for accuracy in CY24. Furthermore, rice mapping algorithms were updated by incorporating field information collected during CY18–23.
Key outcomes
• Real-time rice management dashboards were updated, implementing changes requested by CY23 users.
• Dashboards were delivered for 2,000 paddocks over 700 farms, with daily updates to predictions, remote sensing and weather data.
• Work with DPI to deliver nitrogen uptake zonal maps through the dashboards, and the PI predictor on the Rice Extension website.
• Delivery of regular updates on all field progress to Grower Services, including growth status, phenology, harvest date and yield predictions.
• Work with Rice Extension to deliver industry and regional benchmarking reports, which, for the first time, included information generated by the project (PW, phenology, nitrogen and relationship with yield).
Implications for growers
The automated rice maps identified fields that required remapping due to differences in sowing paddocks, facilitating better management decisions. Additionally, growers and agronomists adopted rice management dashboards at a high level, which provided valuable insights into crop performance during CY18–CY23. This enabled growers to effectively compare historical progress with the current season.
Mid-season nitrogen decisions were often informed by growth curves benchmarked against historical averages, along with nitrogen uptake maps, allowing for more precise management of nitrogen inputs. The predictions for rice grain moisture and harvest dates performed well, particularly for the V071 variety, which maintained greener flag leaves compared to others. In many instances, the models accurately predicted moisture dates that were 22% earlier than growers had anticipated.
Furthermore, yield analysis and forecasting models quantified yield variability concerning various factors, including phenology timing, which noted a 0.09T/ha decline per day of delay in panicle initiation and flowering. The models also highlighted the relationship between yield and nitrogen index, emphasising the importance of achieving sufficient value before flowering, as well as sensitivity to temperature around flowering. Many of these insights were incorporated into Rice Extension grower benchmarking reports.
Next season
To improve insights into field variability, growth curves, nitrogen, and grain moisture, predictions will now be divided into five zones per paddock. This will allow insight into field variability and move beyond providing only paddock averages.
In addition, several technical updates are being implemented:
• Cloud masking algorithms are being updated to try to retain as much high-quality image data as possible.
• New algorithms have been developed to reduce fluctuation in growth curves from date to date, which are caused by variability in satellite imagery.
• During cloudy periods, estimates of growth curves will be provided using secondary radar satellite data.
Furthermore, all models are being updated with new data from DPI and SunRice up to CY24, enhancing the reliability of the insights provided.
A complete redesign of the dashboard is also underway:
• Each grower will have a dedicated dashboard that consolidates information from all farms, paddocks and years since CY18, streamlining access to data.
• The user interface will be improved for easier navigation, featuring larger fonts and reduced scrolling.
• Incorporation of zonal predictions into growth curves and grain moisture graphs will provide deeper insights.
• Increased visibility into cloudy imagery will allow for better decision making despite weather conditions.
• New spatial maps will be integrated, displaying zones of NDVI, nitrogen index, nitrogen uptake and grain moisture at each date, further enhancing the tools available to growers.
