

2021 Water Quality Report
The Jersey New Waterworks Company Limited
Executive Summary
We have been delivering safe, high-quality water to Islanders for 140 years, it’s what we do best. The provision of clean, safe water is core to our purpose and during the year extremely high standards were again achieved.
Jersey Water supplied excellent, high-quality drinking water with an overall compliance rate of 100%, meeting the requirements of the Water (Jersey) Law 1972. We are one of very few water companies to achieve this. During the year we completed 15,308 analyses on treated water samples taken at the treatment works, treated water reservoirs and the mains network.
As part of the Action for Cleaner Water Group, we continue to work closely with the Government and the farming community delivering water quality improvements and protecting the catchment from pollution risks. Our approach places more focus on proactive catchment management activities using technology to monitor raw water quality that protects and safeguards our water sources. For the eighth consecutive year, we have successfully treated and maintained nitrate concentrations below the regulatory limit in drinking water. Water quality was also fully compliant with limits for pesticides for the 5th year in a row.
We are working collaboratively with the Government of Jersey Technical Officer Group investigating the issue of PFAS pollution in the vicinity of the airport within the St. Ouen’s Bay aquifer and Pont Marquet
catchment. We monitor the level of PFAS at the treatment works and in the affected water sources through an extensive sampling and analysis programme. Results of our testing provides assurance that the drinking water supply in Jersey remains fully compliant with water quality limits for PFAS set by the EU Drinking Water Directive and UK regulations. The aquifer in St Ouen’s Bay and the Pont Marquet catchment are important sources of water for the Island. Their pollution with PFAS presents a significant raw water quality challenge which inhibits their use and our ability to extract water from them. It is important that a treatment solution is found to address the issue and reduce the risks to these sources presented by PFAS. We are continuing to work with the Jersey Government to understand the extent of the pollution and the best treatment solution as remedial action.
Fewer consumers in 2021 contacted Jersey Water with water quality issues and enquiries, compared to the England and Wales (E&W) industry averages. The zone rate (number of contacts per 1,000 population) for water quality issues was 0.75, the lowest ever achieved by us and significantly lower than both the 2020 and (E&W) values of 1.22.
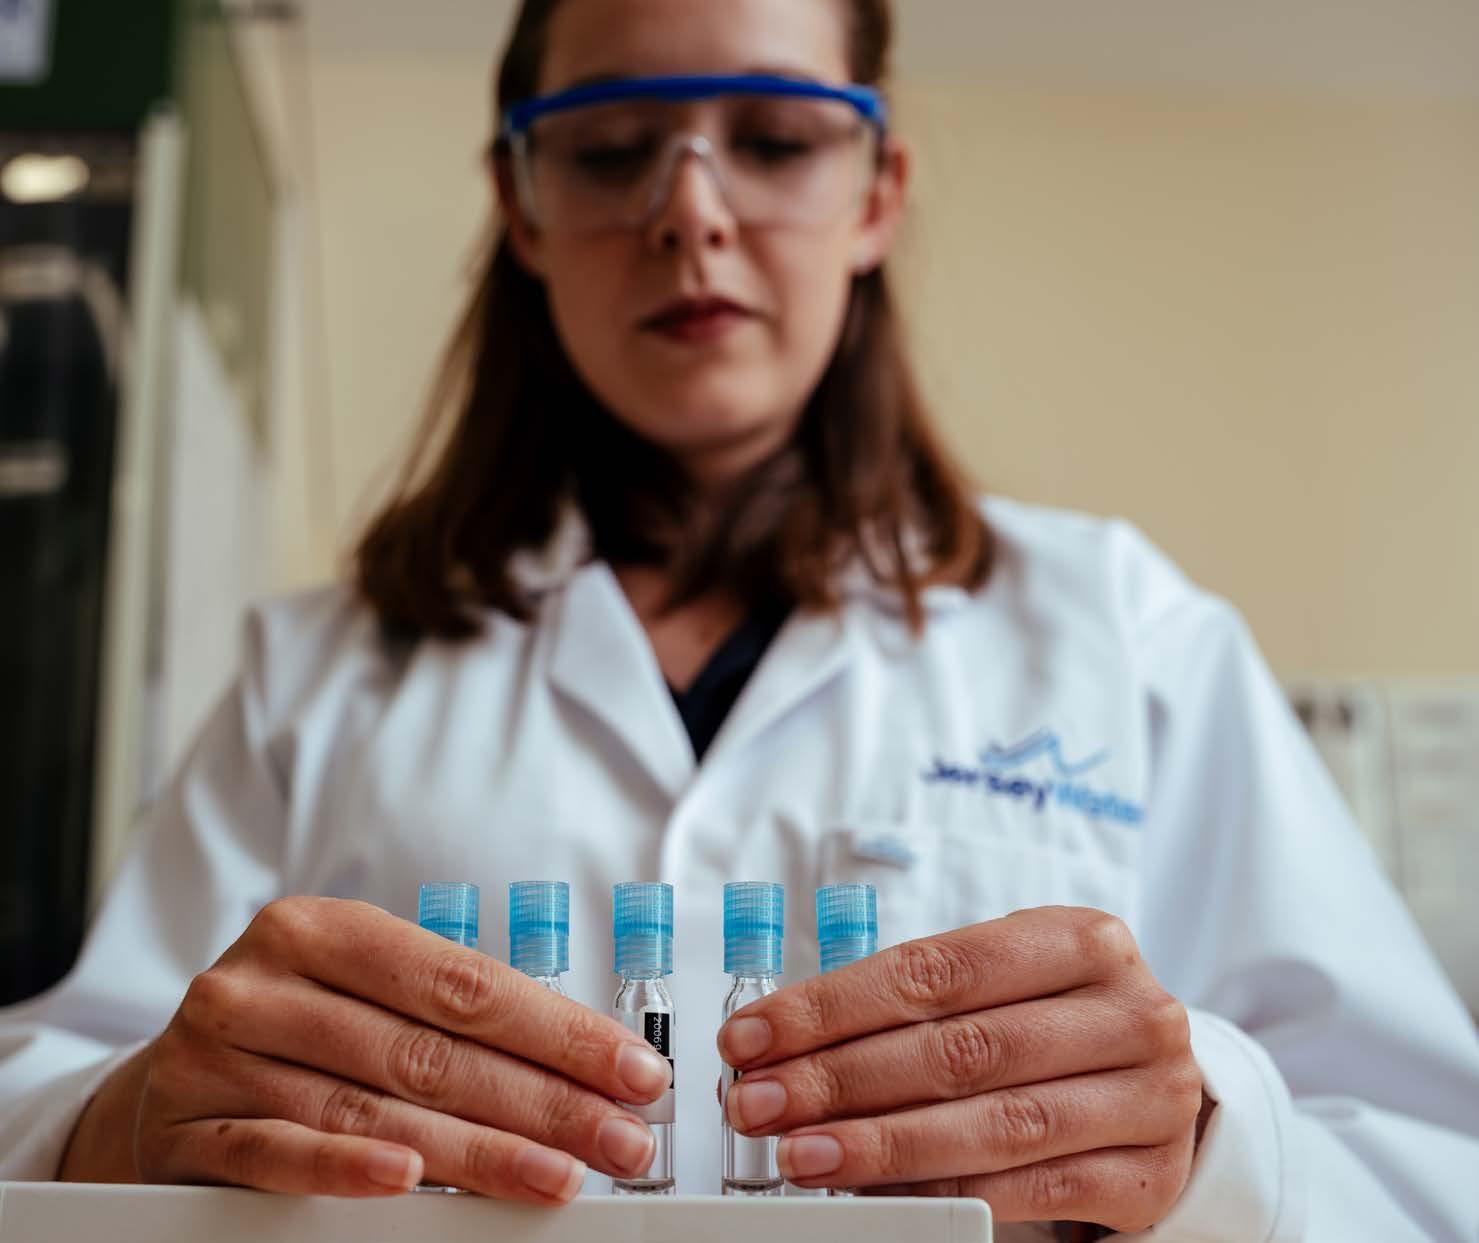
Water Quality Team
Jersey Water’s Water Quality Team is part of the wider Water Supply Team and comprises specialists in chemistry, microbiology, data analysis and sampling. The team works out of the Millbrook Laboratory where a range of microbiological and chemical analyses are carried out on a 7-day a week basis.
The team is responsible for the sampling, analysis and reporting required to ensure our customers receive safe, clean drinking water whenever they want it. The team works very closely with other Jersey Water colleagues responsible for all parts of the water supply chain, providing support and advice on issues affecting water quality.
The team also supports wider activities in Jersey. During 2021 they provided help to Government of Jersey departments including Environment and Environmental Health as well as technical support to the Action for Cleaner Water Group and the Government of Jersey Officer Technical Group on PFAS.
Oversight of Water Quality
Jersey Water operates under the legislative requirements set out in the Water (Jersey) Law 1972. Article 10 places a duty on Jersey Water to develop an annual monitoring programme and to submit that programme to the Minister of Environment each year for approval. In response to the Covid-19 pandemic and with regulatory approval by the Minister, the company amended its monitoring regime for 2021 to take account of the restrictions put in place to ensure the safety of both Jersey Water’s customers and employees.
Supply Points and Supply Zone Regulatory Results
Jersey Water adopts a risk-based water quality monitoring programme consistent with other water suppliers in Europe and elsewhere. This approach is further consistent with the Company’s Water Safety Plan where potential risks are evaluated and water quality testing is designed to help manage those risks.
We examined samples from supply points which comprised: our two treatment works at Handois and Augres, service reservoirs at Westmount and Les Platons and the supply zone (also known as the distribution network) for compliance purposes at regular intervals throughout the year.
The Company is required to undertake two kinds of regulatory water quality monitoring - check and audit monitoring. Check monitoring is more frequent, designed to ensure the treatment works are operating as expected and that the water in distribution is suitable for supply.
Audit monitoring is performed less frequently and is designed to test the quality of the water supplied against the full requirements of the Water (Jersey) Law 1972.
Overall Compliance
In alignment with this year’s financial reporting, the 2021 report is based on the twelve month period 1st October 2020 to 30th September 2021. Water quality in 2021 was very high with no non-compliant regulatory analysis identified out of 15,308 analyses taken for compliance purposes. Overall water quality compliance for 2021 was 100% which was slightly up when compared with the result for 2020 which had a compliance rate of 99.98%.
Compliance
Weekly microbiological & residual disinfection samples are taken from the service reservoirs to ensure there has been no deterioration in the water quality during storage.
Treatment Works Performance (Supply Points)
We sample water leaving the treatment works to ensure that it complies with regulatory parameters before it enters the mains network. During the 2021 reporting period the Company undertook 418 sampling events resulting in 12,280 analyses covering 127 physical, bacteriological and chemical parameters. All of the analyses were compliant with the regulatory limits.
Detailed supply point results are set out in Appendix 1, 2, 3 and 4.
Service Reservoir Performance
To comply with regulations, weekly microbiological and residual disinfection samples are taken from the service reservoirs to ensure there has been no deterioration in the water quality during storage. During the 2021 reporting period 827 analyses were undertaken on 165 samples all of which complied with the regulations.
Detailed service reservoir results are set out in Appendix 5.
Water Quality in the Distribution System (Supply Zone)
244 water samples were taken at fixed points of the distribution system; all of the 2,201 analyses were compliant with regulatory limits in the 2021 reporting period.
Detailed supply zone results are set out in Appendix 6 and 7.
Consumer Contacts and Enquiries
We care about our customers, and supplying water for our Island to thrive, today and every day. Every contact and enquiry received by our Customer Services team is recorded and categorised whether or not they require a visit to rectify an issue. The contacts for the 2021 reporting period are listed in the table below:
Informing Consumers


We care about our customers, and supplying water for our Island to thrive, today and every day.
Water and Consumers
E&W Industry average 2020: 1.22 Zone rate (contact per 1,000 population)
Fewer consumers contacted us on both enquiries and water quality issues, compared to the England and Wales (E&W) industry averages.
As in previous years the appearance of the water is the most common issue consumers contact our support services about with 53% of all contacts being in this category. This is a decrease compared to 2020, when 64% of contacts were about appearance.
There has been a significant decrease in the number of contacts regarding the taste or odour of the water supplied by Jersey Water from 27 in 2020 to 17 in the 2021 reporting period.
There were 18 contacts for water quality information in the 2021 reporting period, an increase in consumer enquiries. They covered a range of topics including:
• Dishwasher settings related to water hardness (typically 120 – 150 mg/l as CaCO3, more information can be found on the Company website https://www.jerseywater.je/waterquality/water-quality-faq/ under the appliance settings (dishwashers tab); and
• How much chlorine is in the water –this depends on the location of your property and how far the water must travel from our two treatment works to get there as the concentration dissipates the further it has to go.
Bacteriological and chemical samples were taken at 4 properties where the consumer had suspected the water supply to be causing illness, the samples taken were 100% compliant with the regulations. A further 57 bacteriological samples were taken during the investigation of consumer contacts by our inspectors, all but 1 visited were found to be compliant with the regulations, where the failure was traced to a contaminated storage tank.
Monitoring for pesticides in the 2021 reporting period continued weekly from all reservoirs.

Raw Water Quality
For operational and monitoring purposes we collect samples of water from streams, reservoirs and the inlet to the treatment works. This enables our operational staff to select the most suitable waters to be taken for treatment.
Nitrates
Whilst nitrates in treated water reached a peak of 46.5 mg/l in May 2021, below the regulatory limit of 50 mg/l, this was only possible through the careful selection and blending of raw water during the potato growing season and the availability of low nitrate water collected in the reservoirs before the growing season began.
Concentrations of nitrates in raw water peaked at 101.0 mg/l in May 2021 in the Queen’s Valley Side Stream catchment and averaged 43.9 mg/l throughout the Island during the year, down from 52.3 mg/l in 2020.
Pesticides
After successfully introducing new quality measures in 2020, to ensure the water taken from the reservoirs and sent for treatment was the best available, monitoring for pesticides in the 2021 reporting period continued weekly from all reservoirs. Utilising an analytical method which provides a broad scan for 450 substances, we were able to quickly identify if there were any issues.
During 2021 10 detections were made at 0.1 μg/l or greater, compared to 54 in 2020, but by careful selection of which reservoir to use and treatment, there were no breaches of the pesticide limit in treated water.
PFAS
Drinking water supplied by Jersey Water has been tested for PFAS (poly and perfluoroalkyl substances) since 1989. Based on the results of this testing the drinking water supply in Jersey has been fully compliant with the water quality requirements of the Water (Jersey) Law 1972 and meets the definition of wholesomeness against which drinking water quality is assessed. Results of drinking water testing for 2021 (Appendix 4) show either no detections for PFAS or detections well within the UK DWI guidance.
Understanding Test Results
Regulatory Analyses
The Water (Jersey) Law 1972 as amended, requires two types of monitoring at the treatment works, service reservoir outlets and in the distribution system:
(i) Check monitoring
Tests performed on a frequent basis to ensure that the treatment works and the water in distribution is suitable for supply.
(ii) Audit monitoring
Tests performed less frequently than check monitoring, designed to test the quality of the water supplied against the full requirements of the Water (Jersey) Law 1972.
Term Description
Substances and parameters
µS/cm
Sample Point
Min
Mean
Max
% Compliance
Specific concentration or value (maximum) or state mg/l µg/l MPN
The item we are testing for.
The maximum or range of values allowed by law in the water supply (regulatory limit).
Milligrams per litre or parts per million, equivalent to 1p in £10,000.
Micrograms per litre or parts per billion, equivalent to 1p in £10,000,000.
The unit of measure commonly used for electrical conductivity in water, microSiemens/cm.
The location where the sample was taken.
The minimum or lowest result produced for that test.
The average value of all the results produced for that test.
The maximum or highest result produced for that test.
The percentage of the results that comply with the regulatory limit.
The most probable number (MPN) is a statistical method used to estimate the viable numbers of bacteria in a sample.
Colony forming units (CFU), a physical count of the number of colonies of bacteria visible on a membrane or an agar plate.
Appendix 1: 2021 Treatment Works Performance – Check Monitoring
indicator of faecal contamination of treated water.
of coliform bacteria may indicate suboptimal operation of the treatment process or ingress of contamination from breaches in the integrity of the distribution system.
water supplies for colony count bacteria can be useful for monitoring trends in water quality or detecting sudden changes in quality.
be associated with nitrate or with the use of
in water
requires that there should be no haziness caused by fine particles.
Appendix 2: 2021 Treatment Works Performance – Audit Monitoring
Substances and parameters
Clostridium perfringens
Benzene Bromate
1,2 dichloroethane
Trichloroethene &} Tetrachloroethene}
Augres Final Water
results were below limit of detection from both sample points.
The presence of Clostridium perfringens in filtered water and/or final water may indicate deficiencies in the filtration process (e.g. filter breakthrough) or in the disinfection process.
Benzene may be introduced into source water by industrial effluents or atmospheric pollution. Bromate can be associated with industrial pollution or can occur as a by-product of the disinfection process.
The other compounds are all organic solvents, their presence is an indication of industrial pollution. Handois
Very low levels of these substances may occur naturally, but higher amounts could be associated with industrial pollution. The standards are health related but have a large built-in safety factor.
Appendix 2: 2021 Treatment Works Performance – Audit Monitoring (continued)
Occurs naturally in many water sources. The standard is set to ensure no adverse effects. Jersey Water does not artificially fluoridate the water supplies.
Occurs naturally in most water sources. Levels above the
could give rise to taste issues and contribute to corrosion.
Dissolves in water after contact with certain mineral deposits. Excess levels can contribute to corrosion.
This parameter assesses the organic content of the water.
parameters are measured as part of screening for radioactivity.
Appendix 3 - 2021 Treatment Works Pesticide Analysis– Audit Monitoring
A suite of 83 pesticides have been analysed during the year at the treatment works outlets. The following table shows the ones that were detected above the limit of detection – there were 68 substances that were not.
Appendix 3 - 2021 Treatment Works Pesticide Analysis– Audit Monitoring (continued)
Appendix 4 - 2021 Treatment Works Per- and polyfluoroalkyl substances (PFAS) Analysis– Audit Monitoring
A suite of 17 Per- and polyfluoroalkyl substances have been analysed during the year at the treatment works outlets. All results reported as µg/l.
and polyfluoroalkyl substances
(357-22-4) Perfluoro-n-butanoic acid
PFPA (2706-90-3) Perfluoro-n-pentanoic acid
(27619-97-2) Perfluoro-octane sulfonate
PFOA (335-67-1) Perfluoro-n-octanoic acid
(375-95-1)
PFHpS (375-92-8) Perfluoro-1-heptanesulfonate
Appendix 4 - 2021 Treatment
Works Per- and polyfluoroalkyl substances (PFAS) Analysis– Audit Monitoring (continued)
A suite of 17 Per- and polyfluoroalkyl substances have been analysed during the year at the treatment works outlets. All results reported as µg/l.
Per- and polyfluoroalkyl substances
PFUnA (2058-94-8) Perfluoro-n-undecanoic acid
PFDoA (307-55-1) Perfluoro-n-dodecanoic acid
PFOSA (754-91-6) Perfluoro-octanesulfonamide
PFDS (335-73-3) Perfluoro-1-decanesulfonate
PFPeS (2706-91-4) Perfluoro-1-pentanesulfonate
PFAS (sum of all substances listed above)
Appendix 5: 2021 Service Reservoir Performance – Check Monitoring
Substances and parameters
A primary indicator of faecal contamination of treated water.
Detection of coliform bacteria may indicate suboptimal operation of the treatment process or ingress of contamination from breaches in the integrity of the distribution system. For water to be deemed wholesome leaving a service reservoir there has to be a 95% or greater compliance with the coliform bacteria regulatory limit.
Monitoring water supplies for colony count bacteria can be useful for monitoring trends in water quality or detecting sudden changes in quality.
Sufficient chlorine is added to all supplies to ensure the absence of harmful microorganisms.
Appendix 6 - Water Quality in the Supply Zone – Check Monitoring
Substances and parameters
primary indicator of faecal contamination of treated water.
Detection of coliform bacteria may indicate sub-optimal operation of the treatment process or ingress of contamination from breaches in the integrity of the distribution system.
Chlorine is added to our water along with ammonia to form a stable chloramine disinfectant compound, to ensure that there are no harmful bacteria in the water we supply.
Occurs naturally in many water resources. Aluminium compounds are also used at some water treatment works to remove impurities, but are themselves removed in the process.
Monitoring water supplies for colony count bacteria can be useful for monitoring trends in water quality or detecting sudden changes in quality.
Water should be clear and bright but natural organic matter or pipework corrosion products may occasionally impart a slight tint.
A measure of the ability of the water to conduct an electric current and therefore a measurement of the mineral salts dissolved in the water. Clostridium
The presence of Clostridium perfringens in filtered water and/or final water may indicate deficiencies in the filtration process (e.g. filter breakthrough) or in the disinfection process.
Appendix 6 - Water Quality in the Supply Zone – Check Monitoring (continued)
A measure of acidity or alkalinity. Excessively acidic or alkaline water can contribute to corrosion of pipes and fittings.
Iron may be associated with the corrosion of old iron mains. The standard has been set for aesthetic reasons as levels persistently above the standard can give rise to discoloured water.
Occurs naturally in many water sources. The standard is set for aesthetic reasons as black deposits of manganese dioxide can give rise to discoloured water.
Nitrate arises from the use of fertilisers in agriculture and may be minimised by good practices and appropriate controls.
Nitrite may be associated with nitrate or with the use of ammonia in water disinfection.
The regulations specify that the ratio according to the following formula must not exceed 1, [nitrate]/50 + [nitrite]/3, where the square brackets signify the concentrations in mg/l for nitrate (NO3) and nitrite (NO2) respectively.
The water is examined for unpleasant taste or odour. These are set for aesthetic reasons.
The standard requires that there should be no haziness caused by fine particles.
Very low levels may occur naturally, but higher amounts could be associated with industrial pollution. The standards are health related but have a large built-in safety factor.
Appendix 7 - Water Quality in the Supply Zone – Audit Monitoring
Substances and parameters
Very low levels may occur naturally, but higher amounts could be associated with industrial pollution. The standards are health related but have a large built-in safety factor.
Benzene may be introduced into source water by industrial effluents or atmospheric pollution.
Very low levels may occur naturally, but higher amounts could be associated with industrial pollution. The standards are health related but have a large built-in safety factor.
Very low levels may occur naturally, but higher amounts could be associated with industrial pollution. The standards are health related but have a large built-in safety factor.
Any significant amount of copper is likely to come from corrosion of customers’ pipes or fittings. Excess amounts can cause a metallic taste.
Used to assess the significance of the presence of coliform bacteria in the absence of E.coli or to provide additional information when assessing the extent of possible faecal contamination. They are regarded as secondary indicators of faecal pollution.
Occurs naturally in many water sources. The standard is set to ensure no adverse effects. Jersey Water does not artificially fluoridate the water supplies.
are measured as part of screening for radioactivity.
Absent in water entering supply but variable concentrations of lead may be found in water at the customer’s tap in older properties built at a time when lead was commonly used in domestic plumbing systems. The standard recognises that the intake of lead should be minimised for health reasons.
Appendix 7 - Water Quality in the Supply Zone – Audit Monitoring (continued)
Substances and parameters
Very low levels may occur naturally, but higher amounts could be associated with industrial pollution. The standards are health related but have a large built-in safety factor.
Low levels of selenium may occur naturally in water after it has passed through various mineral deposits and rock strata. Selenium is an essential element and is required as part of the diet.
Sodium occurs naturally in water after passing through certain mineral deposits and rock strata or in brackish groundwater. Sodium salts are used extensively in the home and in industrial processes. Domestic water softeners regenerated with brine produce water containing an increased concentration of sodium. Always use unsoftened mains water for drinking, cooking and for preparing babies’ feeds.
These substances are organic solvents, their presence is an indication of industrial pollution.
THM’s are formed by the reaction of chlorine added as a disinfectant with naturally occurring organic compounds in the water.
Chloride can occur naturally in source water and is a component of common salt. The standard is not health-related, but set to avoid taste and corrosion potential.
Occurs naturally in many source waters after contact with particular mineral deposits and rock strata. The concentrations normally found in drinking water do not represent a risk to health.
This parameter provides a measure of the total amount of organic matter in water.