A N A L Y T I C S
A N D
A R T I F I C I A L
I N T E L L I G E N C E
Clinical dashboard gives Joseph Brant Hospital a quick view of patient flow BY J E R R Y Z E I D E N B E R G
B
URLINGTON, ONT. – Joseph Brant
Hospital has created a computerized, clinical dashboard that informs executives, physicians and staff about patient volume and trends in the emergency department and inpatient floors. The system – which refreshes itself every 10 minutes – has been up and running since the spring of 2018 and has become an important tool for keeping managers informed about potential logjams and where to focus their attention. “The system gives us a quick snapshot, so that people can switch into high-gear, if needed,” said Dr. Joe Cherian, chief of the emergency department. He explained that the computerized tool provides the realtime information that staff can use to make fast decisions about reducing waits in the ED or moving them into beds faster. Thanks to the colour-coded bars and lines – green, yellow and red – managers can quickly determine if there is a problem that needs special attention. “By looking at the graphs, I can see how many people are registering, how many are waiting, and whether we’ll get caught up or if we should call another physician,” said Dr. Cherian. The computerized system can be accessed by managers and staff across the hospital, and was built by a small team in just six months. They used software from Information Builders, and met regularly with various members of the ED, medical staff and executives to find out which metrics were most needed. The vendor also
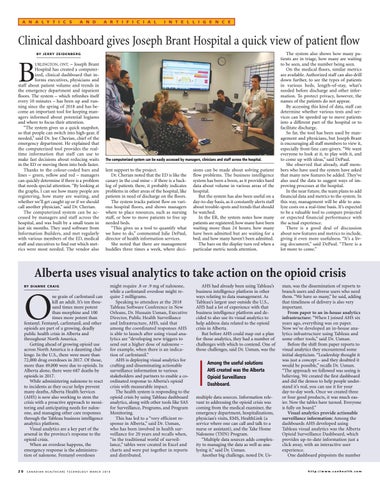
The computerized system can be easily accessed by managers, clinicians and staff across the hospital.
lent support to the project. Dr. Cherian noted that the ED is like the canary in the coal mine – if there is a backlog of patients there, it probably indicates problems in other areas of the hospital, like patients in need of discharge on the floors. The system tracks patient flow on various hospital floors, and shows managers where to place resources, such as nursing staff, or how to move patients to free up needed beds. “This gives us a tool to quantify what we have to do,” commented Julie DePaul, director of health information services. She noted that there are management huddles three times a week, where deci-
sions can be made about solving patient flow problems. The business intelligence system has been a boon, as it provides hard data about volume in various areas of the hospital. But the system has also been useful on a day-to-day basis, as it constantly alerts staff about trouble-spots and trends that should be watched. In the ER, the system notes how many patients are registered; how many have been waiting more than 24 hours; how many have been admitted but are waiting for a bed; and how many haven’t been admitted. The bars on the display turn red when a particular metric needs attention.
The system also shows how many patients are in triage, how many are waiting to be seen, and the number being seen. On the medical floors, similar metrics are available. Authorized staff can also drill down further, to see the types of patients in various beds, length-of-stay, what’s needed before discharge and other information. To protect privacy, however, the names of the patients do not appear. By accessing this kind of data, staff can determine whether various tests and services can be speeded up to move patients into a different part of the hospital or to facilitate discharge. So far, the tool has been used by management and physicians, but Joseph Brant is encouraging all staff members to view it, especially front-line care-givers. “We want everyone to look at it, to play with it, and to come up with ideas,” said DePaul. She observed that already, staff members who have used the system have asked that many new features be added. They’ve also used the data to suggest ways of improving processes at the hospital. In the near future, the team plans to add financial data and metrics to the system. In this way, management will be able to analyze costs on a real-time basis. It’s expected to be a valuable tool to compare projected or expected financial performance with the actual experience. There is a good deal of discussion about new features and metrics to include, giving it even more usefulness. “It’s a living document,” said DePaul. “There is a lot more to come.”
Alberta uses visual analytics to take action on the opioid crisis BY D I A N N E C R A I G
O
ne grain of carfentanil can kill an adult. It’s ten thousand times more potent than morphine and 100 times more potent than fentanyl. Fentanyl, carfentanil, and other opioids are part of a growing, deadly public health crisis in Alberta and throughout North America. Getting ahead of growing opioid use across North America is a daunting challenge. In the U.S., there were more than 72,000 drug overdoses in 2017. Of those, more than 49,000 were due to opioids. In Alberta alone, there were 687 deaths by opioids in 2017. While administering naloxone to react to incidents as they occur helps prevent many deaths, Alberta Health Services (AHS) is now also working to stem the crisis with a proactive approach to monitoring and anticipating needs for naloxone, and managing other care responses through the Tableau business intelligence analytics platform. Visual analytics are a key part of the arsenal in the province’s response to the opioid crisis. When an overdose happens, the emergency response is the administration of naloxone. Fentanyl overdoses
20
might require .8 or .9 mg of naloxone, while a carfentanil overdose might require 2 milligrams. Speaking to attendees at the 2018 Tableau Software Conference in New Orleans, Dr. Hussain Usman, Executive Director, Public Health Surveillance and Infrastructure, AHS, said that among the coordinated responses AHS is able to launch after using visual analytics are “developing new triggers to send out a higher dose of naloxone – for example, when there is an indication of carfentanil.” AHS is deploying visual analytics for crafting and disseminating actionable surveillance information to various stakeholders and partners to enable a coordinated response to Alberta’s opioid crisis with measurable impact. The health system is responding to the opioid crisis by using Tableau dashboard analytics, along with other tools like SAS for Surveillance, Programs, and Program Monitoring. This has led to a “very efficient response in Alberta,” said Dr. Usman, who has been involved in health surveillance for 20 years and recalls when, “in the traditional world of surveillance,” tables were created in Excel and charts and were put together in reports and distributed.
C A N A D I A N H E A LT H C A R E T E C H N O L O G Y M A R C H 2 0 1 9
AHS had already been using Tableau’s business intelligence platform in other ways relating to data management. As Tableau’s largest user outside the U.S., AHS had a lot of experience with that business intelligence platform and decided to also use its visual analytics to help address data related to the opioid crisis in Alberta. But before AHS could map out a plan for those analytics, they had a number of challenges with which to contend. One of those challenges, said Dr. Usman, was the
Among the useful solutions AHS created was the Alberta Opioid Surveillance Dashboard. multiple data sources. Information relevant to addressing the opioid crisis was coming from the medical examiner, the emergency department, hospitalizations, physician’s visits, EMS, HealthLink (a service where one can call and talk to a nurse or assistant), and the Take Home Naloxone (THN) Program. “Multiple data sources adds complexity to managing the data as well as analyzing it,” said Dr. Usman. Another big challenge, noted Dr. Us-
man, was the dissemination of reports to branch users and diverse users who need them. “We have so many,” he said, adding that timeliness of delivery is also very important. From paper to an in-house analytics infrastructure: “When I joined AHS six years ago, everything was on paper. Now we’ve developed an in-house analytics infrastructure using Tableau and some other tools,” said Dr. Usman. Before the shift from paper reports to visual analytics they encountered some initial skepticism. “Leadership thought it was just a concept – and they doubted it would be possible,” recalls Dr. Usman. “The approach we followed was seeing is believing. We created the first dashboard and did the demos to help people understand it’s real, you can use it for your day-to-day work. Once we created three or four good products, it was much easier. Now the tables have turned. Everyone is fully on board.” Visual analytics provide actionable surveillance information: Among the dashboards AHS developed using Tableau visual analytics was the Alberta Opioid Surveillance Dashboard, which provides up-to-date information just a click away, with an interactive user experience. One dashboard pinpoints the number
h t t p : / / w w w. c a n h e a l t h . c o m