Chapter 2: Applications of Differentiation
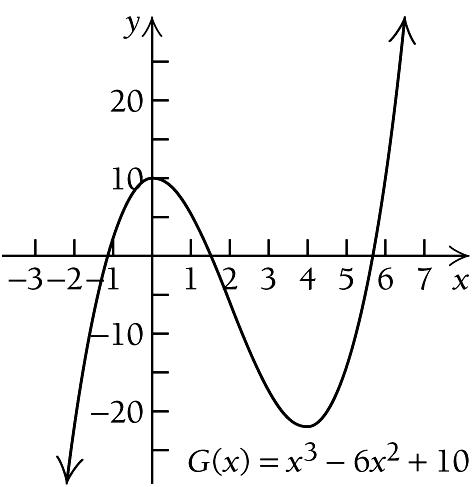
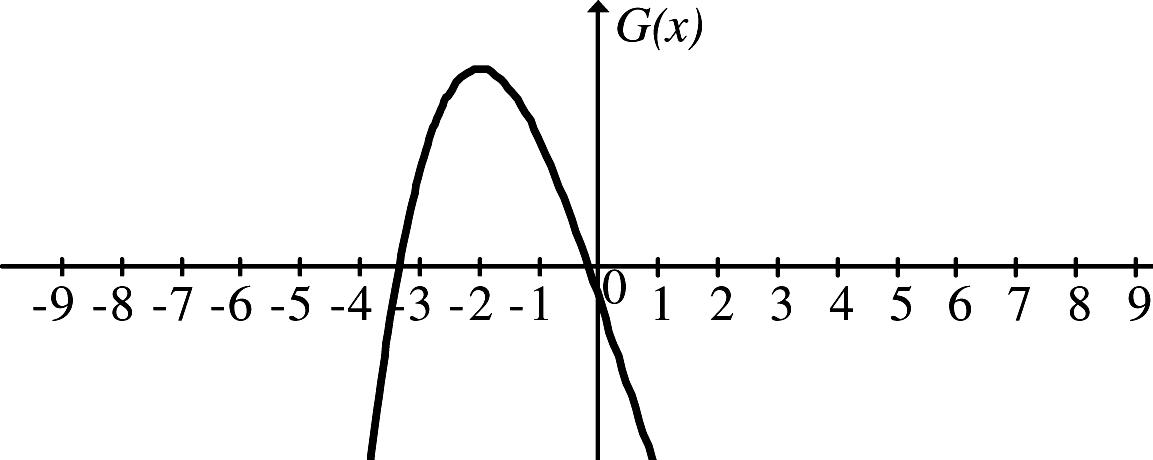
From the previous page, we see that ( ) Gx is increasing on 1 , 3
, decreasing on
The critical values are 2 1 and 3 . We use them to divide the real number line into three intervals,
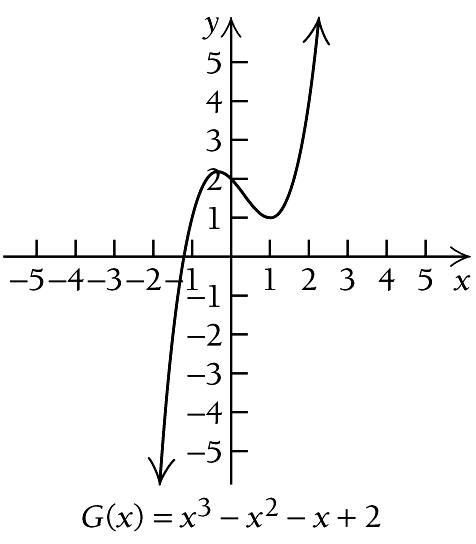
and a relative
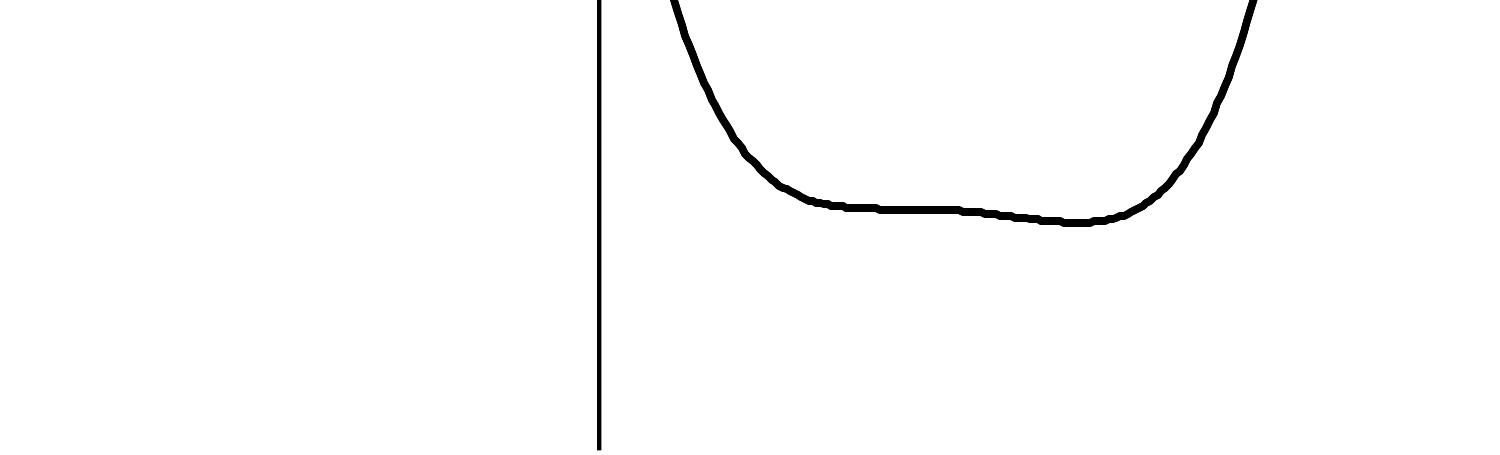
and there is a relative minimum at ( )1,1 . We use the information obtained to sketch the graph. Other function values are listed below.
There is a relative maximum at 13 1, 2
and there is a relative minimum at 2 113 ,
. We use the information obtained to sketch the graph. Other function values are listed below.
216
⎛ ⎞ −∞ ⎜ ⎟ ⎝ ⎠
1 ,1 3 ⎛ ⎞ ⎜ ⎟ ⎝ ⎠ , and increasing
∞
a relative maximum
x =−
minimum at 1 x = We find 1 3 G ⎛ ⎞ ⎜ ⎟ ⎝ ⎠ : 3 2 1 1 1 1 2 3 3 3 3 1 1 1 2 27 9 3 59 27 G ⎛ ⎞ ⎛ ⎞ ⎛ ⎞ ⎛ ⎞ = + ⎜ ⎟ ⎜ ⎟ ⎜ ⎟ ⎜ ⎟ ⎝ ⎠ ⎝ ⎠ ⎝ ⎠ ⎝ ⎠ =− + + = Then we find ( )1 G : () () ( ) () 3 2 1 1 1 1 2 1 1 1 2 1 G = + = + = There
3 27 ⎛ ⎞ ⎜ ⎟ ⎝ ⎠ ,
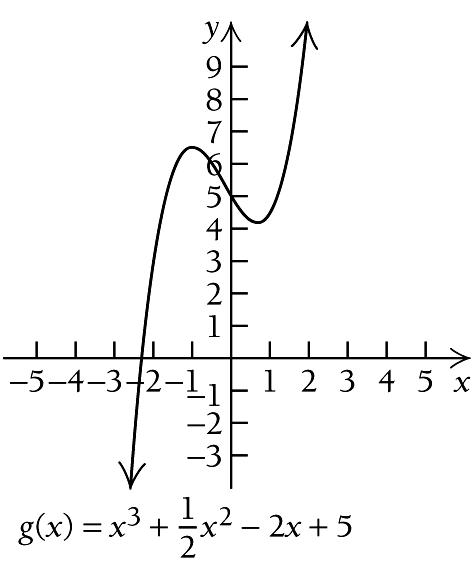
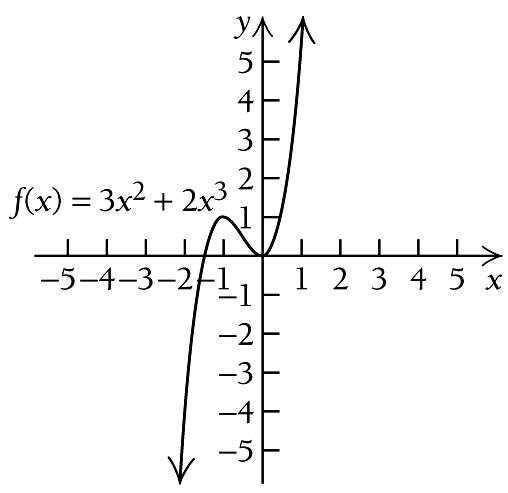
8. ( ) 3 2 1 2 5 2 g x x x x = + + ( ) 2 ' 3 2 g x x x = + ( ) ' g x exists for all real numbers. We solve ( ) ( )( ) 2 ' 0 3 2 0 3 2 1 0 g x x x x x = + = + = 3 2 0 or 1 0 2 or 1 3 x x x x = + = = =
on ( ) 1,
. So there is
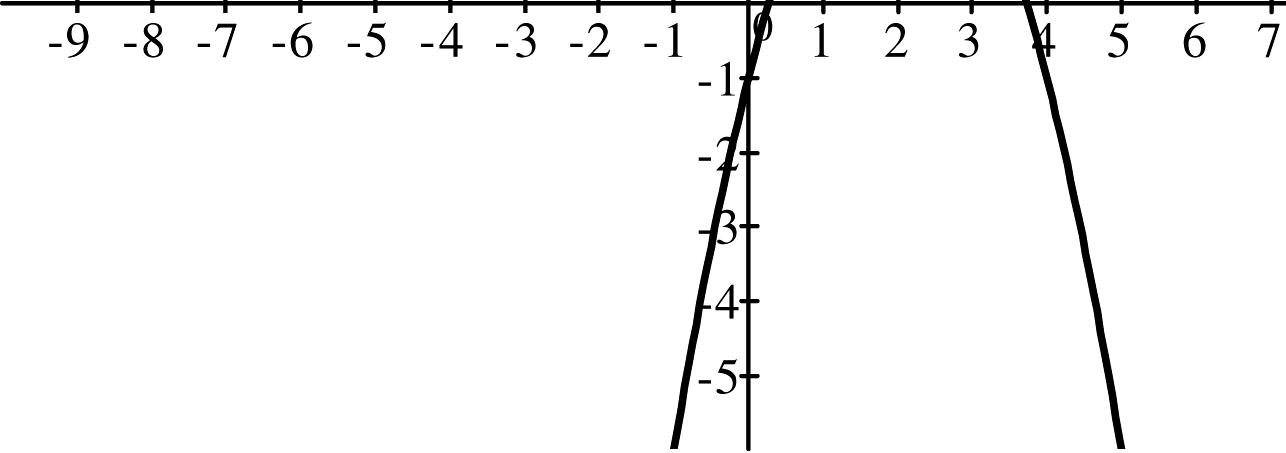
at 1 3
is a relative maximum at 1 59 ,
( ) 2 2 A: , 1 , B: 1, , and C: , 3 3 ⎛ ⎞ ⎛ ⎞ −∞ ∞ ⎜ ⎟ ⎜ ⎟ ⎝ ⎠ ⎝ ⎠ ( ) ( ) ( ) ( ) () () () ( ) ( ) 2 2 2 A: Test 2, ' 2 3 2 2 2 8 0 B: Test 0, ' 0 3 0 0 2 2 0 C: Test 1, ' 1 3 1 1 2 2 0 g g g = + = > = + = < = + = > We see that ( ) g x is increasing on ( ) , 1 −∞ , decreasing
2 1, 3 ⎛ ⎞ ⎜ ⎟ ⎝ ⎠ , and increasing on 2 , 3 ⎛ ⎞ ∞ ⎜ ⎟ ⎝ ⎠ . So there is a relative maximum at 1 x =− and a relative minimum at 2 3 x = ( ) ( ) ( ) ( ) 3 2 1 13 1 1 1 2 1 5 2 2 g = + + = 3 2 2 2 1 2 2 113 2 5 3 3 2 3 3 27 g ⎛ ⎞ ⎛ ⎞ ⎛ ⎞ ⎛ ⎞ = + + = ⎜ ⎟ ⎜ ⎟ ⎜ ⎟ ⎜ ⎟ ⎝ ⎠ ⎝ ⎠ ⎝ ⎠ ⎝ ⎠
on
⎛ ⎞ ⎜ ⎟ ⎝ ⎠ ,
⎛ ⎞ ⎜ ⎟ ⎝ ⎠
x ( ) Gx 2 8 1 1 0 2 2 4 3 17 x ( ) g x 2 3 0 5 1 9 2 2 11
3 27
First, find the critical points.
x exists for all real numbers. We solve
The critical values are 1 and 1 . We use them to divide the real number line into three intervals,
The critical values are 0 and 2 . We use them to divide the real number line into three intervals, (
We use a test value in each interval to determine the sign of the derivative in each interval.
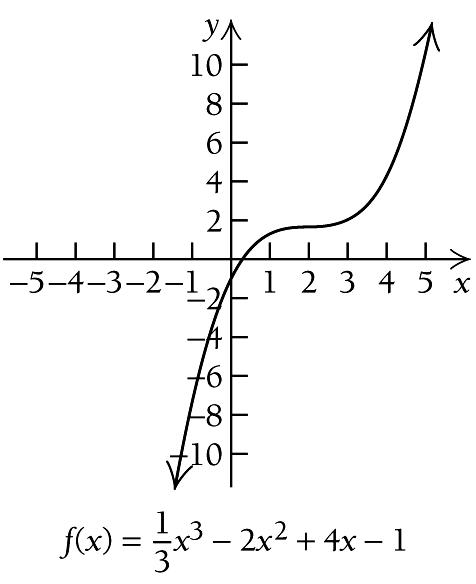
We see that ( ) f x is increasing on ( ) , 1 −∞ , decreasing on ( )1,1 , and increasing on ( ) 1, ∞ .
So there is a relative maximum at 1 x =− and a relative minimum at 1 x = .
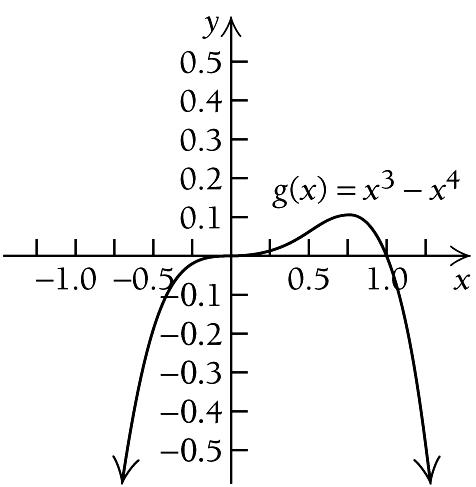
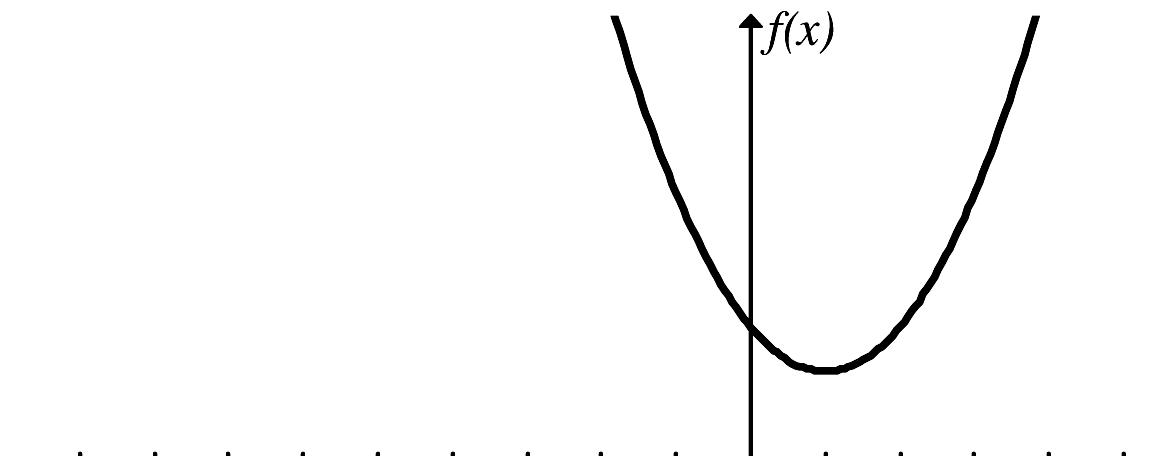
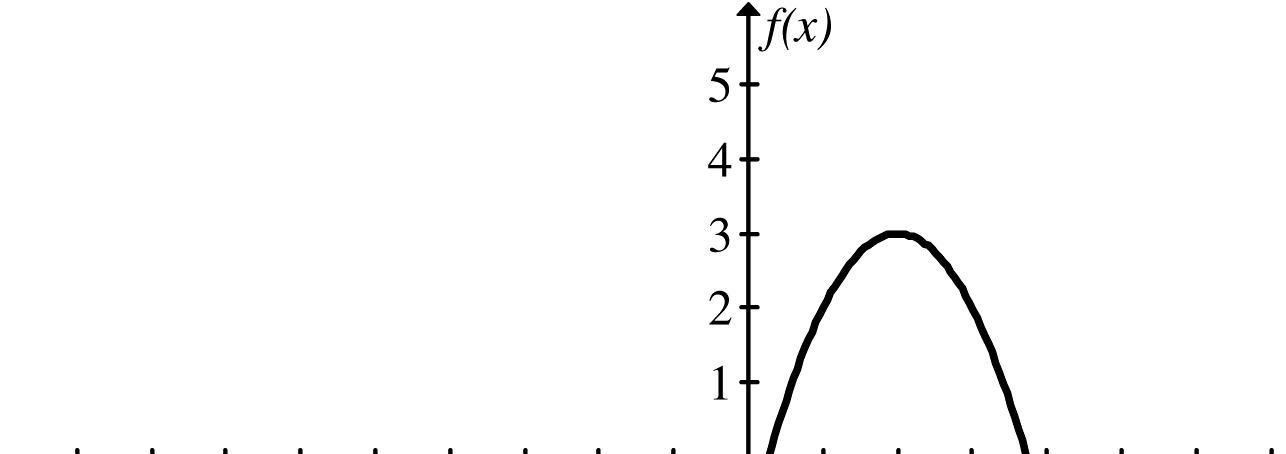
We see that ( ) f x is increasing on ( ) ,0−∞ , decreasing on ( )0,2 , and increasing on ( ) 2, ∞ So there is a relative maximum at 0 x = and a relative minimum
There is a relative maximum at ( ) 0,0 , and there is a relative minimum at ( ) 2, 4 . We use the information obtained to sketch the graph. Other function values are listed below.
There is a relative maximum at ( )1,8 , and there is a relative minimum at ( )1,4 . We use the information obtained to sketch the graph. Other function values are listed below.
First, find the critical points.
Exercise Set 2.1 217
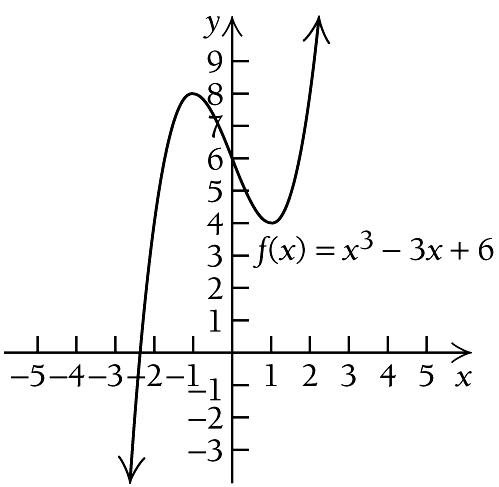
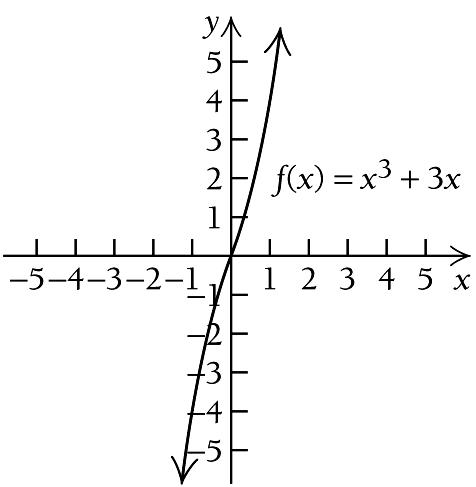
9. ( ) 3 3 6 f x x x = +
(
= ( ) '
( ) 2 ' 0 3 3 0 f x x = = 2 2 3 3 1 1 x x x = = =±
) 2 ' 3 3 f x x
f
( ) (
(
A: , 1 , B:
−∞ ∞
)
)
1,1 , and C: 1, .
( ) ( ) () () ( ) ( ) 2 2 2 A: Test 3, ' 3 3 3 3 24 0 B: Test 0, ' 0 3 0 3 3 0 C: Test 2, ' 2 3 2 3 9 0 f f f = = > = = < = = >
We find ( )1 f : ( ) ( ) ( ) 3 1 1 3 1 6 1 3 6 8 f = + = + + =
we
( )1 f : () () () 3 1 1 3 1 6 1 3 6 4 f = + = + =
Then
find
10. ( ) 3 2 3 f x x x = ( ) 2 ' 3 6 f x x x = ( ) ' f x exists for all
numbers. We solve ( ) ( ) 2 ' 0 3 6 0 3 2 0 f x x x xx = = = 0 or 2 x x = =
real
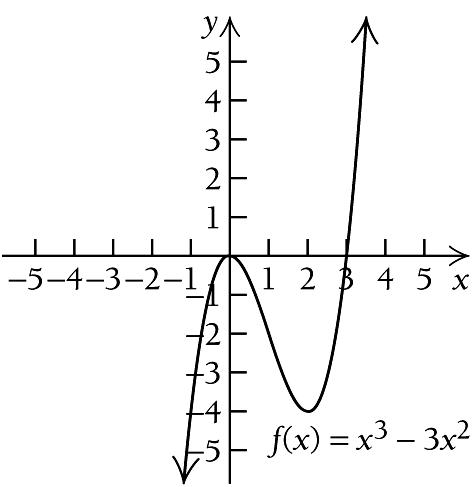
) (
(
A:
2, −∞ ∞ ( ) ( ) ( ) ( ) () () () () () 2 2 2 A: Test 1, ' 1 3 1 6 1 9 0 B: Test 1, ' 1 3 1 6 1 3 0 C: Test 3, ' 3 3 3 6 3 9 0 f f f = = > = = < = = >
)
)
,0 , B: 0,2 , and C:
at 2 x = . ( ) ( ) ( ) 3 2 0 0 3 0 0 f = = ( ) ( ) ( ) 3 2 2 2 3 2 4 f = =
( ) 2 3 3 2 f x x x = +
11.
( ) 2 ' 6 6 f x x x = + ( ) ' f x exists
( ) ( ) 2 ' 0 6 6 0 6 1 0 f x x x x x = + = + = 6 0 or 1 0 0 or 1 x x x x = + = = =
solution is continued
page. x ( ) f x 3 12 2 4 0 6 2 8 3 24 x ( ) f x 2 20 1 4 1 2 3 0 4 16 A B 1 C 1
for all real numbers. We solve
The
on the next
From the previous page, we know the critical values are 1 and 0 . We use them to divide the real number line into three intervals,
There are no real solutions to this equation. Therefore, the function does not have any critical values. We test a point
() ( )2 '0 3 0 3 3 0 f = + = >
We use a test value in each interval to determine the sign of the derivative in each interval.
We see that ( ) f x is increasing on ( ) , −∞ ∞ , and that there are no relative extrema. We use the information obtained to sketch the graph. Other function values are listed below.
We see that ( ) f x is increasing on ( ) , 1 −∞ , decreasing on ( ) 1,0 , and increasing on ( ) 0, ∞
So there is a relative maximum at 1 x =− and a relative minimum at 0 x = .
Then we find ( )
There is a relative maximum at ( )1,1 , and there is a relative minimum at ( ) 0,0 . We use the information obtained to sketch the graph. Other function values are listed below.
13. ( ) 3 2 16 g x x =
First, find the critical points.
exists for all real numbers. We solve
The only critical value is 0 . We use 0 to divide the real number line into two intervals,
,0 , and B: 0, −∞ ∞
We use a test value in each interval to determine the sign of the derivative in each interval. ( ) ( ) () () 2 2
A: Test 1, ' 1 6 1 6 0
B: Test 1, g ' 1 6 1 6 0 g = = > = = >
We see that ( ) g x is increasing on ( ) ,0−∞ and increasing on ( ) 0, ∞ , so the function has no relative extema. We use the information obtained to sketch the graph. Other function values are listed below.
218
Chapter 2: Applications of Differentiation
( ) ( ) ( ) A: , 1 , B: 1,0 , and C:
. −∞ ∞
0,
( ) ( ) ( ) () () ( ) 2 2 2 1 1 1 3 ' 6 6 0 2 2 2 2 A: Test 2, ' 2 6 2 6 2 12 0 1 B: Test , 2 C: Test 1, ' 1 61 61 12 0 f f f = + = < = + = > ⎛ ⎞ ⎛ ⎞ ⎛ ⎞ ⎜ ⎟ ⎜ ⎟ ⎜ ⎟ ⎝ ⎠ ⎝ ⎠ ⎝ ⎠ = + = >
We
( )1 f : ( ) ( ) ( ) 2 3 1 3 1 2 1 1 f = + =
find
f
( ) ( ) ( ) 2 3 0 3 0 2 0 0 f
0
:
= + =
12. ( ) 3 3 f x x x = + ( ) 2 ' 3 3 f x x = + ( ) ' f x exists for all real numbers. We solve ( ) 2 2 ' 0 3 3 0 1 f x x x = + = =−
( ) 2 ' 6 g x x = ( ) ' g x
( ) 2 ' 0 6 0 0 g x x x = = =
A:
( ) ( )
x ( ) f x 3 27 2 4 1 2 1 2 28 x ( ) f x 2 14 1 4 0 0 1 4 2 14 x ( ) g x 2 32 1 18 0 16 1 14 2 0 3 38 A B 0 A B 1 C 0
14.
First, find the critical points.
x exists for all real numbers. We solve
The only critical value is 0 . We use 0 to divide the real number line into two intervals,
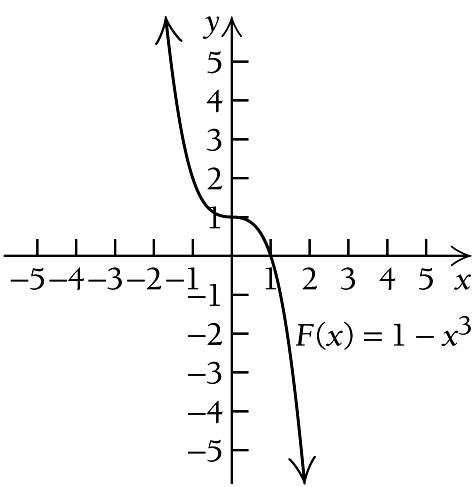
We see that ( ) F x is decreasing on ( ) ,0−∞ and decreasing on ( ) 0, ∞ , so the function has no relative extema. We use the information obtained to sketch the graph. Other function values are listed below.
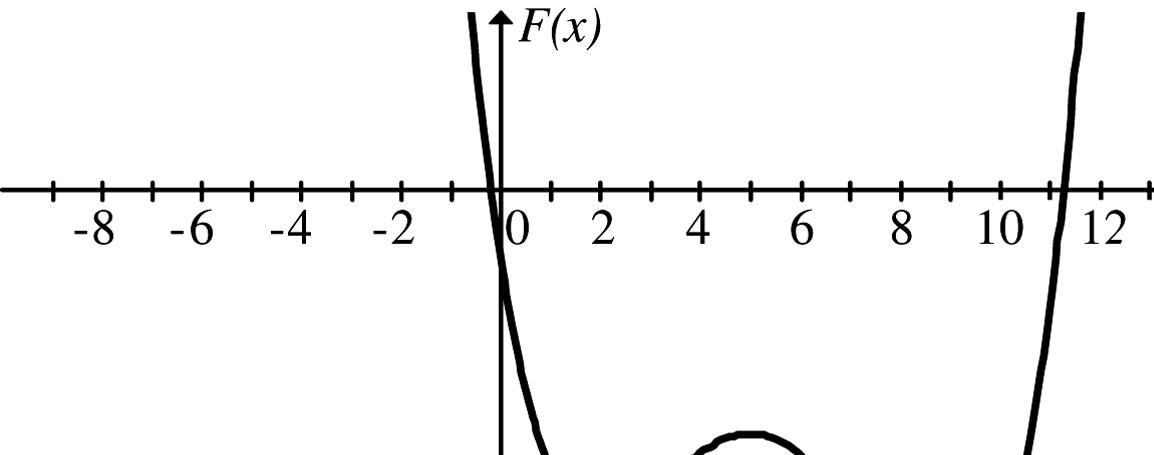
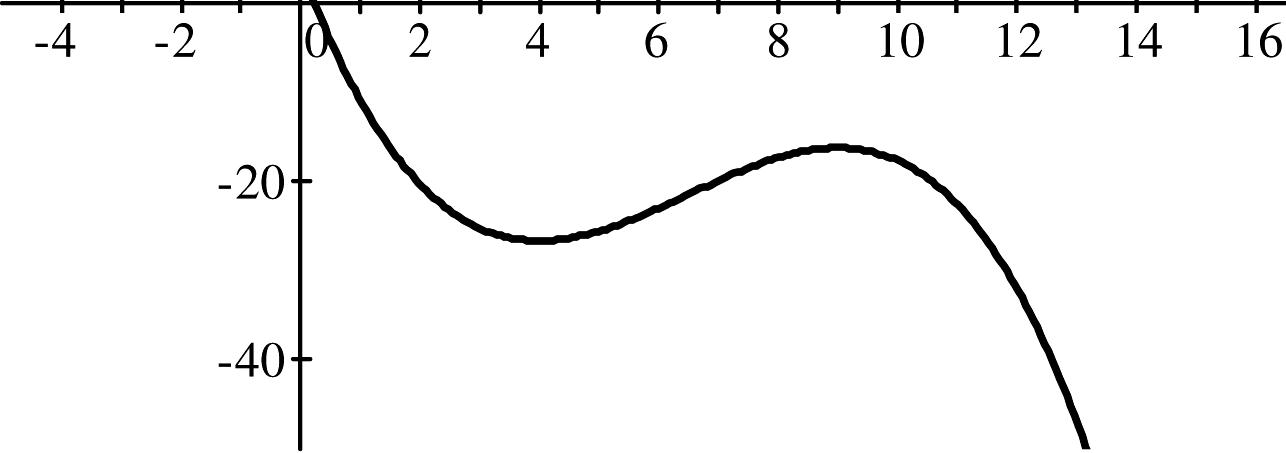
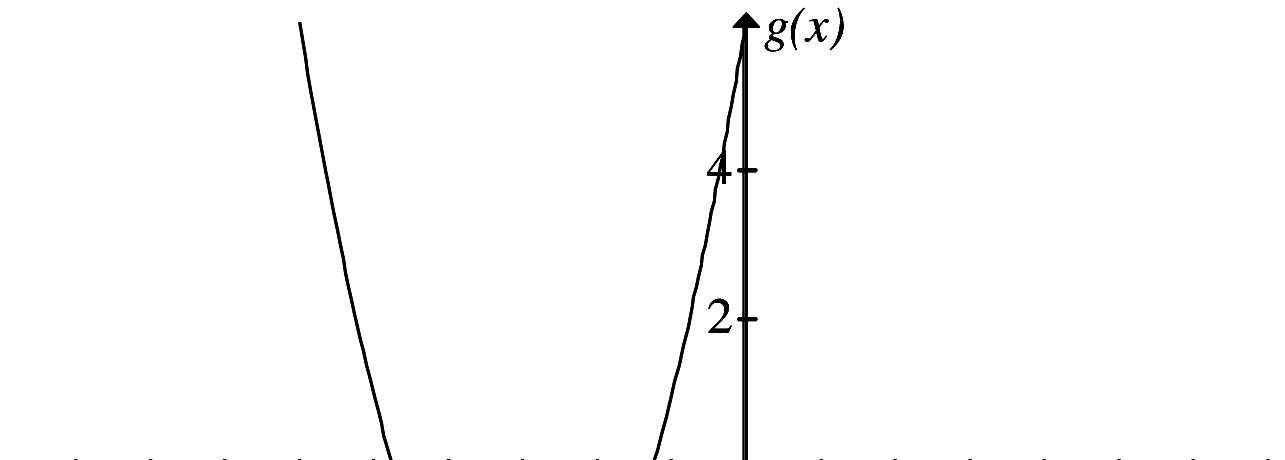
We see that ( ) Gx is increasing on ( ) ,0−∞ , decreasing on ( )0,4 , and increasing on ( ) 4, ∞ . So there is a relative maximum at 0 x = and a relative minimum at 4 x = We find
Then we find
There is a relative maximum at ( )0,10 , and there is a relative minimum at ( ) 4, 22 . We use the information obtained to sketch the graph. Other function values are listed below.
15. ( ) 3
First, find the critical points.
exists for all real numbers. We solve
The critical values are 0 and 4 . We use them to divide the real number line into three intervals,
, and
We use a test value in each interval to determine the sign of the derivative in each interval.
use them to divide the real number line into three intervals,
next page, we use a test value in each interval to determine the sign of the derivative in each interval.
On
Exercise Set 2.1 219
( ) 3 1 F x x =
) 2 '
F
x =− ( )
F
( ) ' 0 F x = 2 3 0 0 x x = =
(
3
x
'
( )
A:
and B:
−∞ ∞ ( ) ( ) () ( ) 2 2 A: Test 1, ' 1 3 1 3 0 B: Test 1, F' 1 3 1 3 0 F = = < =− =− <
( )
,0 ,
0, .
2
6 10 G x x x = +
( ) 2 ' 3
G x x x = ( ) ' G x
( ) ( ) 2 ' 0 4 0 Dividing by 3 4 0 G x x x x x = = = 0 or 4 0 0 or 4 x x x x = = = =
12
( )
A: ,0
B: 0,4
C:
−∞ ∞
( ) ( )
,
4,
( ) ( ) ( ) () () ( ) () ( ) () 2 2 2 A: Test 1, ' 1 3 1 12 1 15 0 B: Test 1, ' 1 3 1 12 1 9 0 C: Test 5, ' 5 3 5 12 5 15 0 G G G = = > = = < = = >
( )0 G : () ( ) () 3 2 0 0 6 0 10 10 G = + =
( )4 G : ( ) ( ) ( ) 3 2 4 4 6 4 10 64 96 10 22 G = + = + =−
16. ( ) 2 3 12 9 3 f x x x x = + ( ) 2 ' 9 6 3 f x x x = ( ) ' f x exists for all real numbers. Solve ( ) ( )( ) 2 2 ' 0 9 6 3 0 2 3 0 Dividing by 3 3 1 0 f x x x x x x x = = + = + = 3 0 or 1 0 3 or 1 x x x x + = = =− =
critical
3 and 1 . We
( ) ( ) ( ) A: , 3 , B:
, and C: 1, . −∞ ∞
x ( ) F x 2 9 1 2 0 1 1 0 2 7 x ( ) Gx 2 22 1 3 1 5 2 6 3 17 A B 0 C 4
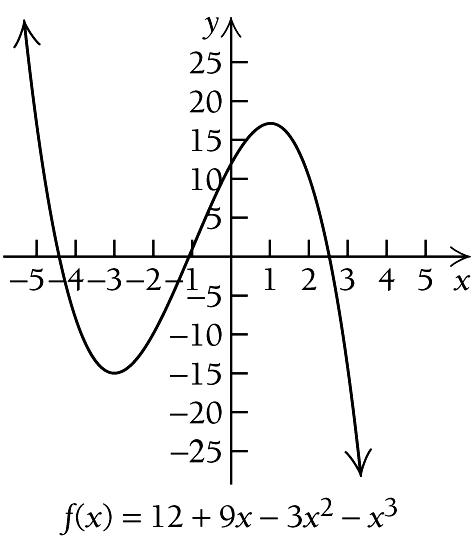
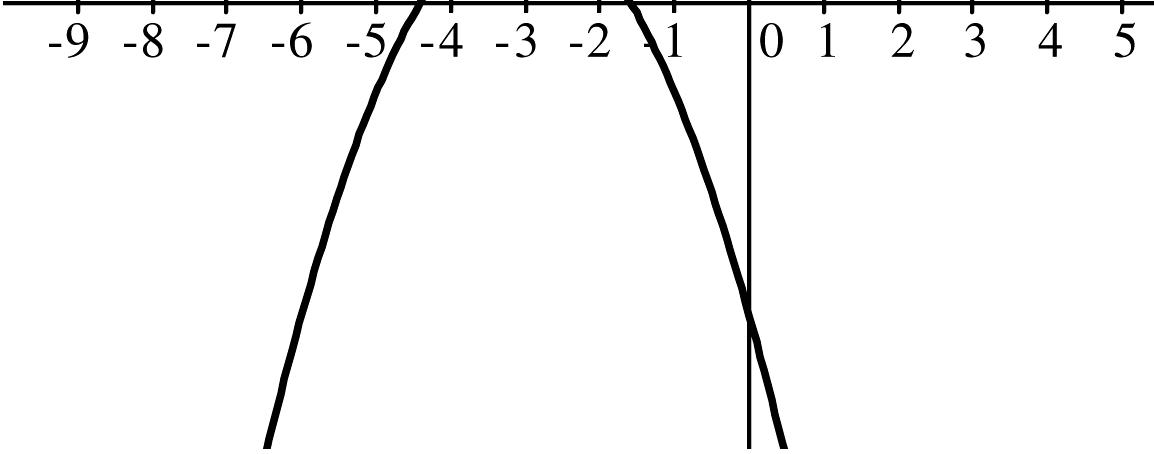
The
values are
3,1
the
There is a relative minimum at ( ) 3, 15 , and there is a relative maximum at ( ) 1,17 . We use the information obtained to sketch the graph. Other function values are listed below.
We use the critical values to divide the real number line into three intervals,
We use a test value in each interval to determine the sign of the derivative in each interval.
First, find the critical points.
There is a relative maximum at
. We use the information obtained to sketch the graph. Other function values are listed below.
220
( ) ( ) ( ) ( ) ( ) ( ) ( ) ( ) ( ) 2 2 2 ' 4 9 6 4 3 4 15 0 A: Test 4, B: Test 0, ' 0 9 6 0 3 0 9 0 C: Test 2, ' 2 9 6 2 3 2 15 0 f f f = = < = = > = = < We see that ( ) f x is decreasing
( ) , 3 −∞ , increasing on ( )3,1
and
1, ∞ . So there is a relative minimum
x =− and a relative maximum at 1 x = . ( ) ( ) ( ) ( ) 2 3 3 12 9 3 3 3 3 15 f = + = () () () () 2 3 1 12 9 1 3 1 1 17 f = + =
Chapter 2: Applications of Differentiation
on
,
increasing on ( )
at 3
17. ( ) 3 4 g x x x =
( ) 2 3 ' 3 4 g x x x = ( ) ' g x exists for
( ) ( ) 2 3 2 ' 0 3 4 0 3 4 0 g x x x x x = = = 2 0 or 3 4 0 0 or 4 3 3 0 or 4 x x x x x x = = = = = = The critical values are 3 0 and 4
all real numbers. We solve
( ) 3 3 A: ,0 , B: 0, , and C: , 4 4 ⎛ ⎞ ⎛ ⎞ −∞ ∞ ⎜ ⎟ ⎜ ⎟ ⎝ ⎠ ⎝ ⎠
( ) ( ) ( ) 2 3 2 3 A: Test 1, ' 1 3 1 4 1 7 0 1 1 1 1 B: Test , g ' 3 4 2 2 2 2 1 1 1 3 4 0 4 8 4 g = = > ⎛ ⎞ ⎛ ⎞ ⎛ ⎞ = ⎜ ⎟ ⎜ ⎟ ⎜ ⎟ ⎝ ⎠ ⎝ ⎠ ⎝ ⎠ ⎛ ⎞ ⎛ ⎞ = = > ⎜ ⎟ ⎜ ⎟ ⎝ ⎠ ⎝ ⎠ () ( ) () 2 3 C: Test 1, g' 1 3 1 4 1 1 0 = = < We see that ( ) g x is
on ( ) ,0−∞ and 3 0, 4 ⎛ ⎞ ⎜ ⎟ ⎝ ⎠ , and is decreasing on 3 , 4 ⎛ ⎞ ∞ ⎜ ⎟ ⎝ ⎠ . So there is no relative extrema at 0 x = but there is a relative maximum at 3 4 x = . We find 3 4 g ⎛ ⎞ ⎜ ⎟ ⎝ ⎠ : 3 4 3 3 3 27 81 27 4 4 4 64 256 256 g ⎛ ⎞ ⎛ ⎞ ⎛ ⎞ = = = ⎜ ⎟ ⎜ ⎟ ⎜ ⎟ ⎝ ⎠ ⎝ ⎠ ⎝ ⎠
increasing
3 27
256 ⎛ ⎞ ⎜ ⎟ ⎝ ⎠
x ( ) f x 5 17 4 8 2 10 1 1 0 12 2 10 3 15 x ( ) g x 2 24 1 2 0 0 1 2 1 16 1 0 2 8 A B 0 C 3 4
, 4
19. ( ) 3 2 1 2 4 1 3 f x x x x = + First, find the critical points.
all real numbers. We solve
The critical values are
0 and
. We use them to divide the real number line into three intervals,
We divide the real number line into two intervals,
Since
x is decreasing on both
, there is no relative extrema at 0 x = but there is a relative
We use a test value in each interval to determine the sign of the derivative in each interval.
We see that ( ) f x is increasing on both ( ) ,2−∞ and ( ) 2, ∞ . Therefore, there are no relative extrema.
We use the information obtained to sketch the graph. Other function values are listed below.
27 ,
There is a relative minimum at
16
. We use the information obtained to sketch the graph. Other function values are listed below.
Exercise Set 2.1 221
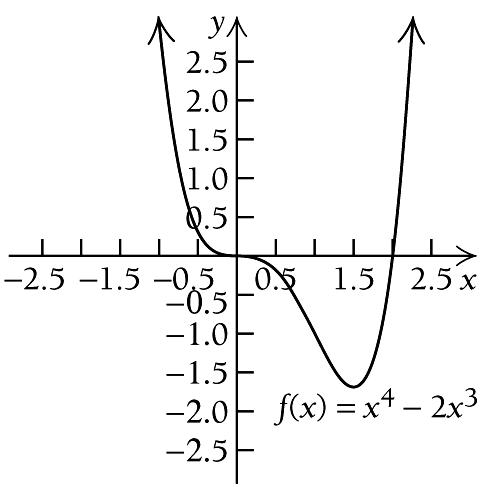
( ) 4 3 2 f x x x = ( ) 3 2 ' 4 6 f x x x = ( ) ' f x
numbers. Solve ( ) ( ) 3 2 2 ' 0 4 6 0 2 2 3 0 f x x x x x = = = 2 0 or 2 3 0 3 0 or 2 x x x x = = = =
18.
exists for all real
3
2
( ) 3 3 A: ,0 , B: 0, , and C: , . 2 2 ⎛ ⎞ ⎛ ⎞ −∞ ∞ ⎜ ⎟ ⎜ ⎟ ⎝ ⎠ ⎝ ⎠ ( ) ( ) ( ) () () ( ) ( ) ( ) ( ) 3 2 3 2 3 2 ' 1 10 0 A: Test 1, 4 1 6 1 B: Test 1, ' 1 4 1 6 1 2 0 C: Test 2, ' 2 4 2 6 2 8 0 f f f = < = = = < = = >
( )
( ) ,0−∞ and 3 0, 2 ⎛ ⎞ ⎜ ⎟ ⎝ ⎠ ,
3 , 2 ⎛ ⎞ ∞ ⎜ ⎟ ⎝ ⎠
minimum at 3 2 x = 4 3 3 3 3 27 2 2 2 2 16 f ⎛ ⎞ ⎛ ⎞ ⎛ ⎞ = = ⎜ ⎟ ⎜ ⎟ ⎜ ⎟ ⎝ ⎠ ⎝ ⎠ ⎝ ⎠
f
and increasing on
⎛ ⎞ ⎜ ⎟ ⎝ ⎠
3
2
( ) 2
4 4
x x x =
( ) ' f x exists
( ) ( ) 2 2 ' 0 4 4 0 2 0 2 0 2 f x x x x x x = + = = = = The only critical value is 2
'
f
+
for
( ) ( ) A:
B: 2, −∞ ∞
,2 and
() ( ) () ( ) () () 2 2 A: Test 0, ' 0 0 4 0 4 4 0 B: Test 3, ' 3 3 4 3 4 1 0 f f = + = > = + = >
x ( ) f x 2 32 1 3 0 0 1 1 2 0 3 27 x ( ) f x 3 40 2 59 3 1 22 3 0 1 1 4 3 2 5 3 3 2 B 2 A
The only critical value is 3 . We divide the real number line into two intervals,
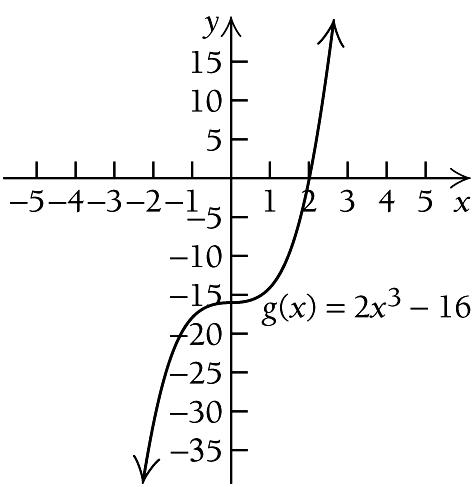
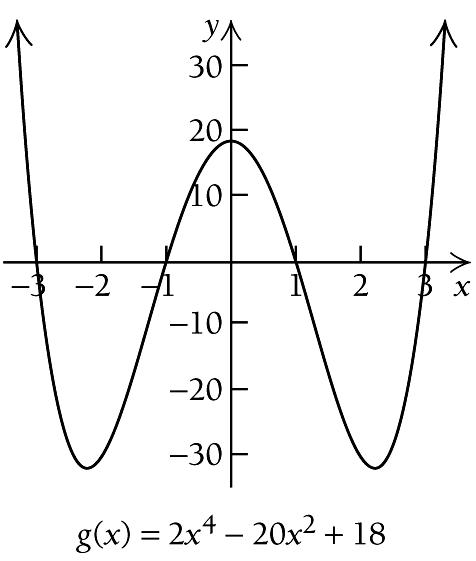
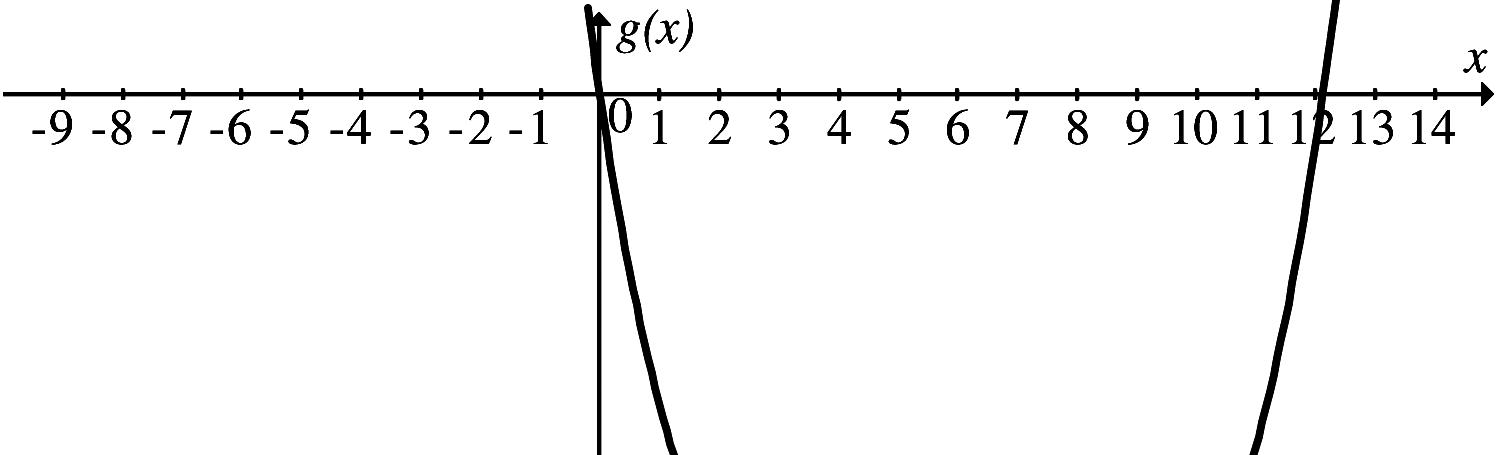
21. ( ) 4 2 2 20 18 g x x x = +
First, find the critical points.
( ) 3 ' 8 40 g x x x = ( ) ' g x exists for all real numbers. We solve
2 2 8 0 or 5 0 0 or 5 0 or 5
x x x x x x
= = = = = = ±
We use a test value in each interval to determine the sign of the derivative in each interval.
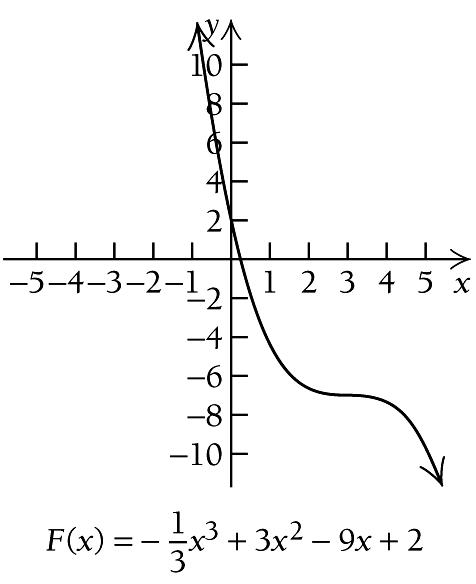
We see that ( ) F x is decreasing on both ( ),3−∞ and ( ) 3, ∞ . Therefore, there are no relative extrmea.
We use the information obtained to sketch the graph. Other function values are listed below.
The critical values are 0, 5 and 5 . We use them to divide the real number line into four intervals, ( ) ( ) ( ) ( )
C: 0, 5 , and D: 5,
−∞ ∞
A: , 5 , B: 5,0 ,
We use a test value in each interval to determine the sign of the derivative in each interval.
We see that ( ) g x is decreasing on ( ) , 5 −∞ , increasing on ( ) 5,0 , decreasing again on ( ) 0, 5 , and increasing again on ( ) 5, ∞ .
Thus, there is a relative minimum at 5 x =− , a relative maximum at 0 x = , and another relative minimum at 5 x =
We find ( ) 5 g :
The solution is continued on the next page.
222
Differentiation
3 2 1
=− + + ( ) 2 ' 6
F x x x =− + ( ) ' F x exists
( ) ( ) 2 2 2 ' 0 6 9 0 6 9 0 3 0 3 0 3 F x x x x x x x x = + = + = = = =
Chapter 2: Applications of
20. ( )
3 9 2 3 F x x x x
9
for all real numbers. Solve
( ) (
A:
and B:
−∞ ∞
)
,3
3, .
() ( ) () ( ) ( ) ( ) 2 2 A: Test 0, ' 0 0 6 0
0 B: Test 4, ' 4 4 6 4
1 0 F F =− + =− < =− + =− <
9 9
9
( ) ( ) 3 2 ' 0 8 40
8 5 0 g x x x xx = = =
0
(
( ) ( ) ( ) () ( ) () () () () 3 3 3 3 A: Test 3, ' 3 8 3 40 3 96 0 B: Test 1, ' 1 8 1 40 1 32 0 C: Test 1, g ' 1 8 1 40 1 32 0 D: Test 3, ' 3 8 3 40 3 96 0 g g g = = < = = > = = < = = >
) ( ) ( )
( ) ( ) ( ) 4 2 5 2 5 20 5 18 32 g
= + =
x ( ) F x 3 65 2 104 3 1 43 3 0 2 1 13 3 2 20 3 3 7 A B 0 C 5 D 5 B 3 A
Then we find ( ) 0 g :
find
There are relative minima at ( ) 5, 32 and (
5, 32 . There is a relative maximum at ( )0,18 We use the information obtained to sketch the graph. Other function values are listed below.
C: Test 1,
D: Test 2,
We see that ( ) f x is decreasing on 10
increasing
decreasing again on 10 0, 2
, and increasing again on 10 ,
Thus, there is a relative minimum at 10 2 x =− , a relative maximum at 0 x = , and another relative minimum at
The critical values are 10 10 0, and 2 2 . We use them to divide the real number line into four intervals,
There is a relative maximum at ( ) 0,12 .
The solution is continued on the next page.
We use a test value in each interval to determine the sign of the derivative in each interval.
Exercise Set 2.1 223
() ( ) () 4 2 0
g =
( ) 5 g ( ) ( ) ( ) 4 2 5 2 5
g = + =
2 0 20 0 18 18
+ = Then we
20 5 18 32
22. ( ) 4 2 3 15 12 f x x x = + ( ) 3 ' 12 30 f x x x = ( ) ' f x exists for all real numbers. We solve ( ) ( ) 3 2 ' 0 12 30 0 6 2 5 0 f x x x x x = = = 2 2 6 0 or 2 5 0 5 0 or 2 10 0 or 2 x x x x x x = = = = = = ±
)
10
A: , , B: ,0 , 2 2 10
C: 0, , and D: , 2 2 ⎛ ⎞ ⎛ ⎞ −∞ ⎜ ⎟ ⎜ ⎟ ⎝ ⎠ ⎝ ⎠ ⎛ ⎞ ⎛ ⎞ ∞ ⎜ ⎟ ⎜ ⎟ ⎝ ⎠ ⎝ ⎠
10
10
( ) ( ) ( ) ( ) ( ) ( ) () ( ) () ( ) ( ) ( ) 3 3 3 3
Test 2, ' 2 12 2 30 2 36 0
' 1
1 30 1 18 0
A:
B: Test 1,
12
'
1
0
1 12 1 30
18
'
2 30 2 36 0 f f f f = = < = = > = = < = = >
2 12
2 ⎛ ⎞ −∞ ⎜ ⎟ ⎝ ⎠
2 ⎛ ⎞ ⎜ ⎟ ⎝ ⎠ ,
⎛ ⎞ ⎜ ⎟ ⎝ ⎠
⎛ ⎞ ∞ ⎜ ⎟ ⎝ ⎠
10 2 x = 4 2 10 10 10 3 15 12 2 2 2 27 4 f ⎛ ⎞ ⎛ ⎞ ⎛ ⎞ = + ⎜ ⎟ ⎜ ⎟ ⎜ ⎟ ⎝ ⎠ ⎝ ⎠ ⎝ ⎠ =− () () () 4 2 0 3 0 15 0 12 12 f = + = 4 2 10 10 10 3 15 12 2 2 2 27 4 f ⎛ ⎞ ⎛ ⎞ ⎛ ⎞ = + ⎜ ⎟ ⎜ ⎟ ⎜ ⎟ ⎝ ⎠ ⎝ ⎠ ⎝ ⎠ =−
,
,
on 10 ,0
2
.
2 4 ⎛ ⎞ ⎜ ⎟ ⎝ ⎠ and 10
2 4 ⎛ ⎞ ⎜ ⎟ ⎝ ⎠ .
There are relative minima at 10 27 ,
27 ,
x ( ) g x 4 210 3 0 1 0 1 0 3 0 4 210
We use the information obtained on the previous page to sketch the graph. Other function values are listed below.
24. ( ) ( )
3 3 2 2 Gx x x = + =
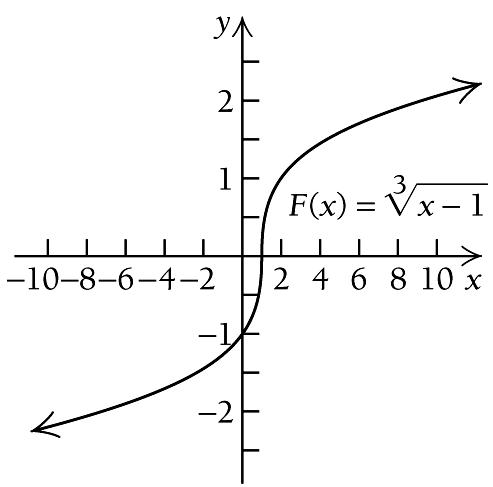
23. ( ) ( ) 1 3 3 1 1 F x x x = = First, find the critical points.
does not exist when
x = has no solution, therefore, the only critical value is
We use 2 to divide the real number line into two intervals,
, which means that ( ) ' F x does not exist when 1 x = . The equation ( ) ' 0 F x = has no solution, therefore, the only critical value is 1
We use 1 to divide the real number line into two intervals,
) ( ) A: ,1 and B: 1, : −∞ ∞
We use a test value in each interval to determine the sign of the derivative in each interval.
We see that ( ) Gx is increasing on both ( ) , 2 −∞ and ( ) 2, ∞ . Thus, there are no relative extrema for ( ) Gx
We use the information obtained to sketch the graph. Other function values are listed below.
We see that ( ) F x is increasing on both ( ),1−∞ and ( ) 1, ∞ . Thus, there are no relative extrema for ( ) F x . We use the information obtained to sketch the graph. Other function values are listed.
224
Chapter 2: Applications of Differentiation
( ) ( ) () ( ) 2 3 2 3 1 ' 1 1 3 1 3 1 F x x x = = ( ) ' ( F x does not exist when 3 ) 2 3 1 0
=
x
x = .
(
() ( ) ( ) ( ) 2 3 2 3 1 1 A: Test 0,
3 30 1 1 1 B: Test 2, ' 2 0 3 32 1 F F = =
= = >
' 0 0
>
+ ( ) ( ) () ( ) 2 3 2 3 1 ' 2 1 3 1 3 2 G x x x = + = + ( ) ' G
2
( )
0
1
x
x =− . The equation
'
G
2 x =− .
( ) ( ) A: , 2
B: 2, : −∞ ∞ ( ) ( ) ( ) ( ) 2 3 2 3 1 1 A: Test 3, ' 3 0 3 3 3 2 1 1 B: Test 1, ' 1 0 3 3 1 2 G G = = > + = = > +
and
x ( ) f x 3 120 2 0 1 0 1 0 2 0 3 120 x ( ) F x 7 2 0 1 1 0 2 1 9 2 x ( ) Gx 10 2 3 1 2 0 1 1 6 2 B 1 A
First, find the critical points.
3 0 x = , which means that ( ) ' f x does not exist when 0 x = . The equation ( ) ' 0 f x = has no solution, therefore, the only critical value is
We use 0 to divide the real number line into two intervals,
We use a test value in each interval to determine the sign of the derivative in each interval.
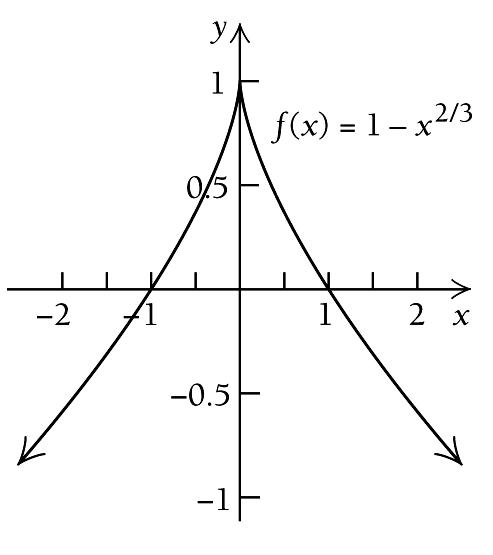
We see that ( ) f x is increasing on ( ) ,0−∞ and decreasing on ( ) 0, ∞ . Thus, there is a relative maximum at
Therefore, there is a relative maximum at ( )0,1 . We use the information obtained to sketch the graph. Other function values are listed below.
does not exist when
. The equation ( ) ' 0 f x = has no solution, therefore, the only critical value is
We use 3 to divide the real number line into two intervals, ( ) ( ) A: , 3 and B: 3, :
We see that ( ) f x is decreasing on ( ) , 3 −∞ and increasing on ( ) 3, ∞ . Thus, there is a relative minimum at
We use the information obtained to sketch the graph. Other function values are listed below.
Exercise Set 2.1 225
2 3
f x x =
( ) 1 3 3 2 ' 3 2 3 f x x x = = ( ) ' f x does not
3
0 x =
25. ( )
1
exist when
(
(
A: ,0
−∞ ∞
)
)
and B: 0, :
( ) () 3 3 2 2 A: Test 1, ' 1 0 3 3 1 2 2 B: Test 1, ' 1 0 3 3 1 f f = = > =− =− <
x =
find ( )0 f : ( ) ( ) 2 3 0 1 0 1 f = = .
0
We
( ) ( ) 2 3 3 5 f x x = + ( ) ( ) ( ) 1 3 1 3 2 ' 3 3 2 3 3 f x x x = + = + ( )
f x
x
x =− .
−∞ ∞ ( ) ( ) ( ) ( ) 1 3 1 3 2 2 A: Test 4, ' 4 0 3 3 4 3 2 2 B: Test 2, ' 2 0 3 3 2 3 f f = = < + = = > +
26.
'
3
=−
3
=− ( ) ( ) 2 3 3 3 3 5 5 f = + = : Therefore,
) 3, 5
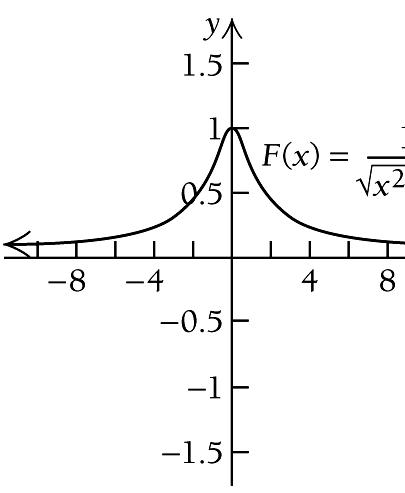
27. ( ) ( ) 1 2 2 8 8 1 1 G x x x = = + +
( ) ( ) ( ) ( ) ( ) 2 2 2 2 ' 8 1 1 2 16 1 G x x x x x =− + = + ( ) ' G x
x
x ( ) f x 8 3 1 0 1 0 8 3 x ( ) f x 11 1 4 4 2 4 5 1 B 0 A
3 x
there is a relative minimum at (
.
First, find the critical points.
exists for all real numbers. We set the derivative equal to zero and solve the equation for
on the next page.
Setting the derivative from the previous page equal to zero, we have:
The only critical value is 0 .
We use 0 to divide the real number line into two intervals,
We use 0 to divide the real number line into two intervals,
We use a test value in each interval to determine the sign of the derivative in each interval.
We see that ( ) Gx is decreasing on ( ) ,0−∞ and increasing on ( ) 0, ∞ . Thus, a relative minimum occurs at 0 x =
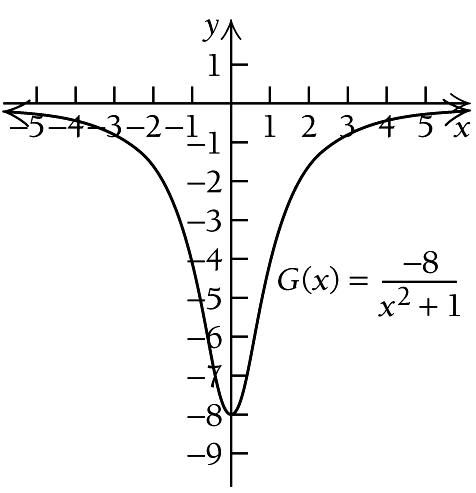
We see that ( ) F x is increasing on ( ) ,0−∞ and decreasing on ( ) 0, ∞ . Thus, a relative maximum occurs at 0 x = We find
Thus, there is a relative minimum at ( ) 0, 8 We use the information obtained to sketch the graph. Other function values are listed below.
Thus, there is a relative maximum at ( )0,5 We use the information obtained to sketch the graph. Other function values are listed below.
226
Chapter 2: Applications of Differentiation
( ) ( )2 2 ' 0 16 0 1 16 0 0 G x x x x x = = + = =
( ) ( ) A: ,0 and B:
: −∞ ∞
0,
( ) ( ) ( ) ( ) () () (() ) 2 2 2 2 16 1 16 A: Test 1, ' 1 4 0 4 1 1 16 1 16 B: Test 1, ' 1 4 0 4 1 1 G G = = = < + = = = > +
We find ( )0 G : () ()2 8 0 8 0 1 G = = +
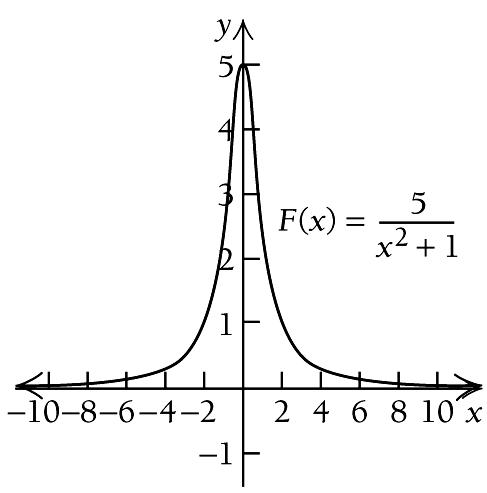
28. ( ) ( ) 1 2 2 5 5 1 1 F x x x = = + + ( ) ( ) ( ) ( ) ( ) 2 2 2 2 ' 5 1 1 2 10 1 F x x x x x = + = + ( ) ' F x exists for all real numbers. We solve ( ) ( )2 2 ' 0 10 0 1 0 F x x x x = = + = The only
is 0 .
( ) ( ) A: ,0 and B: 0, : −∞ ∞ ( ) ( ) ( ) ( )2 2 A: Test 1, 10 1 10 5 ' 1 0 4 2 1 1 F = = = > + () () (() )2 2 B: Test 1, 10 1 10 5 ' 1 0 4 2 1 1 F = = = < +
critical values
( )0 F : () ()2 5 0 5 0 1 F = = +
x ( ) Gx 3 4 5 2 8 5 1 4 1 4 2 8 5 3 4 5 x ( ) F x 3 1 2 2 1 1 5 2 1 5 2 2 1 3 1 2 B 0 A
The critical values are 1 and 1 . We use them to divide the real number line into three intervals,
We find
Then we find ( )1 g :
There is a relative minimum at ( ) 1, 2 , and there is a relative maximum at ( )1,2 . We use the information obtained to sketch the graph. Other function values are listed below.
We use a test value in each interval to determine the sign of the derivative in each interval.
The only critical values is 0
We use 0 to divide the real number line into two intervals,
We see that ( ) g x is decreasing on ( ) , 1 −∞ , increasing on ( )1,1 , and decreasing again on ( ) 1, ∞ . So there is a relative minimum at 1
and a relative maximum at 1 x = .
The solution is continued on the next page.
Exercise Set 2.1 227 29. ( ) 2 4 1 x g x x = + First, find the critical points. ( ) ( ) ( ) ( ) ( ) ( ) ( ) 2 2 2 2 2 2 2 2 2 2 1 4 4 2 ' Quotient Rule 1 4 4 8 1 4 4 1 x x x g x x x x x x x + = + + = + = + ( ) ' g x exists for all real numbers. We solve ( ) ( ) ( ) 2 2 2 2 2 2 2 2 ' 0 4 4 0 1 4 4 0 Multiplying by 1 1 0 Dividing by 4 1 1 1 g x x x x x x x x x = = + = + = = =± =±
( ) ( ) ( ) A: , 1 , B: 1,1 , and C: 1, −∞ ∞
( ) ( ) ( ) ( ) () () (() ) ( ) ( ) ( ) ( ) 2 2 2 2 2 2 2 2 2 4 4 2 12 A: Test 2, ' 2 0 25 2 1 4 4 0 B: Test 0, g ' 0 4 0 0 1 4 4 2 12 C: Test 2, g ' 2 0 25 2 1 g = = < + = = > + = = < +
x =−
( )1 g : ( ) ( ) ( )2 4 1 4 1 2 2 1 1 g = = = +
() ( ) ()2 41 4 1 2 2 1 1 g = = = +
30. ( ) 2 2 1 x g x x = + ( ) ( ) ( ) ( ) ( ) 2 2 2 2 1 2 2 ' 1 x x x x g x x + = + ( ) ( )2 2 2 ' 1 x g x x = + ( ) ' g x exists for all real numbers. We solve ( ) ( )2 2 ' 0 2 0 1 0 g x x x x = = + =
( ) ( ) A: ,0 and B: 0, : −∞ ∞ ( ) ( ) ( ) ( ) () () (() ) 2 2 2 2 A: Test 1, 2 1 2 1 ' 1 0 4 2 1 1 B: Test 1, 21 2 1 ' 1 0 4 2 1 1 g g = = = < + = = = > +
x ( ) g x 3 6 5 2 8 5 0 0 2 8 5 3 6 5 A B 1 C 1
From the previous page, we see that ( ) g x is decreasing on ( ) ,0−∞ and increasing on ( ) 0, ∞ Thus, a relative minimum occurs at 0 x =
We find
relative minimum at ( ) 0,0 . We use the information obtained to sketch the graph. Other function values are listed below.
We see that ( ) f x is increasing on both ( ) ,0−∞ and ( ) 0, ∞ . Thus, there are no relative extrema for ( ) f x . We use the information obtained to sketch the graph. Other function values are listed below.
therefore, the only
We use 1 to divide the real number line into two intervals,
no solution, therefore, the only
to divide the real number line into two intervals,
We
We see that ( ) f x is increasing on both intervals, Thus, there are no relative extrema for (
We use the information obtained to sketch the graph. Other function values are listed below.
We use a test value in each interval to determine the sign of the derivative in each interval.
228
Chapter 2: Applications of Differentiation
( ) 0 g : () ( ) () 2 2 0 0 0 0 1 g = = +
is
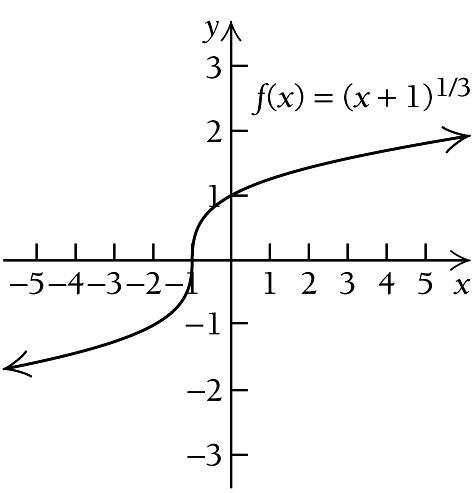
31. ( ) ( ) 1 3 3 f x x x = =
find the critical points. ( ) ( ) ( ) 2 3 2 3 3 2 1 ' 3 1 1 3 3 f x x x x = = = ⋅ ( ) ' f x does not exist when 0 x = . The
( ) ' 0 f x =
critical value is 0 x =
( ) ( ) A: ,0 and B: 0, : −∞ ∞
Thus, there
a
First,
equation
has
use 0
( ) ( ) () () 2 3 2 3 1 1 A: Test 1, ' 1 0 3 3 1 1 1 B: Test 1, ' 1 0 3 3 1 f f = = > = = > ⎛ ⎞ ⎜ ⎟ ⎝ ⎠
32. ( ) ( ) 1 3 1 f x x = + ( ) ( ) () ( ) 2 3 2 3 1 ' 1 1 3 1 3 1 f x x x = + = + ( ) ' f x does not exist when 1 x =− . The equation ( ) ' 0 f x = has no solution,
critical value is 1 x =−
( ) ( ) A: , 1 and B: 1, : −∞ ∞ ( ) ( ) 2 3 1 1 A: Test 2, ' 2 0 3 3 2 1 f = = > + () ( ) 2 3 1 1 B: Test 0, ' 0 0 3 30 1 f = = > +
) f x
x ( ) g x 3 9 10 2 4 5 1 1 2 1 1 2 2 4 5 3 9 10 x ( ) f x 8 2 1 1 0 0 1 1 8 2 x ( ) f x 9 2 2 1 1 0 0 1 7 2 B 0 A
We use the information obtained to sketch the graph. Other function values are listed below.
First, find the critical points.
The equation 2 2 5 0 x x + + = has no realnumber solution, so ( ) ' g x exists for all real numbers. Next we find out where the derivative is zero. We solve
The only critical value is 1 . We use 1 to divide the real number line into two intervals,
The only critical value is
We use a test value in each interval to determine the sign of the derivative in each interval.
We use 0 to divide the real number line into two intervals,
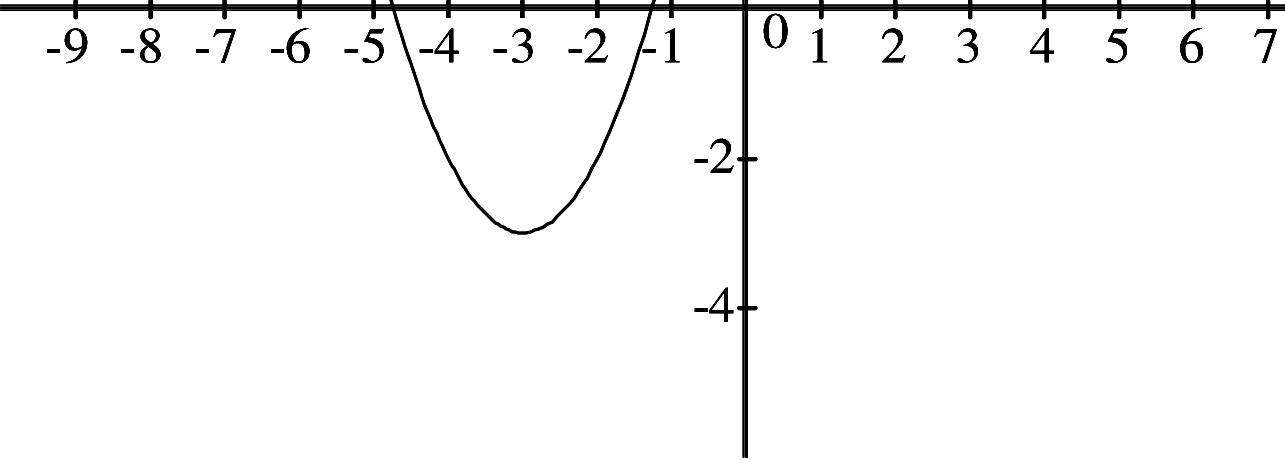
We see that ( ) g x is decreasing on ( ) , 1 −∞ and increasing on ( ) 1, ∞ , and the change from decreasing to increasing indicates that a relative minimum occurs at 1 x =− . We substitute into the original equation to find ( )1 g :
Thus, there is a relative minimum at ( ) 1,2
We see that ( ) F x is increasing on ( ) ,0−∞ and decreasing on ( ) 0, ∞ . Thus, a relative maximum occurs at 0 x =
Thus, there is a relative maximum at ( )0,1 . We use the information obtained to sketch the graph on the next page.
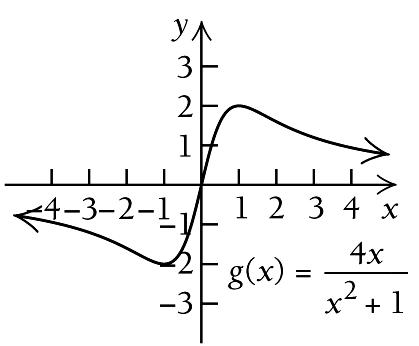
Exercise Set 2.1 229 33. ( ) ( ) 1 2 2 2 2 5 2 5 g x x x x x = + + = + +
( ) ( ) (
( ) ( ) 1 2 1 2 2 2 2 1 ' 2 5 2 2 2 2 1 2 2 5 1 2 5 g x x x x x x x x x x = + + + + = + + + = + +
)
( ) 2 ' 0 1 0 2 5 1 0 1 g x x x x x x = + = + + + = =−
( ) ( ) A: , 1 and B: 1, : −∞ ∞
( ) ( ) ( ) ( ) 2 A: Test 2, 2 1 1 ' 2 0 5 2 2 2 5 g + = = < + + () () () () 2 B: Test 0, 0 1 1 ' 0 0 5 0 2 0 5 g + = = > + +
( ) ( ) ( ) 2 1 1 2 1 5 4 2 g = + + = =
34. ( ) ( ) 1 2 2 2 1 1 1 F x x x = = + + ( ) ( ) ( ) ( ) 3 2 3 2 2 2 1 ' 1 2 2 1 F x x x x x ⎛ ⎞ = + ⎜ ⎟ ⎝ ⎠ = + ( ) ' F x exists for all real numbers. We solve ( ) ( ) 3 2 2 ' 0 0 1 0 F x x x x = = + =
0
( ) ( ) A: ,0 and B: 0, : −∞ ∞ ( ) ( ) ( ) ( ) () (() ) 3 2 3 2 2 2 A: Test 1, 1 1 ' 1 0 8 1 1 B: Test 1, 1 1 ' 1 0 8 1 1 F F = = > + = = < +
() ()2 1 0 1 0 1 F = = +
x ( ) g x 4 3.61 2 2.24 0 2.24 1 2.83 3 4.47 A B 1
We use the information obtained on theee previous page to sketch the graph. Otheee function values are listed below.

Chapter 2: Applications of Differeee
72. Answers may vary, one such graphhh
35. – 68. Left to the student.
69. Answers may vary, one such graph is:


73. Answers may vary, one such graphhh
70. Answers may vary, one such graph is:
74. Answers may vary, one such graphhh
71. Answers may vary, one such graph is:
75. Answers may vary, one such graphhh
76. Answers may vary, one such graphhh
ntiation is: is: is: is: is:
230
x ( ) F x 3 0.32 2 0.45 1 0.71 1 0.71 2 0.45 3 0.32
r
77. Answers may vary, one such graph is:
82. Answers may vary, one such graph is:
78. Answers may vary, one such graph is:
83. Answers may vary, one such graph is:
79. Answers may vary, one such graph is:
84. Answers may vary, one such graph is:
80. Answers may vary, one such graph is:
85. tw The critical value of a function f is an interior value c of its domain at which the tangent to the graph is horizontal ( ) ( ) ' 0 f c = or the tangent is vertical ( ) ( ) ' does not exist f c The critical values for this graph are
81. Answers may vary, one such graph is:
86. tw The function is increasing on intervals ( ) ( ) , and , ab c d . A line tangent to the curve at any point on either of these intervals has a positive slope. Thus, the function is increasing on the intervals for which the first derivative is positive. Similarly, we see that on the intervals ( ) ( ) , and , bc d e the function is decreasing. A line tangent to the curve at any point on either of these intervals has a negative slope. Thus, the function is decreasing on the intervals for which first derivative is negative.
Exercise Set 2.1 231
1 3 4 5 6 7 8 10 , , , , , , , x x x x x x x x
x y -5 -4 -3 -2 -1 0 1 2 3 4 5 x y -5 -4 -3 -2 -1 0 1 2 3 4 5 x f(x) -5 -4 -3 -2 -1 0 1 2 3 4 5 x g(x) -9 -8 -7 -6 -5 -4 -3 -2 -1 0 1 2 3 4 5 6 7 8 9 x H(x) -9 -8 -7 -6 -5 -4 -3 -2 -1 0 1 2 3 4 5 6 7 8 9 x K(x) -9 -8 -7 -6 -5 -4 -3 -2 -1 0 1 2 3 4 5 6 7 8 9


