

Table of Contents

Repowering
Repowering
The Philadelphia Climate Action Plan highlights three key priorities as part of their commitment to carbon neutrality by 2050: (1) reducing Philadelphia’s contribution to climate change through decreased carbon emissions, (2) increasing Philadelphia’s use of nature-based solutions to address climate pollution, and (3) adapting Philadelphia’s infrastructure to withstand a future with higher temperatures, more precipitation, and greater flooding risks. Reducing the Philadelphia School District’s energy usage by 30 percent by 2027 is chief among the City’s clean energy goals. The following technical assistance plan combines the City of Philadelphia’s clean electricity goal and the School District’s energy reduction goal by proposing an investment strategy for repowered electric school bus (ESB) fleets for the Philadelphia School District. The following proposal responds to Philadelphia’s green infrastructure priorities by outlining a phased approach to electrifying diesel school buses (DSB) – providing operational guidance from policy analysis to charging station deployment.
In 2024, Philadelphia committed to converting 20% of its school bus fleet to electric power. The transition strategy includes multiple phases, with the initial phase focusing on retrofitting 14 buses a year for 15 years Each retrofit will cost between $110,000 and $180,000.
The implementation of this project is structured into key phases. The Assessment and Planning phase involves a thorough evaluation of the current fleet to ascertain which models are suitable for battery replacement and to design the layout of the charging stations. The Infrastructure Development phase will include the installation of fast-charging stations and upgrades to the electrical grid. The Battery Replacement and Bus Retrofitting phase will prioritize safety and efficiency standards with the retrofit kits. The Operational Transition phase will train drivers and maintenance staff on how to use the new systems. Notably, this phase seeks to expand local green job opportunities by enabling local dealers and bus operators to perform retrofits with shipped kits. The final phase, Evaluation and Expansion, focuses on monitoring the performance of the retrofitted buses, adjusting operational practices as necessary, and planning for further expansion of the electric fleet. This comprehensive approach not only fosters sustainability but also supports local employment and technological advancement in Philadelphia’s public transportation sector (see Figure 1).
Repowered ESBs are a better long-term investment compared to DSBs. Cost savings are amplified by the combined impact of record-high levels of U.S. government funding supporting the electric vehicle transition and reduced maintenance expenses re uired to keep ESBs operating safely compared to (DSBs).
ith the support of public grants, the City of Philadelphia can help its School District through a variety of funding mechanisms, enabling the District to benefit from the lower total cost of ownership TCO of an ESB compared to a DSB. These federal and state grants allow the City of Philadelphia to consider the long-term benefits of an ESB transition and look beyond the initial price points ( $375,000 (ESB) and $125,000 (DSB)).
ESBs offer long-term cost savings despite higher initial investments. Even without federal and state aid, studies estimate that by 2050 ESBs and DSBs will have e ual TC s. These estimates are based on the expectation that the upfront cost of electric vehicles will decrease over time due to economies of scale, increased efficiency in component markets, and legislative support such as the Inflation eduction Act.
As the ESB market expands, battery production will scale up and become more efficient, driving down per-unit costs over time. Although building the necessary charging infrastructure re uires significant investment, it will also diversify the local workforce, creating new green ob opportunities, and contribute to regional social and economic stability. In addition, ESBs re uire less maintenance than DSBs, further reducing total cost of ownership. Notably, this economy of scale can only be achieved with sufficient initial investment on behalf of the consumer.
If Philadelphia delays investment electric school bus prices may eventually fall however postponing action prolongs ecological harm and heightens public health risks leaving the community more vulnerable in the meantime.
Between 2021 to 2025, Philadelphia ac uired 40 new electric school buses. It is estimated that the City spent over 12,000,000 on these buses . Notably, this expenditure does not account for the money re uired to improve the electric grid and create charging infrastructure. In 2024, the City stated their intention to annually electrify four percent of their 330 bus fleet. The repowering of a DSB is around $200,000 cheaper than purchasing a new ESB. Each repowering costs an estimated $110,000. iven the City’s four percent annual school bus electrification goal, the City of Philadelphia will need to repower 13 buses a year to reach their goal. The total costs on the repowering 125 buses is 13 750 000.
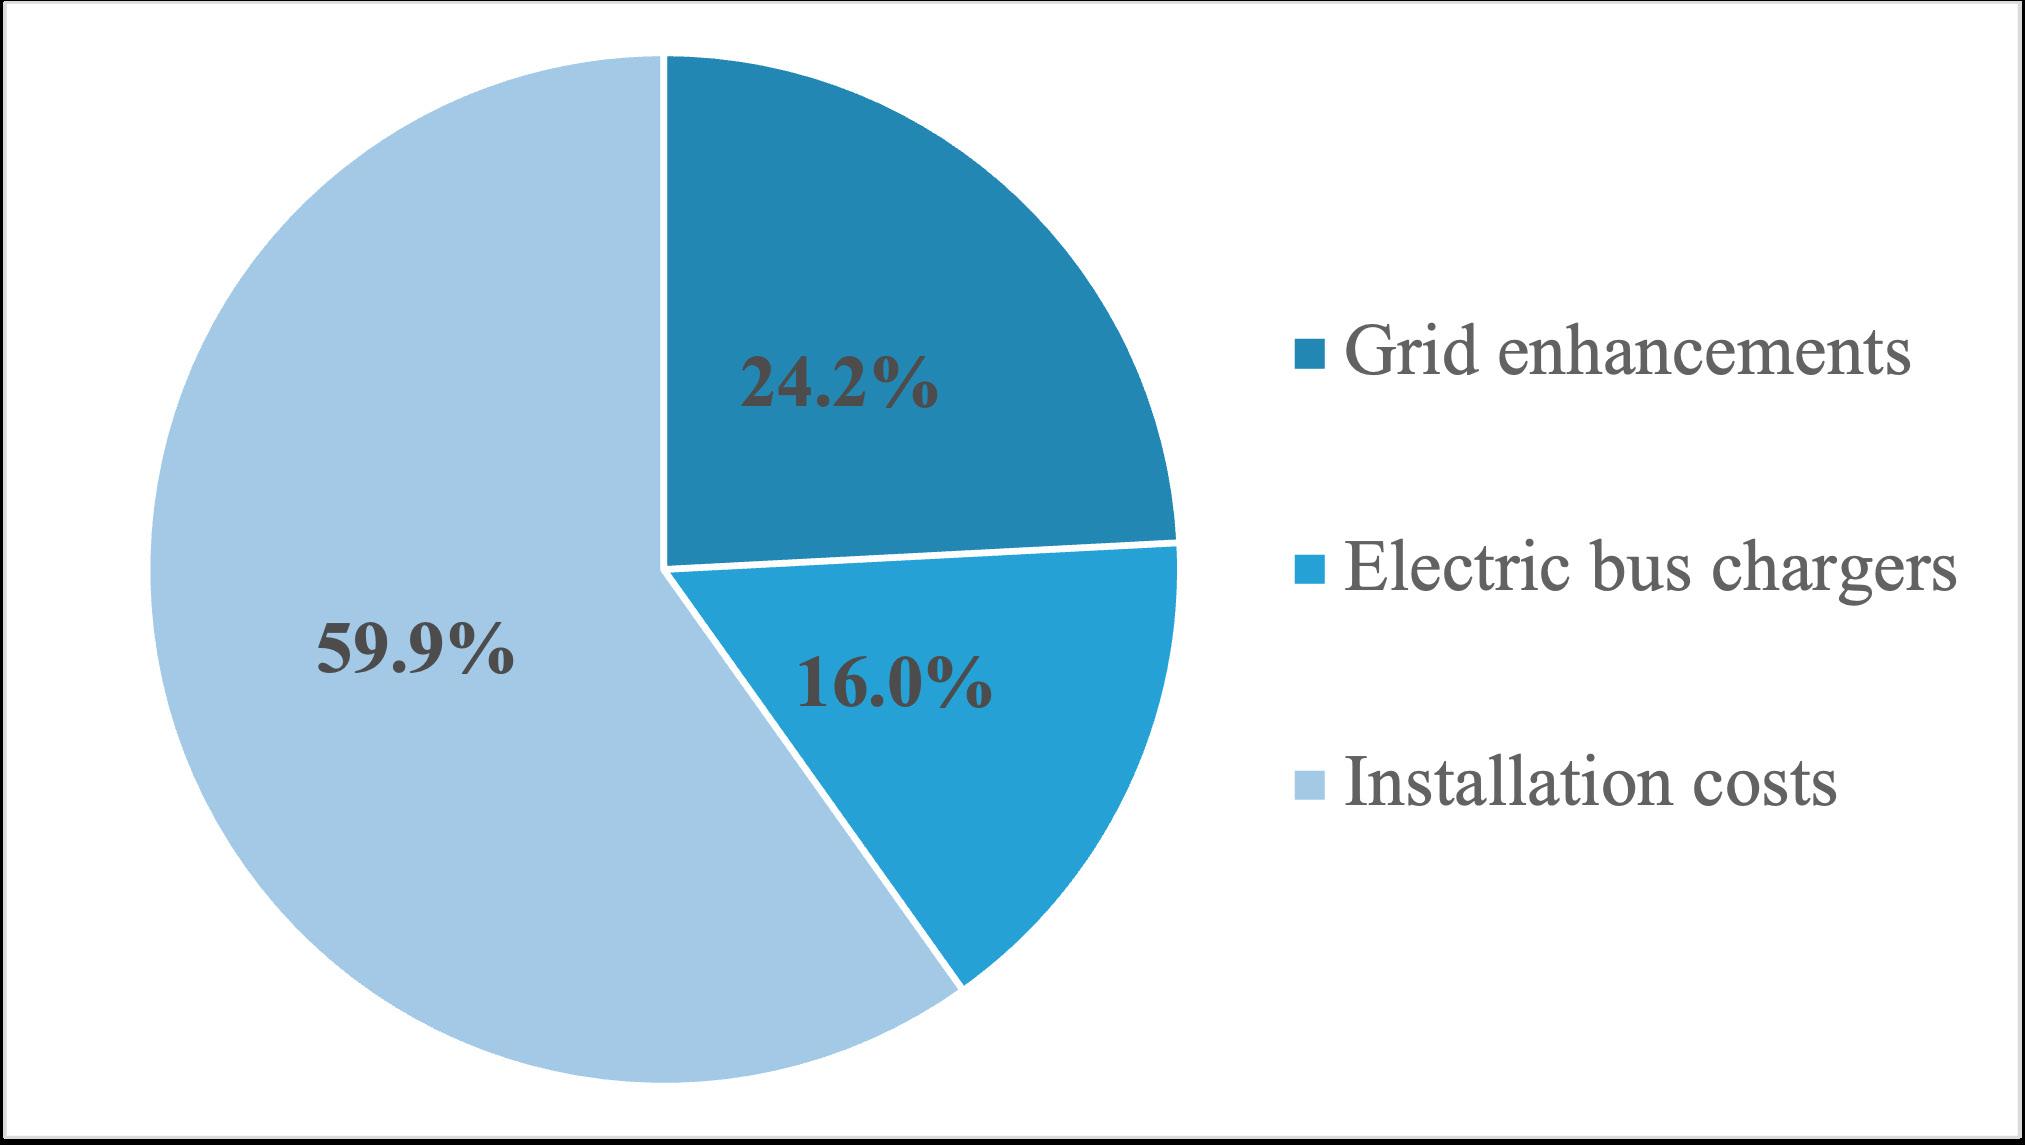
The below CAPE makes a several assumptions concerning the cost of upgrading the city’s infrastructure, particularly the electric grid’s access to clean energy. First, it estimates that a singular electric bus charger will cost $75,000 and thus the cost of 125 additional electric bus chargers will amount to $ ,375,000. Second it estimates that it will cost $20,000 per charger installation and amount to a total of $2,500,000 for 125 installations. Finally, it estimates that grid enhancements will cost around $3,787,87 . The total estimated CAPE is $15, 2,87
inancial Incentive-based Grants: ith respect to federal funding schemes, the City of Philadelphia ualifies under the Diesel eduction Act program for assistance in funding new ESBs. However, the existing rebate system in the US has yet to include the repowering of an internal combustion engine into an electrical battery as eligible for funding. Despite this short coming in available funding, Philadelphia can benefit from a state-level voucher program which would reduce the price of the internal battery system during the time of the sale.
Municipal Bonds: Philadelphia also has the option of leveraging the City’s capacity to raise funds from investors through the creation of municipal bonds. Investment in municipal bonds to repower DSBs will provide the investors with a tax-exempt status, and allow the City to immediately use the bond proceeds to begin retrofits. Philadelphia’s A’ credit rating allows them to issue municipal bonds at a low interest rate, meaning that the City does not have to pay back as much money over time.
Public-Private Partnership PPP : The financing of the ESB repowers will benefit from a PPP between the City of Philadelphia and the Blue Bird Corporation, an ESB company which also does DSB repowers. The company operates on the United States’ east coast and is within a five hour drive from Philadelphia. The City will provide the existing DSBs ready for a retrofit to Blue Bird and Blue Bird will provide technical expertise and finance the upfront costs of the retrofits and improvements to the electric grid and charging stations. The Blue Bird Corporation will be the primary funder of this operation; although, Philadelphia will match ten percent of their funding with revenue earned from municipal bonds. The Blue Bird Corporation will have a long term contract with the City and benefit from regular payments and from the City taking on the regulatory and compliance risks. A Philadelphia-Blue Bird Corporation partnership uses private capital experience to accelerate an DSB repowered fleet. Such an initiative enhances job growth and better aligns the city with its commitment to carbon neutrality by 2050.
Community engagement is a vital part of this DSB retrofit program, and the City should consult parents, students, and bus drivers throughout the implementation process to ensure their input is reflected in the initiative’s roll-out. hile this proposal is sustainable with respect to the environment, it can only be sustainable with respect to longevity with continued support of the Philadelphia community. This Electric School Bus Fleet initiative with a specific focus on battery replacement, rather than full vehicle replacement, strategically addresses Philadelphia’s environmental, economic, and social goals. Through thoughtful planning, community engagement, and innovative financing, the City has the opportunity to be a leader in DSB repowers.

Barcelona, like many densely built European cities, faces the urgent challenge of ecological transition as climate change effects intensify rising temperatures, water scarcity, flood vulnerability, and coastal erosion threaten both human and non-human inhabitants. However addressing these symptoms re uires confronting a fundamental problem: traditional approaches to urban development have systematically erased natural landforms and slopes reduced soil permeability and worsened flooding and heat island effects all while fragmenting ecosystems essential for urban biodiversity.
This new age of urban planning demands governing ecological transitions across multiple scales regional watersheds city-wide green networks and individual buildings that integrate living systems Contemporary planning must reimagine city density as hospitable to non-human life forms, creating connected corridors rather than fragmented patches of nature.
ecognizing human activity’s role in accelerating climate change, Barcelona’s City Council published the Barcelona Climate Plan 2018-2030, addressing air pollution, water management, biodiversity loss, energy consumption, and mobility through 242 climate actions organized around mitigation, adaptation, climate justice, and citizen engagement. The plan targets a 40% reduction in per-person C 2 emissions and increasing urban green space to 1m per resident by 2030.
The following report provides a framework for evaluating Barcelona’s Climate Action Plan and current ecological conditions, bridging the persistent gap between research and practice. hat should be monitored, measured, and compared to ensure effective ecological transition The following analysis identifies key performance indicators: land usage, normalized difference vegetation index (ND I), urban greenery, temperature, and energy consumption. Climate justice enters this evaluation by examining who has access to healthy urban spaces and the uality of livability these spaces provide. ey
ey Performance Indicator PI Land usage
Normalized difference vegetation index (ND I)
Heat heat comfort enewable energy Score Significance 0 ery poor
: Since this report aims to evaluate the ecological transition of Barcelona through its main PIs, it develops an evaluation method tailored to the study. Using Barcelona’s official pen Data website and peer-review external assessments of Barcelona’s ecological transition, five maps were created, using IS, to create a diagnosis of Barcelona’s ecological challenges. This report evaluates Barcelona’s efforts to address key ecological vulnerabilities using a 0–5 grading scale. The score is based on ecological data analysis and reflects how well the city’s initiatives align with and advance the goals outlined in its climate action plan.
Barcelona is divided into ten districts comprising 73 neighborhoods, with its geography framed by the Mediterranean Sea to the east and a mountainous range to the west. These mountains shape the city’s climate by creating microclimates, moderating temperatures, and influencing rainfall patterns. Despite a steadily growing population 1. million as of 2018 Barcelona has effectively controlled urban sprawl through intentional planning, maintaining high-density living, especially in central districts like Eixample and r cia. Ciutat ella, while showing the fastest growth in population density since 2018, remains one of the most economically vulnerable areas, reflecting lower average incomes and higher indicators of social vulnerability. Conversely, the city’s wealth is concentrated in the western districts, where residents have higher incomes and lower levels of educational disadvantage, often in enclaves buffered from poorer neighborhoods. The district of Sants-Montju c presents a complex case with one of the highest populations, the lowest average income, and the greatest proportion of residents with low educational attainment. These demographic and economic disparities provide essential context for understanding how climate vulnerabilities are unevenly distributed across the urban fabric.
Barcelona’s District Boundries
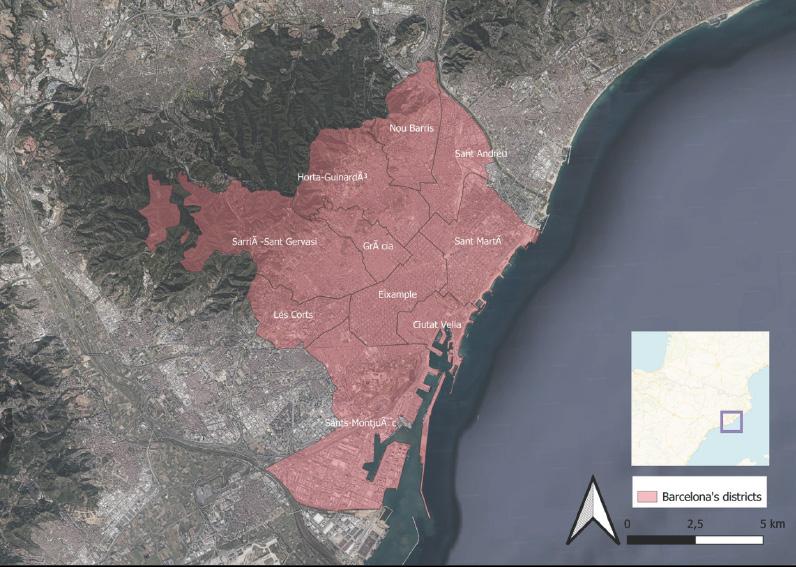
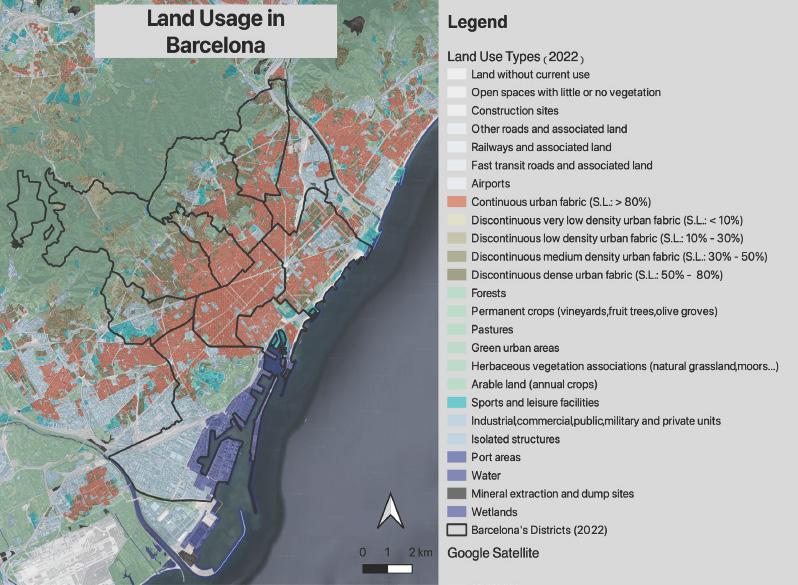
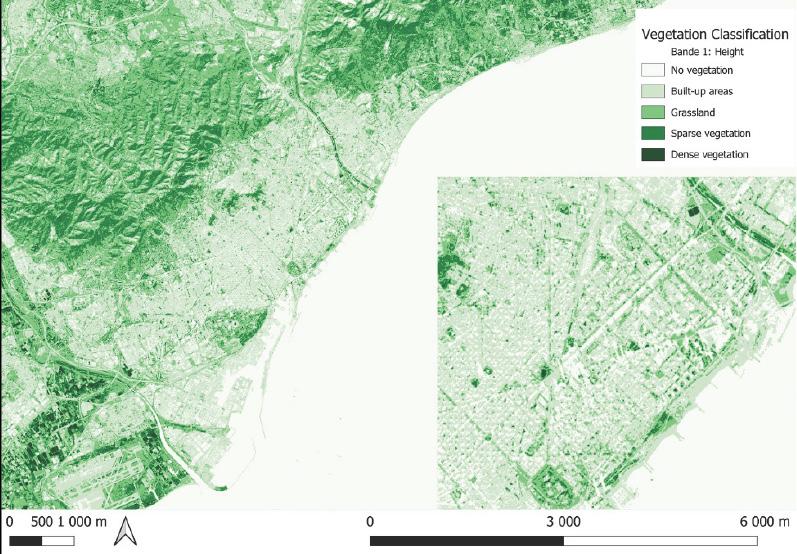
: Barcelona, situated along the Iberian Peninsula, is nestled between the Coastal Mountain ange, the Mediterranean Sea, the iver Bes s, and Montj c mountain. Its location along the sea makes it one of the busiest global ports for passengers. In 2018, Barcelona was considered one of the densest cities in Europe with a population of 1. million inhabitants within its area of 101.3 km3 and an average density of 157.47 inhabitants per 0.01 km2. Concerning land use, as of 2018, the city had 2 .34 km2 of green space. A key target of the City’s Climate Plan is for green space to increase by 1. km2 by 2030. Map I: Land Usage in Barcelona shows that, in 201 , 10.7% of the city’s area was covered by herbaceous vegetation, 4. 7% of the area was dedicated to permanent crops, and 0. 7% of the area was dedicated to green urban areas.
Score: 2 5
Data retrieved from pen Data BCN, round Uses of the City of Barcelona - 201
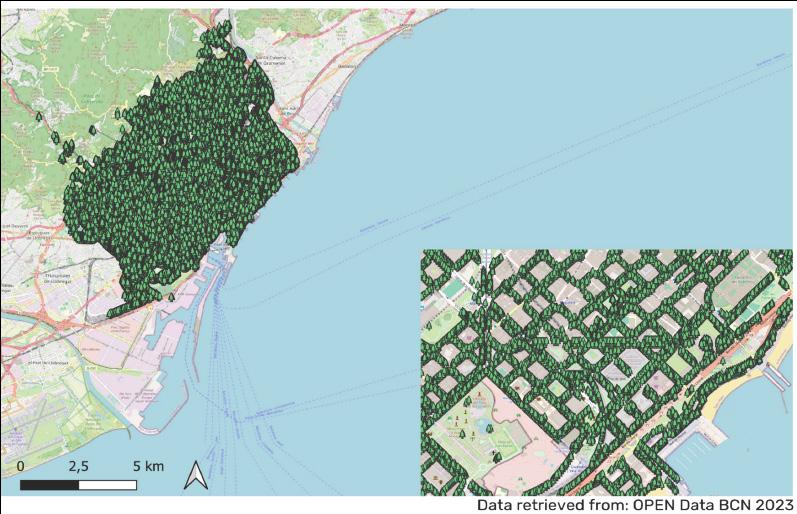
Barcelona lacks extensive and continuous green spaces, particularly in the city center, as illustrated in Maps 2.0 and 2.1. This scarcity of large, homogeneous green areas presents a clear ecological limitation. However, the city compensates for this through a widespread network of street trees, which are present along nearly every road. This urban tree canopy significantly improves air uality and helps reduce noise pollution, contributing meaningfully to a more livable and environmentally sustainable urban environment.
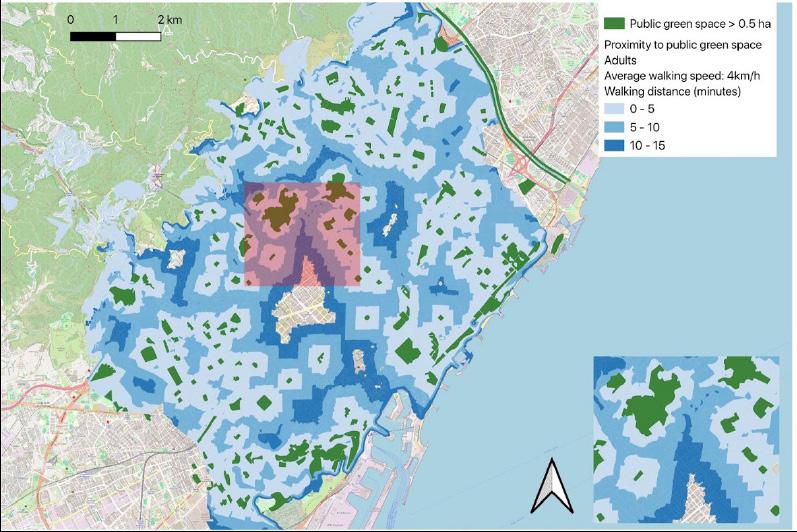
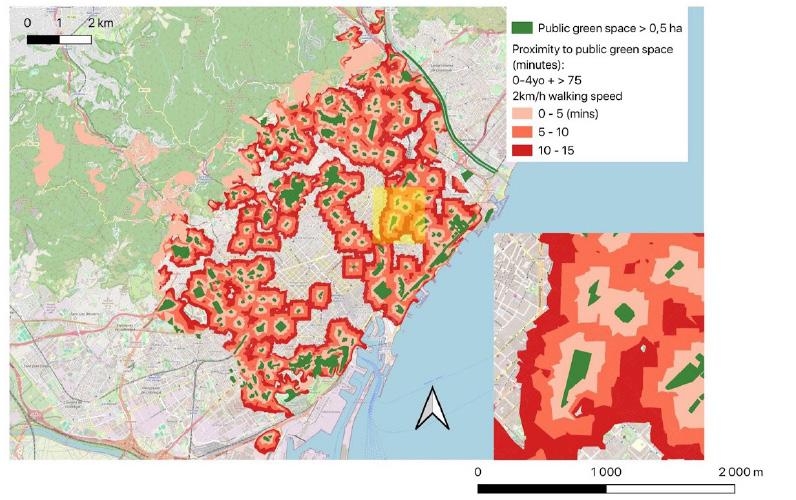
Map 2.2 highlights that, overall, access to public green spaces is well distributed throughout the city. The most notable exception is a distinct gap in green space accessibility in the centrally located Eixample district. Furthermore, Map 2.3 reveals that vulnerable residents defined here as individuals with a walking speed of 2 km h experience lower levels of accessibility to green spaces compared to more mobile adults.
In summary, while Barcelona faces a structural limitation in its lack of large central green spaces, its extensive street tree coverage and generally e uitable green space accessibility make it a city where greenery is present and functional. However, disparities remain for certain populations and locations.
Score: 4 5
Map 2.0: Barcelona’s ND I Levels
Data retrieved from Copernicus Browser, Sentinel 2, 7 1 2024
Map 2.1: Street Trees in Barcelona
Data retrieved from pen Data BCN, 2023
Map 2.2: Adults’ Public Green Space Accessibility
Data retrieved from pen Data BCN, 2017
Map 2.3: ulnerable Population Green Space Accessibility
Data retrieved from pen Data BCN, 2010
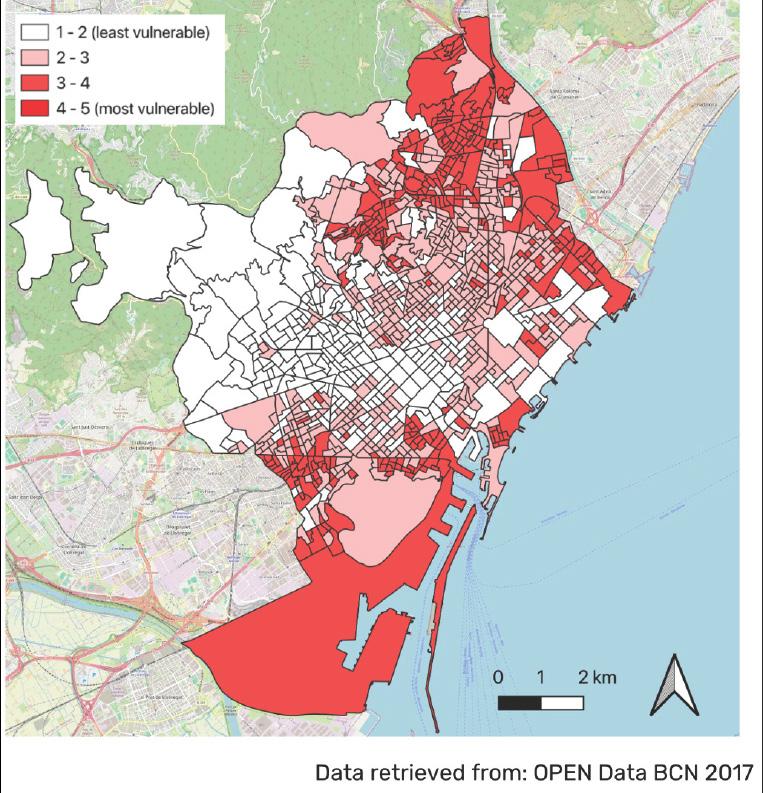
ising temperature has severe implications on the health and uality of life of Barcelona’s residents. It is projected that there may be eight times as many heat waves by the end of the century
The dataset provided by PEN Data BCN takes into account four different vulnerability factors: cooling demand for residential buildings, residents over 75 years old, presence of greenery, as well as insufficient levels of education. These dimensions are fundamental to understanding vulnerability and climate justice.
A clear pattern of uasi-concentric heat-related spatial segregation appears. Indeed while the city center and the part closest to the hinterland are surprisingly not very vulnerable to heat, the northern and southern outskirts of the city are the most vulnerable, showing an evident disparity between neighborhood according to their location. This could be linked to the fact that city center residents are characterized by levels of higher education and income, making them less vulnerable to heat because they have more financial resources to counter its adverse effects.
Score: 2 5
Data retrieved from pen Data BCN, 2017
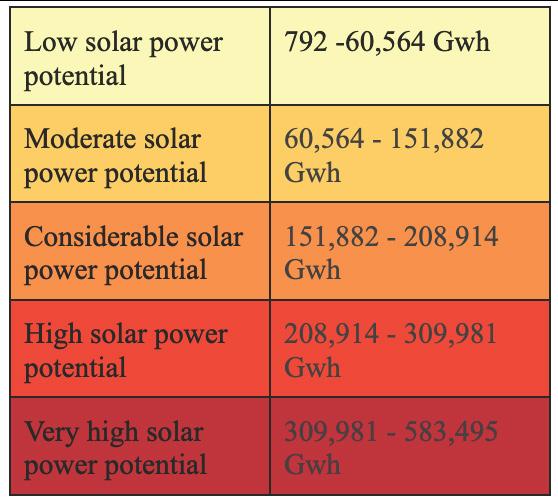
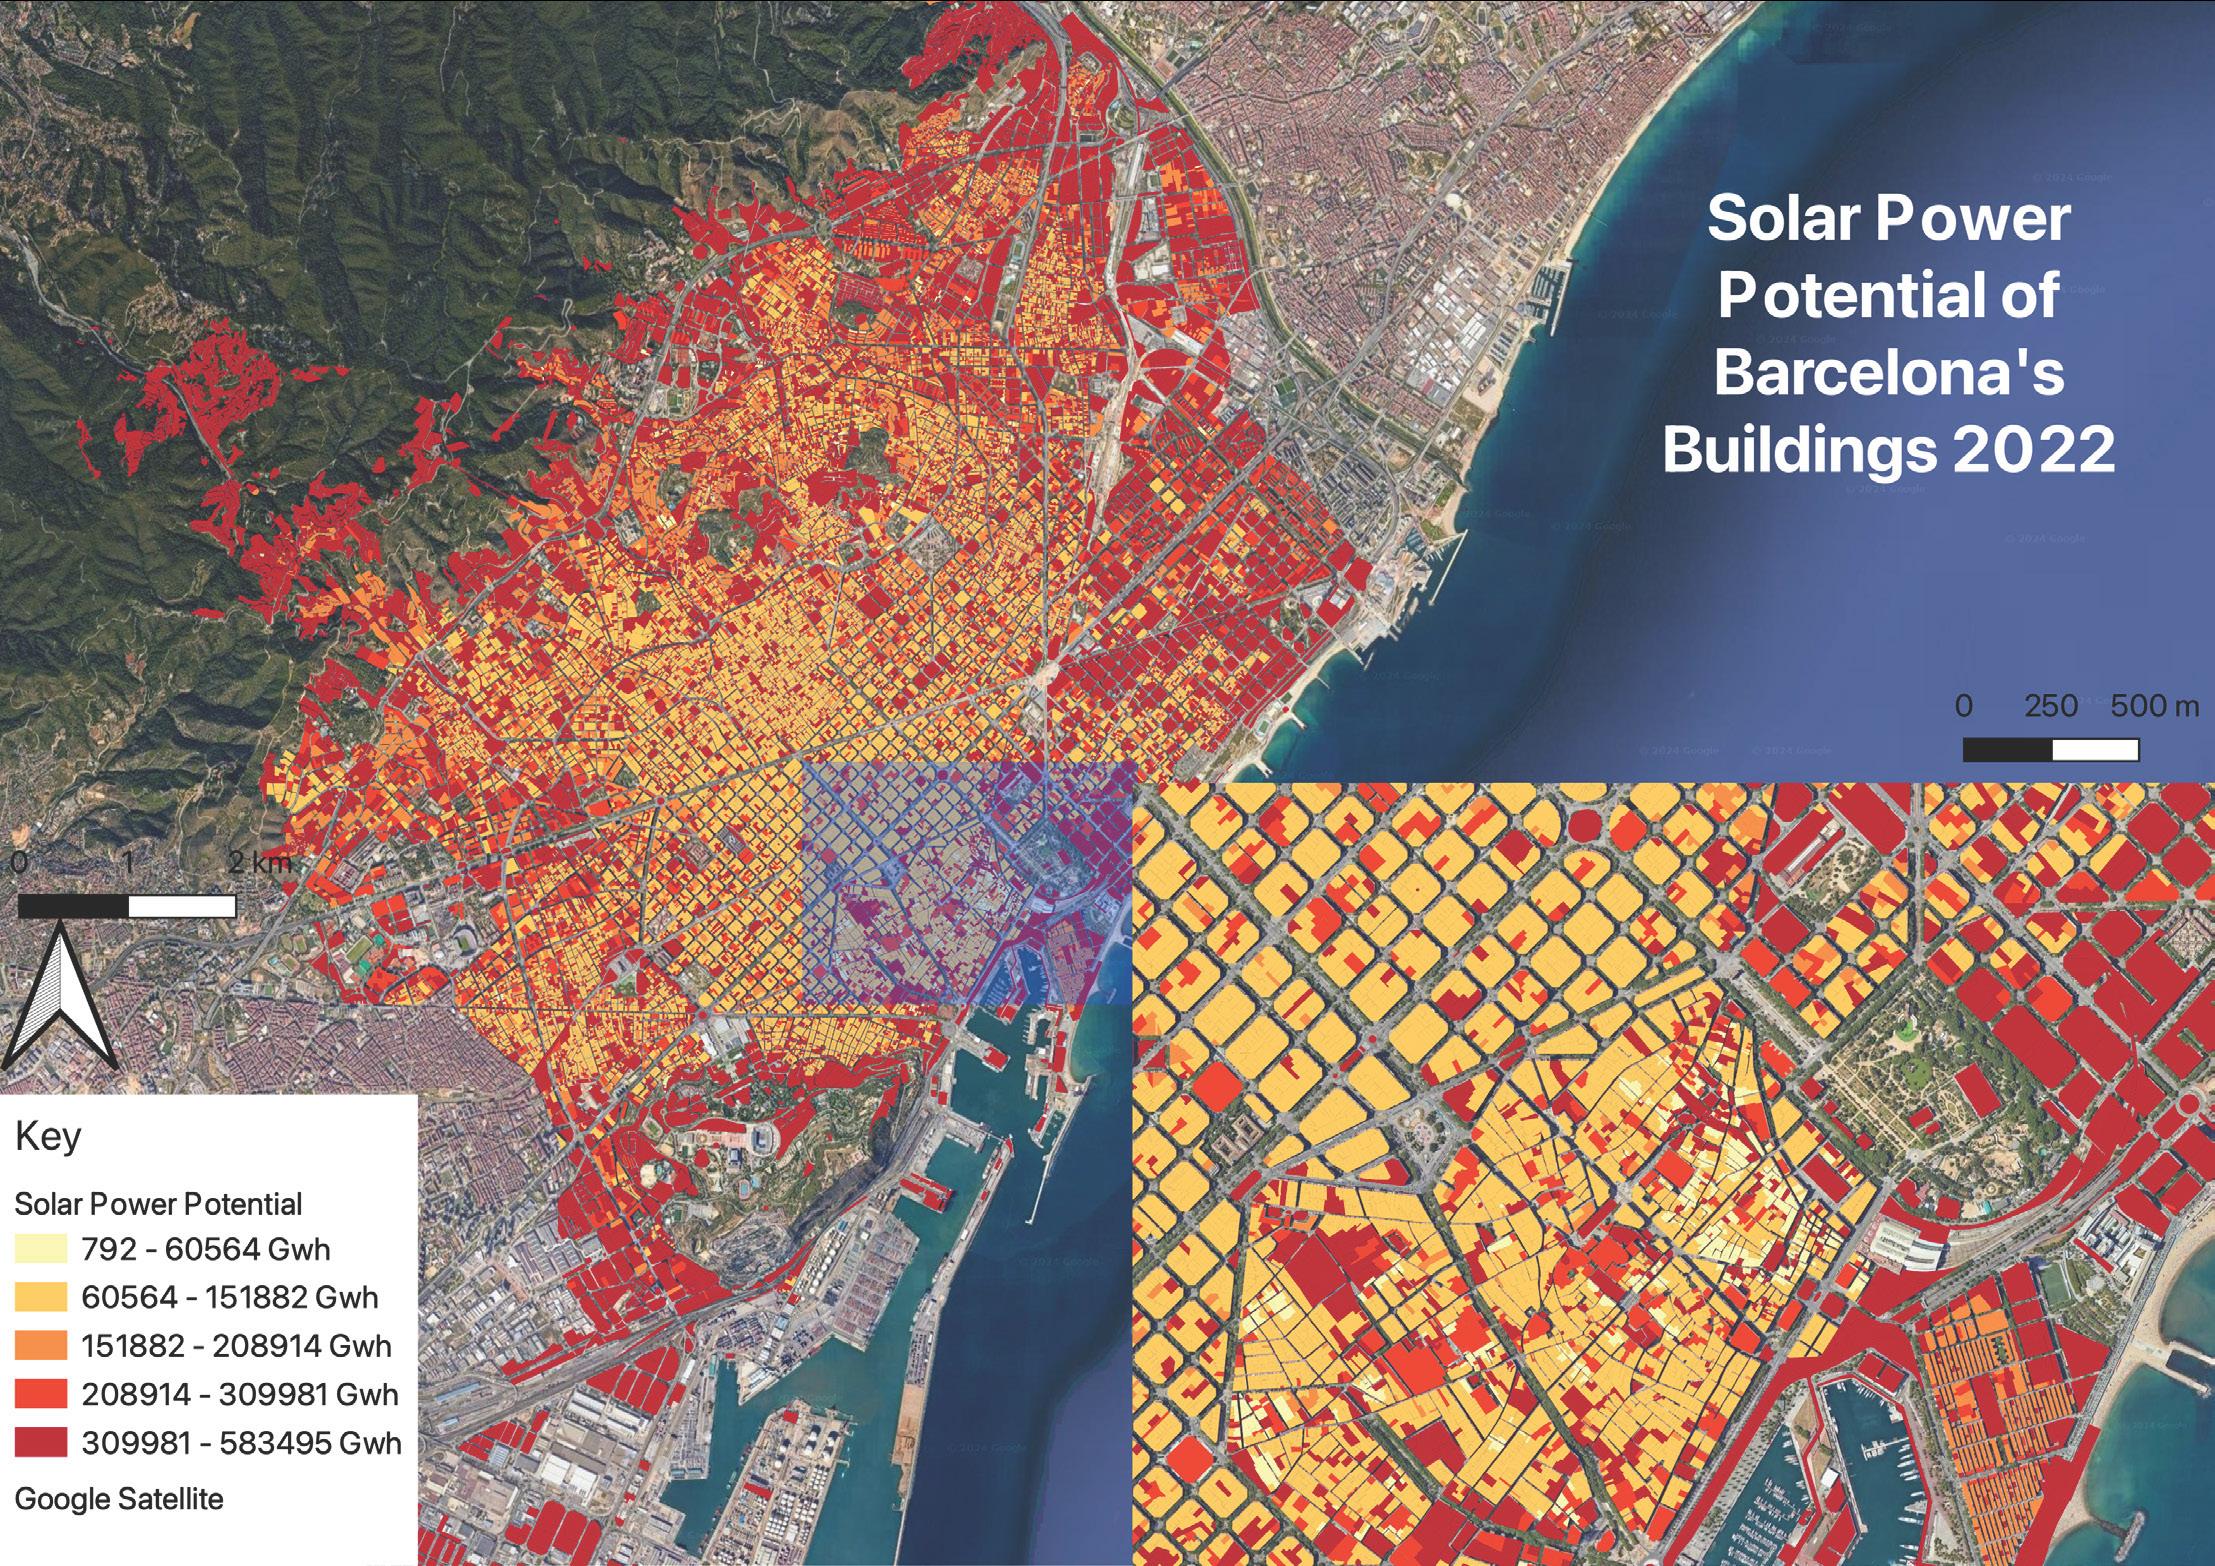
Barcelona has significant untapped potential to harness solar energy as part of its renewable energy transition. ith approximately 80. 41 km of the city covered by buildings, and an estimated 30% of rooftops suitable for solar panel installation, calculations suggest that 5,457. he year of electrical energy could be generated annually. iven the city’s total electricity consumption of 15,442 he year in 2022, this means solar panels alone could meet 35.34% of Barcelona’s energy demand a substantial contribution that highlights the viability of solar power as a strategic energy source.
The assessment draws from spatial data and solar irradiation levels (1,503.8 h km year), visualized through a map (Map 4) based on Carto BCN’s 201 building footprint data. hile initial models faced challenges, such as the incorrect placement of solar panels over non-building areas, these were addressed by refining the data removing polygons larger than 20,000 m to exclude green spaces and improve accuracy. The result is a detailed spatial representation of solar potential across the city. Interestingly, most buildings exhibit some degree of solar suitability, though areas designated as constant urban fabric tend to have lower potential. Conversely, peripheral zones and isolated structures, such as military and commercial buildings, show very high solar potential.
Barcelona has recognized this opportunity and initiated plans to install solar panels on 1,400 buildings, aiming to produce 83 megawatts of power by 2030. hile this is a positive step, it represents only a fraction of the total solar potential identified. The long-term success of this strategy will depend on scaling these efforts and ensuring they translate into measurable environmental and public health benefits.
In light of these insights, Barcelona earns a score of 3 out of 5 for its progress in leveraging its solar power potential. The city shows strong commitment and clear technical capacity, but full realization of this potential remains a work in progress.
Score: 3 5
Data retrieved from Carto BCN, Barcelona Building Footprints, Carto BCN, 201
In conclusion, Barcelona’s ecological transition reflects both structural limitations inherited from its history of impermeable urban planning and promising efforts to adapt through multi-scalar governance. hile the city demonstrates progress in areas like green space expansion and renewable energy, persistent disparities in heat exposure, air uality, and ecosystem fragmentation underscore the need for a deeper integration of ecological principles into urban form. The average score of 3 out of 5 stars acknowledges both the ambition of initiatives like the Climate Plan 2018–2030 and the uneven realization of its goals. For Barcelona to truly embody a regenerative and inclusive urban model, future strategies must better reconcile human and non-human needs, ensuring that environmental justice and resilience are embedded at every scale from rooftop to watershed.
The stabilization of property taxes in areas experiencing green gentrification is an important public policy tool that can help ameliorate the displacement of lower-income homeowners. hile it is well-recognized that urban greening, particularly in impoverished portions of cities with few green spaces, can greatly improve air uality, temperatures, mental health, and community safety, urban greening also has the unintended conse uence of displacing lower-income renters and homeowners. As the Barcelona Laboratory for Urban Environmental Justice and Sustainability notes, urban greening projects often result in green gentrification, which refers to the implementation of environmental planning agenda s related to green spaces that lead to the exclusion and displacement of politically disenfranchised residents. In the case where urban greening projects substantially increase property values, communities with lower-income renters and homeowners are particularly vulnerable to pressures forcing residents to leave the very neighborhoods that were greened. The elderly and fixed-income homeowners, who may find it difficult to make ends meet on a fixed budget, are particularly vulnerable to this phenomenon. hen considering urban greening in New ork City, policies should work to promote development without displacement. This policy proposal recommends the stabilization of property taxes as an effective tool to ameliorate homeowner displacement.
There are over 20,000 acres of green space in New ork City, including a network of over 2,300 parks. In 2020, New ork City had a population of around 8.7 million residents, 82% of whom lived within a 10-minute walk to a park. Notably, this left over one million New orkers living in areas with poor access to green space. According to a 2020 New ork Times
article, a majority of the neighborhoods located more than a 10-minute walk from a park were low-income communities of color situated in boroughs outside of Manhattan. ecognizing these disparities, the New ork City Department of Parks and ecreation has created the alk to a Park Initiative to increase access to green space in marginalized neighborhoods. However, similar to the pportunity ones Act of 2017 (federal legislation which sought to incentivize developers with tax benefits if they invested in zones with a poverty rate of at least 20%), the alk to a Park program has yet to include measures to protect long-term low-income residents from displacement as a result of reinvestments such as urban greening.
This policy proposal for New ork City recommends the creation of a property tax stabilization program for low-income homeowners living in areas adjacent to urban greening projects. Lower-income homeowners would be defined as resident with income in the lowest 25th percentile in the relevant borough. . These ualified lower-income homeowners would be granted a five-year freeze on their property taxes, commencing as of substantial completion of the urban greening project. However, to the extent that the amount of property taxes would otherwise have increased over the five-year period but for the freeze, this abated tax amount would be repaid to New ork City if the ualified lower-income homeowners elected to sell their relevant property during the five-year freeze period. . For example, if the annual property tax was $3,000 at the outset of the five-year period, because of the increase in property value post-greening, $30,000 of taxes would be abated during this five-year freeze period and would be owed by the homeowner to New ork City if they decided to sell within the five-years. Importantly, this tax freeze
does not force a lower-income homeowner living adjacent to an urban greening project to move but, instead, incentivizes a homeowner to avoid displacement during the five-year freeze period. After the five-year freeze period, the lower-income homeowner’s property taxes should increase by no more than 2% per year. This annual tax increase cap should substantially alleviate economic displacement pressures for residents on fixed budgets.
There are several reasons why this property tax stabilization program might not be an effective policy. First, if the number of homeowners, as opposed to renters, is small in an area, then the freezing of property taxes will not substantially alter displacement. Second, the increases in property value associated with owned homes might be so great that homeowners that ualify for the tax stabilization policy will agree to take immediate profits and relocate. Third, it may well be that many residents who relocate to the reinvested neighborhood will uestion the fairness of allowing incumbent lower-income homeowners to pay a lower property tax. ather than increasing community cohesion, in this case, this policy decreasing community displacement may trigger a political backlash to e ualize the sharing of tax burdens. All that said, New ork City has extensive experience with rent control, and this property tax stabilization initiative should be viewed as an extension of such policies.
Today, on a global scale, city and regional planners are having to consider numerous measures, including urban greening, to offset the effects of global warming. Urban greening, while generally laudable, has the unintended conse uence of dislocating lower-income homeowners and renters. Scholars, such as Jennifer Jettner, note that community gardens do not automatically benefit everyone e uitably, even when located in low-income neighborhoods and that their emergence often results in gentrification and lower-income resident displacement. Implementation of this property tax stabilization program in New ork City will substantially mitigate displacement pressures on lower-income homeowners in urban greening areas. hile this program will not immediately benefit all lower-income residents experiencing
greening initiatives (such as renters), it is an important first step in promoting development without displacement and, together with the alk to a Park initiative, can meaningfully improve ecological and community health in New ork City. If successful, this initiative will create a platform for further policies to assist lower-income residents experiencing displacement pressures that result from urban greening.