
BOSTON CONDO MARKET REPORT
DEAR FRIENDS AND COLLEAGUES,
The Boston condominium market experienced a modest decline in sales activity in Q2 2025, with closings down approximately 6.2% year over year and 8.4% below Q2 2023 levels. While this suggests a slowdown in transactional volume, the comparison is influenced by the significant delivery of Winthrop Center in Q2 2023 and Nevins Hill in Q2 2024, which temporarily boosted closings in prior years.
Developers continue to navigate elevated construction costs and uncertainty surrounding the impact of tariffs introduced during President Trump’s first six months in office. By the end of Q2, however, many tariffs had been implemented, providing slightly better clarity around future project budgeting. As a result, developer sentiment has begun to improve, and we are seeing early movement toward the potential launch of new communities in 2026. The stock market experienced a sharp decline in early April—the largest since the onset of the COVID-19 pandemic— driven largely by tariff-related concerns. Encouragingly, markets recovered and ended Q2 2025 in positive territory, helping restore broader economic confidence.
Interest rates remain a major factor in market behavior. The Federal Reserve continued to hold rates steady throughout the first half of 2025, which kept many buyers cautious and left developers balancing borrowing costs with pricing strategies. Rates did see a slight reduction from late Q1 to late Q2, with additional policy changes possible following several scheduled Fed meetings in Q3.

Inventory increased 9.6% compared to the end of Q2 2024. This upward movement in supply—combined with softer demand—has contributed to mild price adjustments and an increase in days on market. The ongoing supplydemand imbalance continues to challenge affordability and slow buyer urgency.
We anticipate gradual momentum returning through the second half of 2025. Continued incremental reductions in interest rates would support improved conditions for both buyers and developers. While the market is more balanced than in 2024, it has not yet returned to the strength observed in early 2023.
Our full report offers a detailed quarter-over-quarter analysis comparing Q2 2025 with recent years and further highlights emerging opportunities as market conditions stabilize.
Navigating an ever-changing landscape together,
Janice
Q2 SALES RECAP
Number of Sales by Quarter
Highlights: Q2 2023 recorded the highest number of sales, largely driven by the delivery of Winthrop Center (23 closings), Cadence on Leo (44 closings), and 30 Penn (30 closings). Comparing Q2 2024 to Q2 2025, sales in 2024 were approximately 6% higher. This increase is partly due to Nevins Hill Way in Brighton, which began closings in Q2 2024. The delivery of 1515 Commonwealth Ave in Brighton continued into Q2 2025 and accounted for 13 sales.
HISTORICAL INTEREST RATES
Historical Interest Rates By Quarter (Freddie Mac)
Highlights:
Comparing quarter over quarter, 30-year interest rates were 6.86% at the end of Q2 2024 and slightly lower at 6.77% by the end of Q2 2025. Interest rates remain below their peak in Q4 2023, when the average 30-year rate reached 7.3%. By Q2 2025, the average rate had fallen to 6.79% for buyers with excellent credit scores and strong borrowing histories. 0
INTEREST RATES AND SALES COMPARISON
Mac)
Highlights:
As shown in this graph, there is a direct correlation between interest rates, sales/market demand, and supply. Interest rates also affect developers’ construction loans and related costs, causing hesitation about the timing of market entry. The spike in interest rates in Q3 2022 significantly impacted sales through Q4 2022 and Q1 2023—typically the two slowest sales quarters each year—as rates continued to rise until peaking in Q4 2023.
NEIGHBORHOOD STATS
Q2 2024 vs. Q2 2025
BACK BAY
HILL
EAST BOSTON
BAY VILLAGE
FORT POINT
JAMAICA PLAIN
LEATHER DISTRICT
Highlights:
Out of 20 neighborhoods, 11 showed an increase in average price when comparing Q2 2025 to Q2 2024. Fort Point saw the largest increase, driven by Q2 2025 sales of $1.8M and $2.39M. Charlestown experienced a 19% decline in sales volume from Q2 2024 to Q2 2025, while the average sales price rose by 9%. In Q2 2024, approximately 62% of sales were under $1M, compared to 48% in 2025. The 2025 data also included higher-end transactions at $2.5M and $2.775M, contributing to the increase in average price.
NEIGHBORHOOD STATS
Q2 2024 vs. Q2 2025
MIDTOWN
NORTH END
SEAPORT DISTRICT
SOUTH BOSTON
SOUTH END
WATERFRONT
WEST END
THEATER DISTRICT
TOP 12 BUILDING SALES
New Construction Condo Buildings Actively Selling in 2025


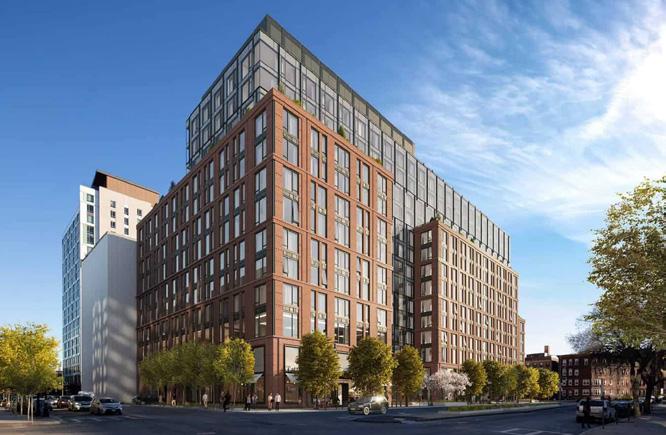
The delivery of 1515 Commonwealth continued in Q2 2025 and had 13 market-rate closings. The Ritz Carlton South Station now shows 11 homes under agreement in MLS. The start of closings in the coming months will provide clearer insight into the number of pre-sales, including those taken off-market, and the sales prices.
TOP 12 BUILDING SALES
SALES BY UNIT TYPE
Highlights:
Q2 2025 saw a decrease in average prices for studio, one-bedroom, two-bedroom, and five-bedroom homes. Studio prices dropped by 15% year-over-year. In 2024, studio sales included high-end units at Raffles priced at $1.3M and $1.489M. By contrast, 2025 had no studio sales above $700K, with several under $400K and under 400 square feet.
The most significant decline was in five-bedroom homes, which saw a 57% drop in average price from Q2 2024 to Q2 2025. However, this decrease can be explained by differences in location, square footage, and building type. In 2024, the two five-bedroom homes sold were larger (3,000–4,000 SF), located in the Back Bay and Waterfront, and sold between $4.5M and $4.8M. In 2025, the five-bedroom sales were smaller—averaging 2,700 SF—and located in East Boston, Jamaica Plain, South Boston, and Charlestown, with prices ranging from $950K to $2.775M.
SALES BY PRICE RANGE
Q2 2024 vs. Q2 2025
Highlights:
Overall sales in Q2 2025 declined by approximately 6% with the most notable drop seen in homes priced over $3M, which experienced a 31% decrease compared to Q2 2024. Even though the number of sales went down by 31 for homes under $1M, it is still only a 6% drop.
MILLION DOLLAR MARKET
Highlights:
Even though the number of sales under $1M has declined year over year, the percent of sales under $1M has remained stable when compared to total number of sales in each quarter.
As seen above, sales in higher price brackets ($2M and above) accounted for 12% of quarterly sales in 2024 and 2025, a slight uptick from 2023.
END OF QUARTER INVENTORY
By Price Range ($500K+)
Highlights:
Inventory has increased by 9.6%, and average days on market is up 17% when comparing 6/30/24 to 6/30/25. The decline in both median and average prices suggests that either more lower-priced homes are entering the market, or sellers are becoming more realistic regarding their list price. With listings and days on market rising while prices soften, it signals a shift toward a buyer’s market.
THINGS TO WATCH IN 2025 – BOSTON CONDO MARKET OUTLOOK
The Boston condominium market experienced a slight decline when comparing Q2 2025 to both Q2 2024 and Q2 2023—driven primarily by ongoing uncertainty around interest rates and development costs. However, several forward-looking trends will help determine how the remainder of 2025 plays out.
1. Market Resilience
Boston’s condo market continues to benefit from a strong jobs base and stable buyer demographics. The finalization of new tariffs in Q2 has begun to provide more predictability in construction and development pricing. As costs stabilize, the critical question is whether pricing will realign with buyer expectations—or if affordability constraints will continue to temper momentum.
2. Interest Rates
Rates edged slightly lower from the end of Q1 into Q2 2025, but the Federal Reserve has yet to issue a meaningful cut. Market attention now turns to the Fed’s upcoming Q3 decisions, which may determine the strength of the Fall market. Lower rates could bring buyers off the sidelines and encourage developers to restart delayed projects. Will the Fed provide the relief needed to unlock the next growth cycle?
3. Inventory Levels
Inventory remains low by historical standards—still under 6 months of supply—though up roughly 9% year-over-year. Rising days on market and slight price adjustments indicate a more balanced environment. The key question: Will improved inventory be enough to drive an increase in closings in Q3, or will sellers need to revisit pricing more aggressively?
4. Buyer Engagement
Sales volume declined year-over-year in Q2 2025. Buyer psychology now becomes central: Will demand return out of necessity, or will buyers continue to make highly selective decisions focused on location, lifestyle, and long-term investment value rather than short-term conditions?
5. Upcoming Developments
Several developments previously paused amid economic volatility may begin reactivating. A notable property, 1515 Commonwealth, delivered in January and saw 13 closings in Q2. If developer confidence improves, more opportunities could emerge for buyers seeking new-construction product.
6. Under Agreement Volume
At the end of Q2, approximately 120 homes under agreement across select neighborhoods – similar to Q2 2024 levels. Many of these reflect pre-sales in new buildings that will register in later quarters. Meanwhile, “shadow sales” not logged in MLS may point to stronger demand than public data suggests.
Final Thought:
The remainder of 2025 is poised for cautious progress. Outcomes will hinge on interest-rate policy, developer activation, and whether buyers perceive this moment as an opportunity—or a time to wait for clearer signals.
WORKS CITED
This report’s Urban Data Neighborhoods include: Allston, Back Bay, Bay Village, Beacon Hill, Brighton, Charlestown, Chinatown, East Boston, Financial District, Fort Point, Jamaica
Plain, Leather District, Midtown, North End, Seaport District, South Boston, South End, South Station, The Fenway, Theatre District, Waterfront, and West End.
Data includes publicly available sales and listings from MLS and Registry of Deeds.