
JANE COLE
SELECTED WORKS 2022-2024 jc5708@columbia.edu
CONTENTS
Architectural
K-12 NYC DOE Schools (2019-20)
% Students in Temporary Housing per Census Tract (2019-20)
School District Boundaries (2019) Sources:
EXPLORING STUDENT HOMELESSNESS IN THE BRONX
Columbia University GSAPP
Geographic Information Systems
Professors: Jonathan Stiles & James Piacentini
Fall 2023
According to Advocates for Children of New York (AFC), there were 119,320 New York City students unhoused during the 2022-2023 school year. This number represents approximately one in nine children enrolled in public schools, and marks the eighth consecutive year in which the homeless student population in New York City exceeded 100,000. The AFC report defines homelessness in this context according to the federal McKinney-Vento Act of 1987, which characterizes unhoused students “as those who lack a nighttime residence that is fixed, adequate, and regular...” Given the pressing nature of this crisis—and the Department of Education’s (DOE) narrow capacity to address the issue— there is opportunity to employ spatial analysis to identify schools and school districts within the Bronx (confirmed as the borough with the fastest growing homeless student population) bearing the greatest burden of this crisis. The broad goal of this study (excerpted here) is to identify these affected school districts and schools to, in theory, guide future funding and policy efforts.
All maps created in ArcGIS Pro and edited in Adobe Illustrator
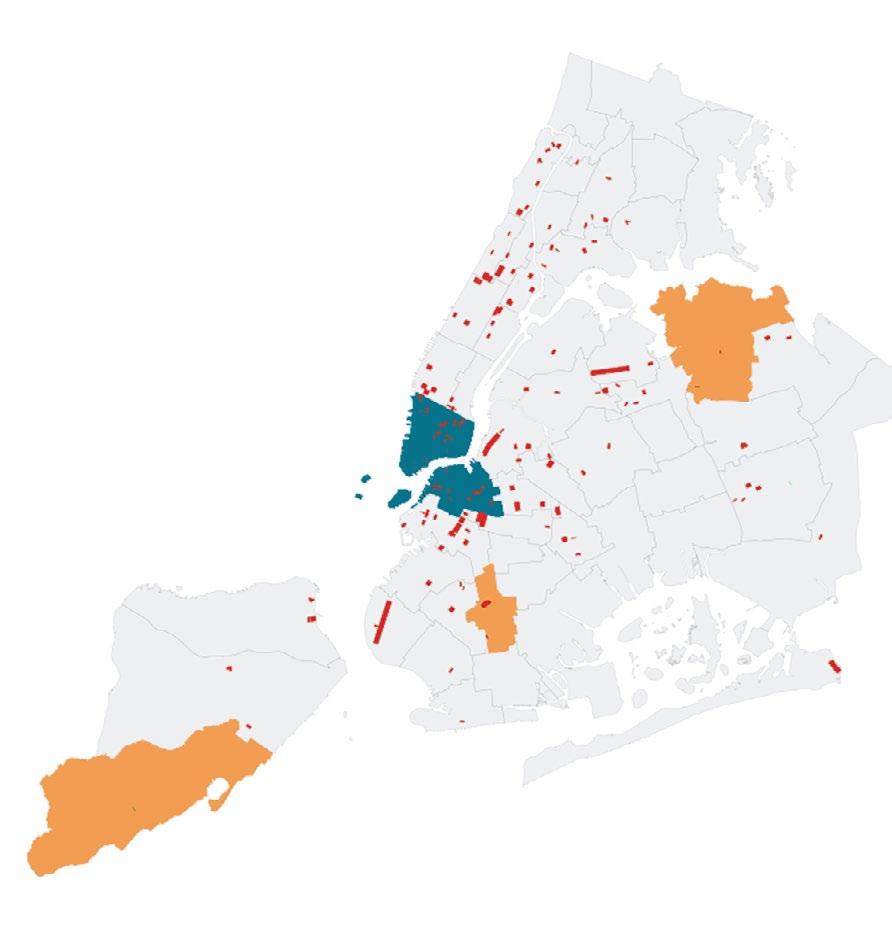
How does the concentration and number of students in temporary housing in the Bronx during the 2019-2020 school year compare to the other four boroughs?
% Students in Temporary Housing per Census Tract (2019-20) 3-30
1 Dot= 20 Students in Temporary Housing (2019-20)
School District Boundaries (2019)
Census Tracts (2019)
Roughly 16% of K-12 students in the Bronx resided in temporary housing during the 2019-20 school year
This equates to 15,530 students total
Manhattan: 12%; 7,660
Brooklyn: 10%; 15,665 total
Queens: 6%; 14,644 total
Staten Island: 3%; 1,789 total
Sources: U.S. Census Bureau (2019), NYC DCP (2019), NYC DOE (2019-20)
Socioeconomic & Demographic Context
Pertinent Demographic Characteristics of the Bronx per Census Tract (2019)
Total population: 1.47 million
Total K-12 school enrollment: 32,033
Poverty rate: 26.4%
In order to establish a basic understanding of the demographic makeup of the Bronx, I pulled various American Community Survey 2019 5-Year Estimate datasets to visualize key demographic characteristics per Census tract via thematic maps. These characteristics include percent population Hispanic or Latino, Black, white, living below the poverty level, graduated from high school, and foreign born. Showing the distribution of the foreign born population in the Bronx seemed particularly relevant to this study, considering the intersection between the student homelessness and migrant crises. Additionally, I created a thematic map depicting school enrollment in the Bronx per Census tract; this is a dot density map due to the fact that it uses raw counts rather than percentages. All maps display greater concentrations of vulnerable populations (people of color, people living in poverty, low educational attainment, foreign born) in the south Bronx; this area is also home to larger K-12 student body populations.
RESEARCH QUESTION
1: Which Bronx School District had the greatest concentration of K-12 public school students in temporary housing during the 2019-2020 school year?
NYC DOE School District 9
Roughly 21% of students in District 9 resided in temporary housing during the 2019 -2020 school year
2:


CIVIC SCHOOL(S)
Columbia University GSAPP
Core Studio II
Critic: Esteban de Backer
Spring 2023
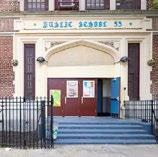
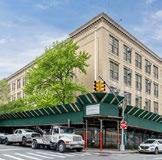
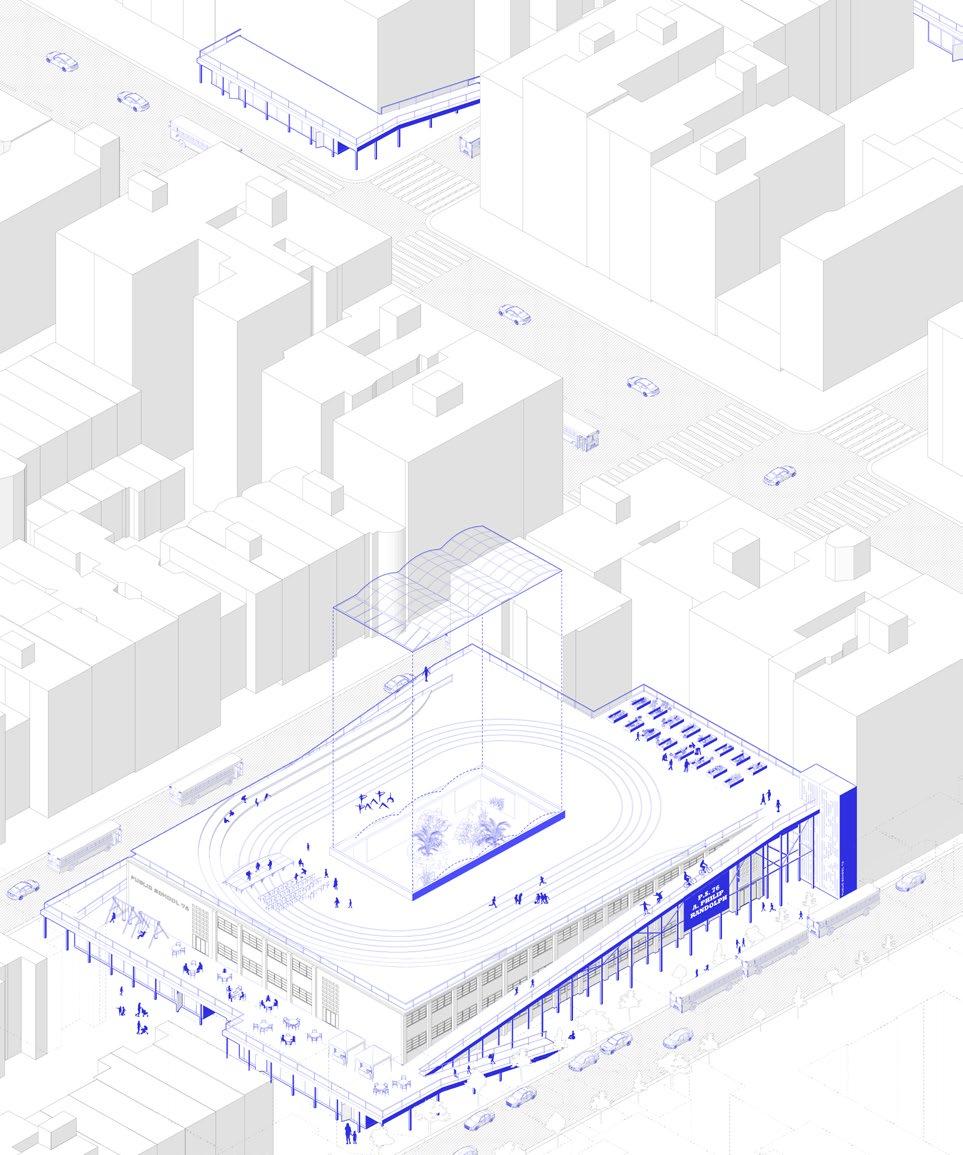
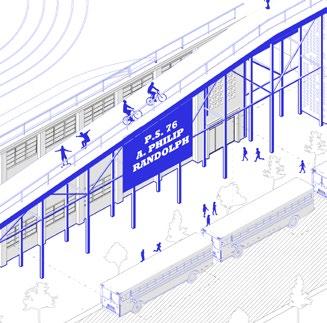
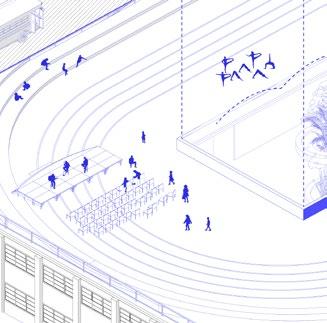
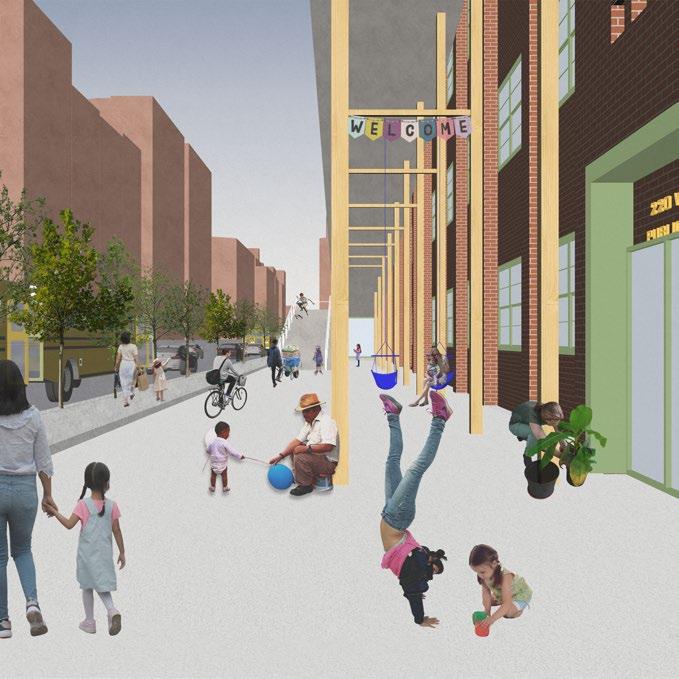
This project (which informed the research and mapping above; pp. 1-4) investigates how New York City public school facilities could be augmented to better serve students experiencing housing instability. Using P.S. 76 in Harlem as a case study, the project proposes a series of exterior looping ramps and attached additions that would serve as an intermediary between the school and surrounding community, offering 24 hour accessible space for students, families, teachers, and community members. The ramps are intended to invite the streetscape into the school, and ultimately expand the school’s civic presence in Harlem. Similar interventions would be added to neighboring schools, thus establishing a network of support and mentorship for students and families across school districts. The proposal seeks to imagine how schools might expand their civic presence and engagement, allowing students (regardless of housing status) to establish a support system and community that extends beyond their student body and beyond the hours of the typical school day.
Exploded axonometric and details

Change in Demographic and Socioeconomic Characteristics (from 2018 to 2021) of PUMAs with the 3 Highest and Lowest Percent of Open Street Coverage
Battery Park City, Greenwich Village & Soho
Minority Population: NA
Median Household Income: -4%
Median Gross Rent: 64%
Chinatown & Lower East Side
Minority Population: 3%
Median Household Income: 3%
Median Gross Rent: 4%
Tottenville, Great Kills & Annandale
Minority Population: NA
Median Household Income: 16%
Median Gross Rent: 0%
Sources: U.S. Census Bureau, NYC Department of Transportation (DOT), NYC Department
Flushing, Murry Hill & Whitestone
Minority Population: -4%
Median Household Income: 13%
Median Gross Rent: 9%
NYC OPEN STREETS AND NEIGHBORHOOD FINANCIAL HEALTH
Columbia University GSAPP
Introuduction to Urban Data and Informatics Professor: Gayatri Kawlra Group project with Sojung Kim and Andrea Sze
Brooklyn Heights & Fort Green
Minority Population: 6%
Median Household Income: 10%
Median Gross Rent: 15%
Queens Village, Cambria Heights & Rossedale
Minority Population: 1%
Median Household Income: 6%
Median Gross Rent: 9%
Open Street Locations
Highest Percentage of Open Street Coverage
Lowest Percentage of Open Street Coverage
Department of Consumer and Worker Protection (DCWP)
The aim of this study is to assess the impact of the NYC Open Streets program (introduced at the onset of the COVID-19 pandemic in an attempt to promote economic and social revitalization) on the overall financial health of the neighborhoods in which they are situated. The Neighborhood Financial Health Index (NFHI), a measure of Public Use Microdata Areas’ (PUMAs) economic advantages and vulnerabilities, provides a useful framework for this assessment. Using a conglomeration of economic and demographic data from myriad city agencies and other sources, the Index assigns an overall financial health score (on a scale of 1 through 10) to each PUMA, as well as five subscores belonging to distinct goals: Financial Services, Goods & Services, Jobs & Income, Financial Shocks, and Build Assets. The Index includes two datasets, one for 2018 and one for 2021, which when compared alongside one another, give insight into neighborhood financial health pre and post pandemic. All data was analyzed and maps were produced using Python.
Map 1 | I was responsible for data collection and cleaning in Python, as well as layout of text and legend in InDesign
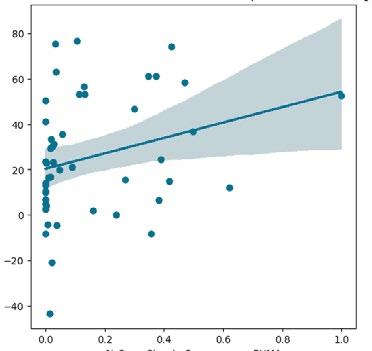
% Change in NFHI Jobs and Income Score 2018-21 vs. % Open Streets Coverage per PUMA

% Open Streets Coverage per Puma
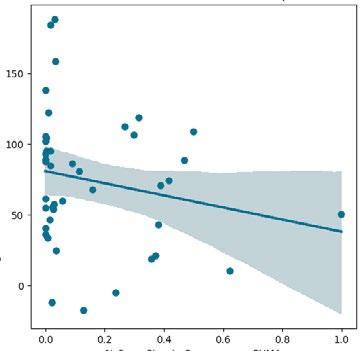
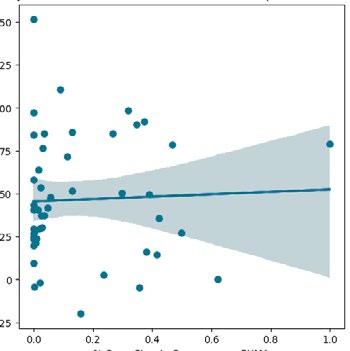
% Change in NFHI Financial Shocks Score 2018-21 vs. % Open Streets Coverage per PUMA

% Open Streets Coverage per Puma
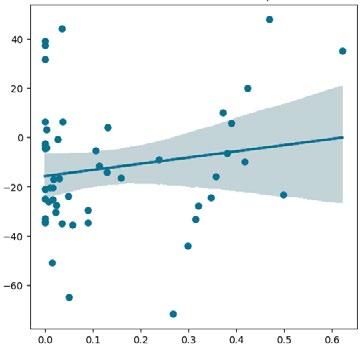
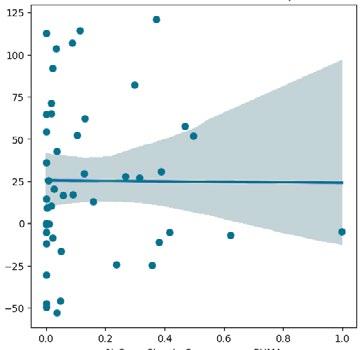
OLS Regressions were conducted and correlations were plotted to identify any influence that Open Streets coverage per PUMA may have on the percent change in NFHI (for overall score and each of the five goals’ scores). Based on the correlations, there seems to be a negative correlation between Open Street density and Goal 1: Financial Services and Goal 3: Goods and Services, while Goal 2,4, and 5 had a more positive correlation with Open Street density. With the R2 values for the fives goals ranging from 0 to 0.037, it can be concluded that open street density per PUMA accounts for a small proportion of the variance in the percent change in the five goals. However, the Overall Score has an R2 value of 0.082 and a p-value < 0.05. Despite the limited data, there seems to be an interesting correlation between percent change in NFHI Overall Score and percent change in Open Streets ccoverage. Additional data collection over time may provide further insight on the relationship between financial health and Open Streets.
OLS Regressions | I was responsible for data collection and cleaning in Python
STRATEGIC SOIL
Columbia University GSAPP
Core Studio I
Critic: Patricia Anahory
Fall 2022
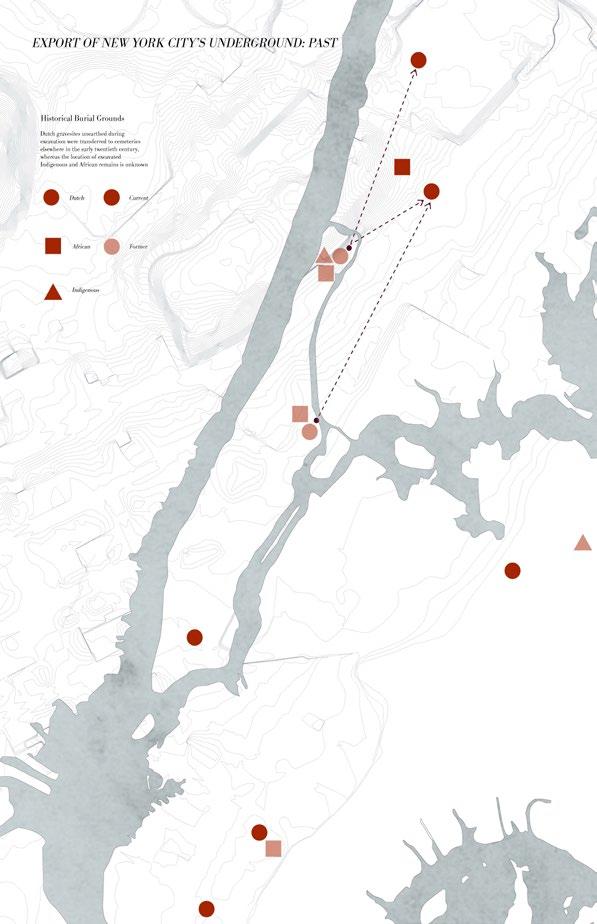
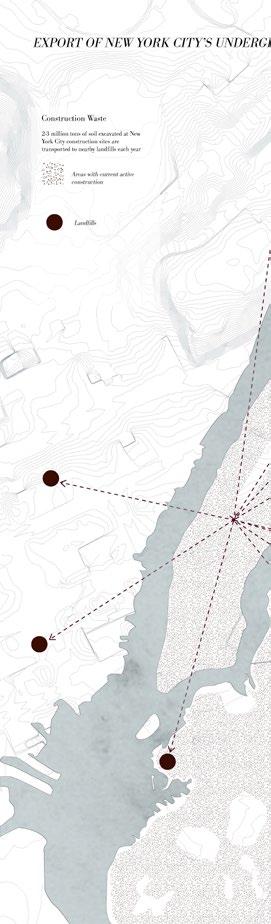
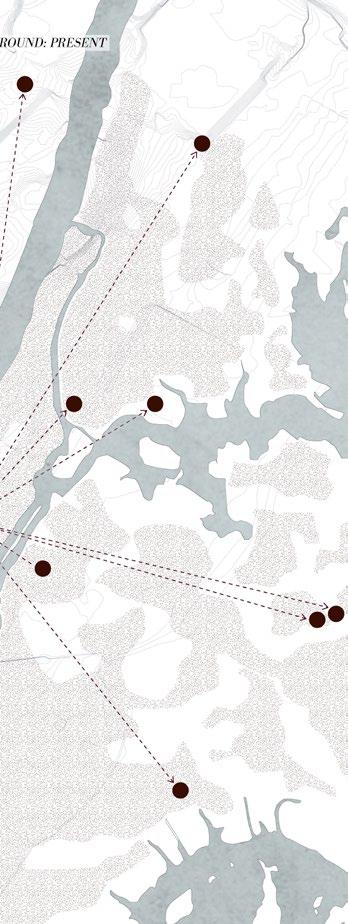
This project explores the history of the underground— and excavation into the underground—in Manhattan’s northernmost neighborhood of Inwood. There are records of three historical burial grounds in Inwood, none of which are still in existence: one belonging to the Indigenous Lenape people, one belonging to Dutch colonizers, and one belonging to the African people that the Dutch enslaved. As New York City contractors began ground leveling in Inwood in the early twentieth century, these burial grounds were excavate and discarded. Presently, substantial rezoning of Inwood has ushered in significant new construction in the same territory where the burial grounds once lay. Despite the fact that the ground excavated will contain large quantities of valuable soil, the soil will nonetheless be exported out of New York City and discarded in landfills, just as the excavated graves were in the early twentieth century.
Site analysis maps | Comparison between the excavation and dispersal of New York City Indigenous, African, and Dutch burial grounds with that of construction soil.
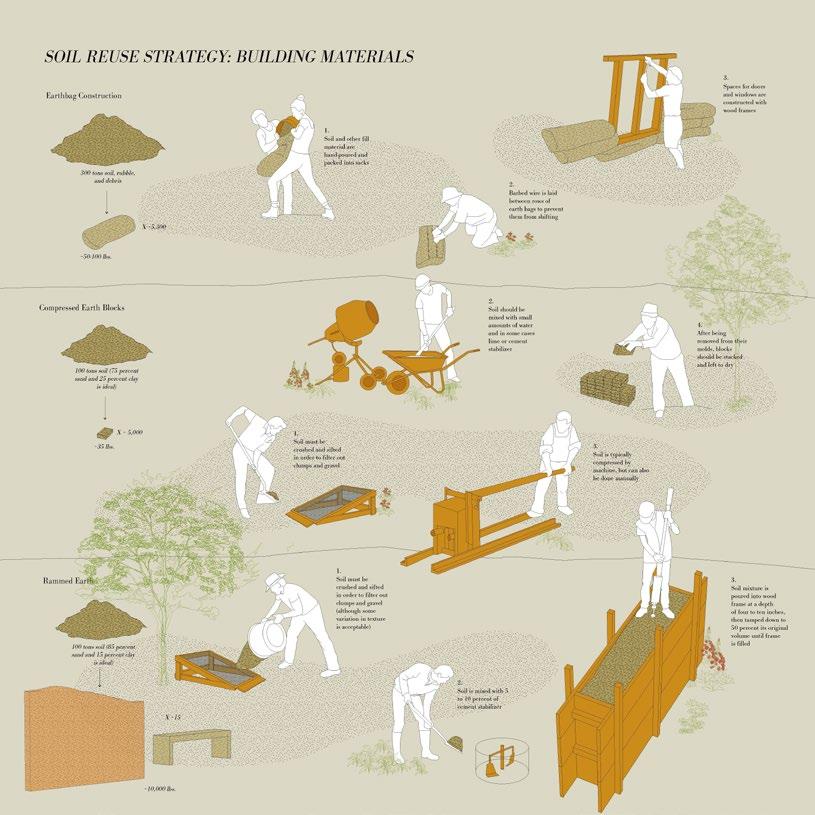


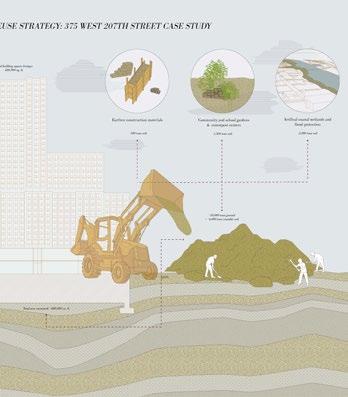
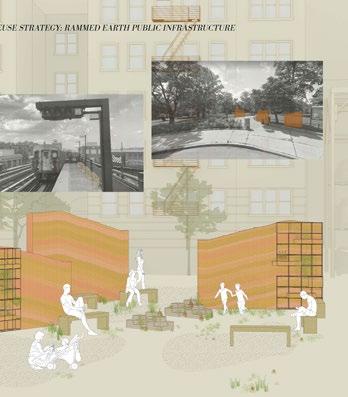
Strategy diagrams | The project proposes a strategy for ensuring that Inwood’s excavated soil remains in Inwood in the aftermath of future construction projects. Using 375 West 207th Street—a high rise planned for construction in 2023—as a case study, detailed calculations show how excavated soil could be redistributed; some may be used for the construction of artificial coastal wetlands and flood protection barriers along Inwood’s eastern waterfront, some could be used to create earthen construction materials such as earth bags and compressed earth blocks, and the remaining soil would be repurposed for rammed earth public infrastructure, including benches and park dividing walls (lower right). The benefits of such a strategy would be manifold: to marginally reduce construction waste and carbon emissions resulting from the transportation of this waste to landfills, and to correct for the historical erasure of Inwood’s underground.
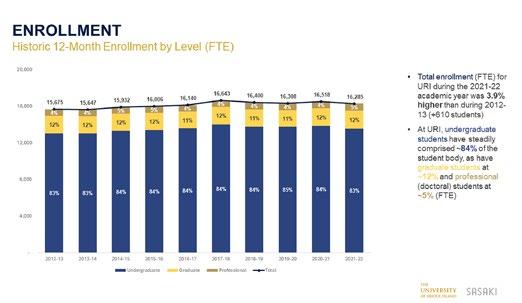
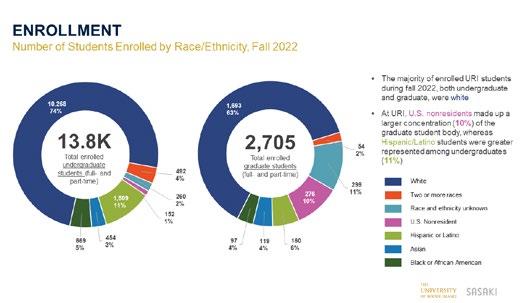
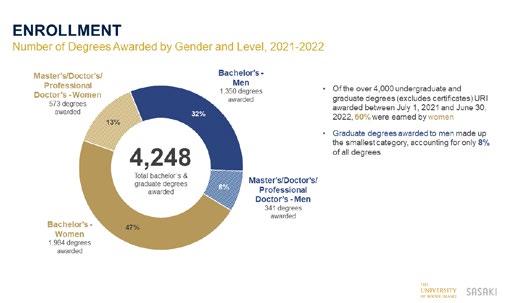
Slides (used in presentation to client) showing analysis and summary of URI enrollment data (above)
PLACEHOLDER TEXT
WORK SAMPLES: SASAKI ASSOCIATES, INC.
Project Manager: Dorothy MacAusland
Principal-in-Charge: Tyler Patrick, AICP
Summer 2024
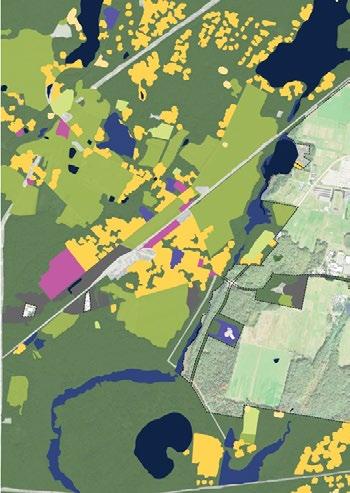
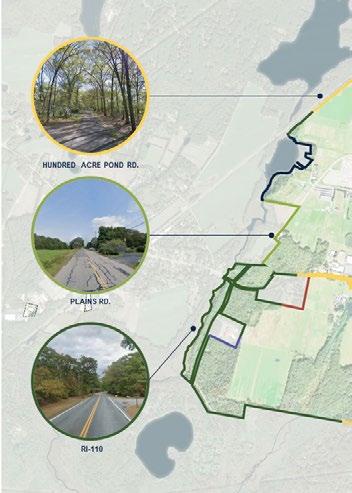
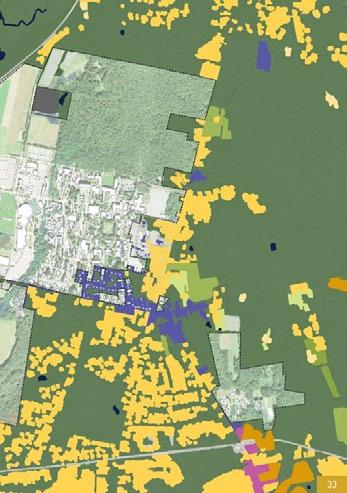
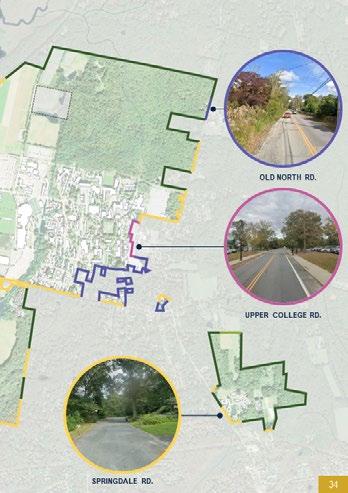
During my summer internship with Sasaki’s Planning + Urban Design practice group, I contributed to multiple master planning projects—many of which were for university campuses—by producing both graphic and written material for clients. Seeking to understand the historical and current contexts that have informed these campus’s development, I performed both qualitative and quantitative analysis; this involved recording, analyzing, and summarizing feedback from engagement workshops and surveys, analyzing and visualizing student body demographic data, and creating maps and diagrams representing campus conditions. The images here were produced for Phase 1 of the University of Rhode Island (URI) Campus Master Plan project, providing insights into the shifting demographics of the university (left), as well as land use and edge conditions surrounding the physical campus. These insights were harnessed to inform planning recommendations intended to meet the evolving physical and social needs of the campus community.
URI surrounding land use (above); URI campus edge conditions (below)
