Solution Manual for Interactive Statistics (Classic Version),
3rd Edition, Martha Aliaga
Fullchapterat:https://testbankbell.com/product/solution-manual-forinteractive-statistics-classic-version-3rd-edition-martha-aliaga/
Interactive Statistics 3rd Edition: Chapter2 Full Solutions
2.1
35% is a parameter – it is a numerical summary of the population. 28% is a statistic
it is a numerical summary of a sample from the population.
2.2
(a) The value of 9% is a parameter – it is a numerical summary of the population.
(b) The value of 12.5% is a statistics – it is a numerical summary of a sample from the population.
2.3
The proportion of register voters in Ann Arbor who would vote “Yes” on Proposal A is an example of (c) a parameter.
2.4
(a) The population consists of (the planned vote for) the 100 U.S. Senators.
(b) N = 100.
(c) The sample consists of (the planned vote for) the ten selected U.S. Senators.
(d) n = 10.
2.5
For a simple random sample of n = 200 and the number of items that were defective = 5. All we can say is that (c) the percent of defective items in the sample is 5/200 = 2.5%. p $ = 5/200 = 0.025 or 2.5%.
2.6
(a) 22.4.
(b) 19. No.
(c) 22.5. No. No.
(d) 18 and 21. The sample mean age is 19.5. 18 and 26. The sample mean age is 22. 20 and 27. The sample mean age is 23.5. 20 and 21. The sample mean age is 20.5. 20 and 26. The sample mean age is 23. 27 and 21. The sample mean age is 24. 27 and 26. The sample mean age is 26.5.
2.7
(a) The value of 34 is a statistic.
(b) Response bias.
2.8
(a) Statistic since the 54% is a sample percentage, not of the population.
(b) Nonresponse bias.
2.9 Response bias.
2.12
False. When only 272 out of 1000 people respond, for a 27.2% response rate, this results in nonresponse bias.
2.13
The best answer is (c).
2.14
Results will vary.
(a) Using the calculator with a seed value of 291, the selected persons are 39 (79 years old), person 3 (75 years old) and person 24 (70 years old). The average age is 74.67 years.
(b) 22 (36 years old), 34 (89 years old) and 29 (89 years old). The average age is 71.33 years, different from the mean calculated in part (a).
(c) 69.19 years.
(d) 74.67 and 71.33 are statistics, while the mean in part (c) is a parameter.
2.15
(a) Yes, each sample of size 20 has the same chance as any other sample of size 20 to be selected (assuming all tags are exactly the same and the box is thoroughly mixed).
(b) It is drawn without replacement.
2.16
(a) 12/100.
(b) With the graphing calculator the selected employees are: 77, 51, 72, 40, 71, 42, 17, 34, 62, 23, 35, and 12. From the random table the selected employees are: 7, 5, 69, 76, 28, 33, 78, 70, 99, 98, 42, and 80.
2.17
(a) H0: The population proportion of dissatisfied customers equals 0.10. H1: The population proportion of dissatisfied customers is less than 0.10.
(b) With the calculator the selected customers are: 34318, 15553, 8461, and 614. With the random table the selected customers are: 15409, 23336, 29490, and 30414.
(c) Type II error.
(d) 0.21.
(e) No, the p-value is > 0.05.
(f) (ii) Statistic.
2.18
Using the TI: Label the sites from 1 to 80. With a seed value of 29 the five labels, and thus sites, selected at random are as follows: Sites #50, #66, #43, #49, and #74. Using the Random Number Table: Since there are more than 10, but less than 100, sites, we can use double-digit labels, such as 01, 02, 03, through 80. With Row 10 of the table, starting at Column 1, the simple random sample of sites consists of sites #47, #53, #68, #57, and #34.
2.19
Stratified random sampling. You are dividing up your population by class rank then selecting 100 students from within each stratum at random
2.20
(a) Stratifying by declared major (field of study) would be a good stratification variable. The cost of textbooks is likely to vary from one field of study to the next, but not vary as much within a particular field of study (many students have to take the same basic classes for their field of study and hence may be paying similar textbook costs.) You would also learn about the costs for each field of major as well as costs overall.
(b) Stratifying by gender may not be as useful as a stratification variable. The cost of textbooks may vary a lot for females and vary a lot for males, and there may not be much variation between males and females However, if you wanted to learn about the costs for each gender as well as overall, you might wish to stratify by gender.
(c) Stratifying by class rank may be useful as a stratification variable. The cost of textbooks may vary from one class-rank to another. However, there may be quite a lot of variation within each class-rank as well. If you wanted to learn about the costs for each class-rank as well as overall, you might wish to stratify by class-rank.
2.21
(a) 45 8th-grade students; 25 10th-grade students; 48 12th-grade students. For a total in the sample of 118 students.
(b) With the calculator the selected students are: 193, 127, 430, 100, and 427. With the random number table the selected students are: 241, 304, 22, 364, and 151.
2.22
(a) 100/200 = 1/2 = 0.50 or 50%.
(b) 100/1000 = 1/10 = 0.10 or 10%.
(c) The chance of being chosen is 0.10. This is NOT a simple random sample. For this stratified random sampling plan each possible sample would contain exactly 100 males and 20 females. All samples of size 120 are not equally likely (as it should be for simple random sample). Some samples of size 120 are not even possible, for example, having 120 males.
2.23 We
2.24
(a) 20/200 = 0.10.
(b) With the calculator the first five females selected in the sample are: 132, 195, 147, 171, and 85. With the random number table: To each woman we assigned 5 numbers, for example 1, 201, 401, 601 and 801. The numbers from the table were 521, 625, 391, 646, and 369. So the first five selected females are: 121, 25, 191, 46, and 169.
(c) The weighted average is: (0.75)8 + (0.25)5 = 7.25.
2.25
(a) Stratified random sampling.
(b) With the calculator the first five selected homes are: 386, 81, 379, 211, and 156. With the random number table the first five selected homes are: 94, 299, 396, 378, and 363.
(c) (0.60)(2100) + (0.40)(2600) = 2300 square feet.
2.26
(0.20)(16) + (0.50)(43) + (0.30)(71) = 46 years.
2.27
(a) Stratified random sampling.
(b) With the calculator the first six homes selected from the 1000 homes in County I are: 918, 193, 902, 502, 370, and 5. With the random number table the first six homes selected from the 1000 homes in County I are: 963, 19, 197, 705, 463, and 79 where the homes are labeled 0 to 999.
(c) (0.50)(175) + (0.30)(200) + (0.20)(195) = 186.5 thousands of dollars or $186,500.
2.28
(a) With the calculator, the label of the first student selected is 3. With the random number table, the label of the first student selected is 3.
(b) The students in the sample are those with ID numbers 3, (3 + 4 =) 7, (7 + 4 =) 11, and (11 + 4=) 15, for a total of 4 students.
2.29
(a) With the calculator with the first 100 addresses labeled 1 through 100, the sample is: Addresses = #79, #179, #279, #379, #479. Using the random number table with the first 100 addresses labeled 01, 02, , 98, 99, 00, the sample is: Addresses = #30, #130, #230, #330, #430.
(b) 1/100 = 0.01 or 1% There are 100 possible systematic samples of size 5, each equally likely.
2.30
(a) Stratified random sampling.
(b) No, if there are more people whose family name begins with say A and fewer people whose family name begins with Z, then those with Z will have a higher chance of being selected
(c) Selection bias, a systematic tendency to exclude those with unlisted phone numbers.
2.31
Yes, the chance is 1/5 or 0.20 or 20%. There are 5 possible systematic samples, each equally likely.
2.32
(a) 1/14 = 0.0714.
(b) Note that there are 555 members so 555/14 Æ 39.64 or 39 groups of 14 and one last group of 9. For the 17th member to be selected, the starting point must have been a 3, that is, the 3rd member in each group of 14 is selected. This will result in a sample of 40 members.
2.33
(a) 1/8 = 0.125.
(b) Note that there are 350 members so 350/8 Æ 43.75 or 43 groups of 8 and one last group of 6. For the 300th member to be selected, the starting point must have been a 4, that is, the 4th member in each group of 8 is selected. This will result in a sample of 44 members.
2.34
(a) 1/40 = 0.025.
(b) Using the TI calculator with seed of 19, and with the first 40 members labeled 1 through 40, the first five members are 7, 47, 87, 127, and 167. Using row 15, column 1, and labeling the first 40 members as 01, 02, ... , 39, 40, the first 5 members are 7, 47, 87, 127, and 167.
(c) Note that there are 2220 members so 2220/40 Æ 55.5 or 55 groups of 40 and one last group of 20. Since the starting point was a 7, that is, the 7th member in each group of 40 was selected. This would result in a complete sample of 56 members.
2.35
False, the chance depends on the number of clusters.
2.36
(a) With the calculator, the two departments selected were 2 and 4; Chemistry and Mathematics. Using the random number table, the two department selected were 2 and 3; Chemistry and Biology
(b) With calculator, the sample size is 80. With random number table, the sample size is 90.
2.37
(a) Cluster sampling. The faculty are grouped into departments which serve as clusters. Six of the clusters are selected at random. All of the units in the cluster are in the sample.
(b) Label the list of the 60 departments 1, 2, 3, ..., 60. The numbers generated and thus the departments selected using the TI calculator with seed = 79 are: 54, 37, 49, 5, 15, and 43. If you are using the random number table, you might label the list of the 60 departments 01, 02, 03, , 60. The numbers generated and thus the departments selected starting at row 60, column 1 are: 23, 22, 47, 40, 25, and 37.
(c) Yes we can determine the chance that any specific professor will be selected. The chance of selecting a professor is the same chance that his/her department or cluster will be selected. The reason being if a cluster is selected, every element in the cluster is selected Therefore the probability that a cluster is selected is 6/60 = 0 10, the chance that any specific professor will be selected
2.38
(a) This is cluster sampling since the students are first divided into clusters (undergraduate classes). A class/cluster is then selected using a simple random sample and all students from that class/cluster are sampled.
(b) No, since not all students take the same number of classes. Students who attend more classes have a greater chance of being selected.
(c) No it is not biased since the cluster was selected at random. It is a case of poor design together with bad luck. When clustering the variability between clusters should not be more important than the variability within clusters. Here we have poor design because there might be more variability between a class with many students on athletic scholarship and a class without any, than variability within each of those classes.
2.39
(a) The type of sampling performed in each dorm is cluster sampling, with the rooms forming the clusters and 3 clusters were selected at random from each of the four dorms.
(b) If each cluster selected has one student, we would have 3 students from each of the four dorms for a minimum sample size of 12 students.
(c) If each cluster selected has three students, we would have 9 students from each of the four dorms for a maximum sample size of 36 students.
(d) We do not know, it will depend on how many clusters selected are rooms with women. The number of women could be as low as 0 and as high as 36.
(e) No, there will be anywhere from 3 to 9 freshmen students sampled from the freshmen dorm, as well as from 3 to 9 sophomores, from 3 and 9 juniors, and from 3 to 9 seniors.
2.40
(a) Cluster sampling.
(b) No, if the number of adults per city block is unknown. Yes, if you have the seed value and you know how many adults are in each block.
2.41
(a) With the calculator or the random number table, the selected region is 3 = Southwest.
(b) Stratified random sampling.
(c) (i) 1-in-10 systematic sampling.
(ii) 0.10.
(iii) With the calculator, the first five selected cans are 7, 17, 27, 37, and 47. With the random number table we might label the first can 1, the second can 2, …, and the 10th can 0. Then the first five selected cans are 7, 17, 27, 37, and 47.
(iv) Note that 125/10 = 12.5 Æ 12 or 13 cans. However, there will not be a 7th can to select in last group. Thus the total number of cans in the sample will be 12
(d) (i) No.
(ii) Two possible values are 0.12 and 0.15.
(iii) Yes, a Type II error.
2.42
(a) (i) Convenience sampling.
(ii) Yes, a selection bias.
(iii) The calculated average is expected to be higher than the true average, as all of the books in the sample have already been checked out at least once, and may include some of the more popular books.
(b) Cluster sampling.
(c) (i) Stratified random sampling.
(ii) Overall estimate: (40/1200)(20) + (200/1200)(15) + (600/1200)(10) = 14.2 times checked out.
(d) For each of the three categories of books the following stages are followed.
Stage 1: Divide the books into clusters according to the last digit of the call number (0 through 9). Take a simple random sample of 3 digits from the list of 0, 1, 2, 3, 4, 5, 6, 7, 8, and 9.
The clusters of books (in that category) with call numbers ending with those selected digits are selected.
Stage 2: Within each of the selected clusters of books from Stage 2, select a simple random sample of 7 books. Note that with this multistage sampling plan, we will have a total of 3 categories x 3 clusters x 7 books = 63 books.
2.43
(a) A cluster sampling of blocks.
(b) Yes, the chance is 5/50 = 0.10.
(c) No, we do not know how many households are in each block. Additionally, if the number of households in each block was not the same across all blocks, then we would also need to know which of the 5 blocks were selected.
(d) With the calculator, the five selected blocks are 8, 44, 33, 6, and 38. With the random number table we might label the blocks 01 to 50, then the five selected blocks are 12, 18, 11, 43, and 05.
(e) Response bias because the interviewers are college students. People may not feel comfortable telling these students they want to forbid loud music at parties in the college dorms.
2.44
Answer is (c) statistic is to a sample.
2.45
The proportion 153/200 is a parameter since the instructor polled her entire class and that was the group that she was interested in learning about.
2.46
(a) Population: Adults U.S. residents. The sample size n = 1500.
(b) Population: Today’s shipment of 1-gallon milk cartons. The sample size n = 5.
(c) Population: The 740 members of the local women’s business association. The sample size n = 100.
2.47
Nonresponse bias.
2.48
(a) Selection bias, where the sampling frame is either incomplete (such as sampling only one dealership) or incorrect.
(b) Nonresponse bias, where persons who do not respond to a survey (such as the lazy car owners) may have different opinions to those who do.
(c) Response bias, where respondents may have a tendency to lie (such as car dealerships that believe in lower miles per gallon) or refuse to answer.
2.49
This survey may be subject to nonresponse bias. Only those alumni who respond and report their income will be included. Alumni who perhaps are currently unemployed or in a low paying position may elect not to respond. Therefore, the reported average income based on such a survey may be biased upwards the average may be larger than the actual average for all alumni.
2.50
(a) The sampling design is a simple random sample of size 227 taken from the cocaine users who called.
(b) The population this sample is drawn from is cocaine users who called the National help line between February and March.
(c) The sample is not from the population of workers, but only from those who called the hotline, so the survey results do not generalize to the population of workers. Also, "more people" implies a comparison for which no data were given.
2.51
(a) With the calculator the selected ID numbers are: 179, 2274, and 3327. With the random number table the selected ID numbers are: 2398, 2258, and 3540.
(b) A statistic.
2.52
(a) True. If we fail to reject the null hypothesis, them the population consists of all males.
(b) False.
(c) True.
2.53
(a) Based on her decision rule, Jane rejects H0.
(b) Since Jane rejected the null hypothesis, the data are statistically significant.
(c) No, based on a sample of two $1 Jane can not be certain of which purse she has since both purses contain at least two $1.
(d) Type I error: reject H0 when H0 is true.
(e) Simple random samples of size 2 from null purse: $11 and $12, $11 and $51, $11 and $52 $12 and $51, $12 and $52, $51 and $52
(f) Simple random samples of size 2 from alternative purse: $11 and $12, $11 and $13, $11 and $14 $12 and $13, $12 and $14, $13 and $14
(g) The p-value is the chance of getting two $1 bills or more extreme (in the direction of H0, but in this case, there is no “more extreme”) if H0 is true. The p-value is the chance of getting two $1 bills if H0 is true, i.e., 1/6.
2.54
You first need to label the 4000 signatures. Hopefully no one signed the petition more than one time. If you use a calculator or computer, the labels can simply be 1 to 4000. If you use the random number table, you could label the signatures from 0001 to 4000. Using a seed value of say 29 with the calculator or row 120, column 11 of the random number table, you can proceed to take a simple random sample of 400 signatures.
2.55
Stratified random sampling. You are dividing up your population by gender then selecting your sample within the strata at random
2.56
(a) Stratified random sampling.
(b) 75/416.
(c) (0.20)(15/25) + (0.80)(60/75) = 0.76.
(d) Statistic.
2.57
(a) All former university graduate students.
(b) Stratified random sampling.
(c) False.
2.58
(a) Stratified random sampling.
(b) Selection bias.
2.59
(a) Stratified random sampling
(b) The chance is 0, only 1 of the two fiction books (A, B) will be selected.
(c) Two books that could be selected are Book A and Book C.
(d) Another pair of books that could be selected is Book A and Book D.
(e) The chance that the total number of pages exceeds 800 is the same as the chance that the two selected books are Book B and Book D. There are 4 possible pairs of books that could be selected of which the (B, D) pair is 1, so the chance is 1/4 = 0.25.
2.60
(a) Stratified random sampling.
(b) High: 20 clients, Moderate: 125 clients, Low: 45 clients.
(c) With the calculator the selected clients are: 163, 2196, 214, 2462, 740. With the random number table the selected clients are: 1887, 1209, 2294, 954, and 1869.
2.61
(a) With the calculator the first student selected is 1. With the random number table the first student selected is 1.
(b) The sample size is 6.
2.62
(a) Systematic sampling (1-in-30). Once you select the sample you can determine the number of freshmen you selected. Also knowing the population list you can calculate the number of freshmen you would select for each of the 30 possible samples (depending on the starting point.)
(b) Stratified random sampling. Yes, you would have 25 freshmen.
2.63
(a) (i) 0.02(500)+0.03(1200)+0.05(18000) = 10+36+900 = 946.
(ii) Stratified Random Sampling.
(iii) With the calculator the selected labels are 432, 232, 304, 412, and 372. With the random number table, we might assign the first High category driver the labels 001 and 501. We would assign the second High category driver 002 and 502. This assignment pattern would continue until the 500th High category driver who would be assigned the labels 000 and 500. Reading off labels from row 60, column 1, we have: 789, 191, 947, 423, and 632. This would correspond to selecting the 289th , 191st , 447th , 423rd , and 132nd High category drivers in the list of 500 High category drivers.
(b) (i) With the calculator or the random number table, the first selected label is 15. Thus the selected labels will be 15, 35, 55, 75, 95, and so on.
(ii) Since the 500 High category drivers divide evenly into groups of 20 (500/20 = 25), there will be a total of 25 High category drivers in the systematic 1-in-20 sample.
2.64
(a) 907.
(b) Cluster sample.
(c) (iii) Selection bias.
2.65
These results are based on a study of 125 aerobic classes in five health clubs, not all aerobic classes in all health clubs. Thus, the 60% figure is a statistic and the sample size is n = 125.
2.66
(a) It is a systematic 1-in-45 sampling resulting in 50 students (1 from each of the 50 sections, the 33rd in each of the 50 lists of 45 students).
(b) It is a cluster sample and you cannot know the sample size (number of students selected) because we do not know how many students are in the various major clusters.
2.67
(a) Cluster sampling.
(b) 1/5.
(c) Response bias.
2.68
(a) False.
(b) False.
(c) True.
2.69
(a) A 1-in-40 systematic sample.
(b) 1/40 is the chance that any specific address is chosen since one of the first 40 addresses is picked at random The other addresses are directly linked to that first random pick.
2.70
(a) H0: The population mean increase in the GMAT score is 40 points. H1: The population mean increase in the GMAT score is less than 40 points.
(d) With the calculator the first four selected students are: 209, 218, 7, and 750. With the random number table the first four selected students are: 070, 569, 762, and 833.
(c) (i) A possible p-value is 0.03.
(ii) Reject H0
(iii) Type I error.
(iv) Yes, since the p-value was ≤ 0.05, it would also be ≤ 0.10.
(d) (ii) Statistic.
2.71
(a) Multistage, with the first stage being a cluster sample of 3 lab sections and the second stage being a simple random sample of 25% of the students in the 3 selected labs.
(b) 0.0625.
(c) The 78% is a statistic since it was based on the sample of students surveyed.
2.72
Nonresponse bias is the distortion that can arise because a large number of units selected for the sample do not respond or refuse to respond, and these nonresponders have a tendency to be different from the responders. So nonresponse bias has to do with who responds. Response bias is the distortion that can arise because the wording of a question and the behavior of the interviewer can affect the responses received. So response bias has to do with how the responders answer.
2.73
(a) Since 15 patients were selected with a 1-in-9 systematic sample, there were at least 15 groups of 9 patients each or 135 patients in all.
(b) (ii) Statistic.
2.74
(a) Since there is no prior information, we will sample in proportion to the size of the stratum relative to the size of the population. So the sample size from Stratum I is 3 (since there are 10/40 large facilities in all, 25% of the sample could be large facilities, for 25% of 12 = 3), and the sample size from Stratum II is 12 – 3 or 9
(b) Using the calculator, the stratum I selected facilities and responses are: 7 (Yes), 10 (Yes), 8 (No), and the stratum II selected facilities and responses are: 7 (No), 17 (No), 9 (Yes), 24 (No), 3 (No), 21 (No), 8 (Yes), 12 (No), and 1 (Yes),
Using the random number table we will label the stratum I facilities as: 1 has label 1, Facility 2 has label 2, ... , Facility 10 has label 0. Then the selected facilities and responses are: 2 (Yes), 6 (Yes), 4 (Yes). We will label the stratum II facilities as: 1 has label 01; Facility 2 has label 02; up to Facility 30 has label 30. Then the selected facilities and responses are: 05 (No), 36 (skip), 60 (skip), 42 (skip), 13 (Yes), 25 (Yes), 66 (skip), 92 (skip), 64 (skip), 22 (Yes), ..., 04 (Yes), 06 (No), 20 (No), 12 (No), 18 (Yes).
(c) Using the calculator we have: p ˆ = estimate =
Using the table we have: p ˆ = estimate
(e) In general, estimates may not be exactly equal to p The calculator estimate was slightly too small, while the random number table estimate was too large.
2.75
(a) Answers will vary. See the web site.
(b) Summaries will vary.
OBJECTIVES FOR THIS CHAPTER
• Differentiate between a population and a sample.
• Differentiate between a parameter and a statistic.
• Introduce the concept that values of a statistic vary.
• Understand various ways bias can enter into the results.
• Demonstrate various types of sampling methods.
IDEAS FOR TEACHING THIS CHAPTER
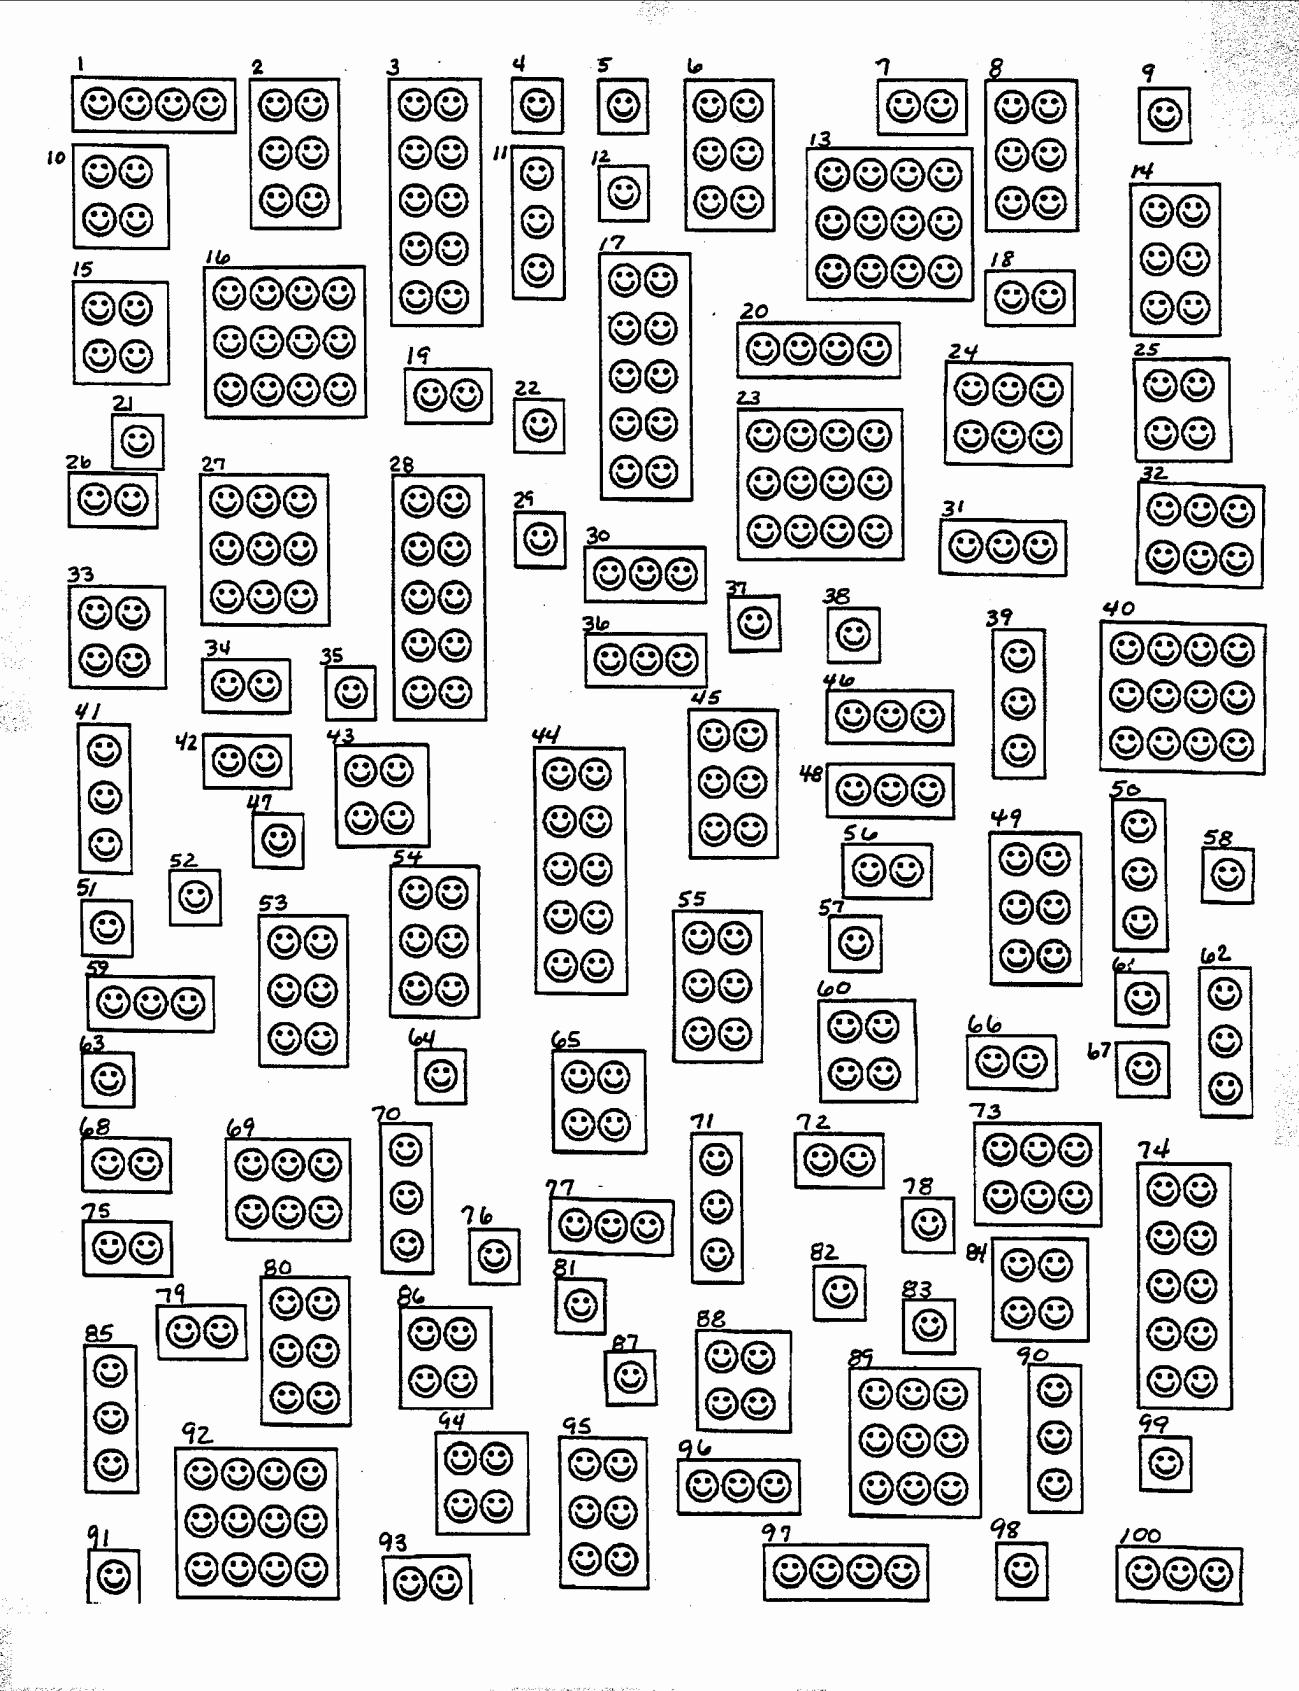
This chapter starts out with a fun activity to do in the classroom the counting the number F’s activity on the first 2 pages of Chapter 2. We suggest that you try to structure your lectures so that you can do this activity towards the end of the lecture that you finish up Chapter 1. If you tell your students to read Chapter 2 for next class and start out the class with the counting F’s activity, many of the students will have read the answer. The activity can take as little as 5 minutes, or it can be extended by adding a quick graphical display of the results. Here is a brief outline for how you might do this activity: You have just finished Chapter 1. Ask your students to close their textbooks. Explain to your students: “I have a task for you. I need your help in counting something. In a moment I will place a sentenceon theoverhead and I want you to count the number of times that a certain letter appears in the sentence. I will give you 10 seconds to complete the task. And I will tell you which letter to count in just a moment, but is everyone clear on the directions? The letter to count is F (as in Frank).” Place the transparency with the sentence on the overhead and quietly count to 10, then remove the transparency. Ask your students: “Please tell me how many F’s were in the sentence.” Gather responses from some students, either volunteers or call on some students. You will certainly get varying answers. As you do, you ask, with a puzzled look on your face, “What happened? How many of you counted 3 F’s? 4 F’s? 5? 6? Anyone else have a different answer? (You could make a quick graph of the results up front.) Were the directions not clear enough? How come, when we took a complete census of a sentence, we did not all get the same value?” The moral to this activity is that a census, a sample consisting of the entire population, is not foolproof. You can then continue with a discussion about additional reasons why a census may not be possible. After a discussion on parameter versus statistic comes the section on bias, which can be enhanced by bringing in some current articles that present some data or study results and discuss possible sources of bias.
In this chapter, the students learn about the various sampling methods by actually doing them sampling their fellow classmates. A few of the Let’s Do It! exercises rely on group work. If in Chapter 1 you have made an effort to have students work together at least in groups of 2 or 3, then forming larger groups for these sampling exercises should come fairly easy. Some of the LDI exercises can take 15 to 20 minutes. Thus it is important to watch the time. For our larger classrooms it is not easy to start a group project and have the exact same groups be able to continue on it at the start of the next class. And if you do not allow for a few minutes to wrap up and recap, the main ideas or features of the LDI exercise can be forgotten. If you spend the time on simple random sampling so students have a good understanding of it, the other sampling methods follow more easily and quickly
This is the first chapter which can make use of a calculator or computer. If you are using a TI-84 graphing calculator, details on how to generate random integers with the TI are presented on page 102 and in the TI Quick Steps appendix which follows the exercises at the end of this chapter (page 144). The steps are fairly straight forward and no data entry is required, so students are not overwhelmed with TI details and options. They become familiar and comfortable with the calculator gradually throughout this text. If you do just one sampling example using the random number table with multiple labels and some labels unused, and then do the same example using the calculator, students see the benefit of using a calculator or computer. The random number generating steps for other TI graphing calculators are similar, and if the same seed value is used, the output should be the same.
Let’sDo It (LDI) Solutions
Let’sDo It! 2.1 Parameter or Statistic?
According to the Campus Housing Fact Sheet at a Big-Ten University, 60% of the students living in campus housing are in-state residents. In a sample of 200 students living in campus housing, 56.5% were found to be instate residents. Circle your answer.
(a) In this particular situation, the value of 60% is a (parameter, statistic).
(b) In this particular situation, the value of 56 6% is a (parameter, statistic).
LDI2.1
How long? 2 minutes
How might it be done? Ask students to read through the scenario (or you read it aloud with the class), complete the choices, and compare with a neighbor. How important? We recommend you do this exercise and/or bring in other examples from recent news to share with the class.
Let’sDo It! 2.2 Is It Biased?
A television show conducted the following opinion poll: Should gun control be tougher? Let us know what you, the public, think in a special call-in poll tonight. If yes, call 1-900-446-6444. If no, call 1-900-446-6445. Charge is 50 cents for the first minute. Would you consider the results of this opinion poll to be trustworthy? Explain.
No. A call-in poll is typically biased because it is based on a volunteer sample. Only those individuals who are watching the program even have the opportunity to call in. Among those who are watching, individuals who have a strong opinion about the subject are more likely to pay the 50 cents to call.
LDI2.2
How long? 2-3 minutes
How might it be done? Ask students to read through the scenario and discuss possible answers with a neighbor. How important? This is a nice, short exercise that reinforces the idea of a voluntary sample. Such call-in polls are common enough, that you may even be on the look out for an actual example to share with the class.
Let’sDo It! 2.3 Family Size
A study was conducted to estimate the average size of households in the U.S. A total of 1000 people were randomly selected from the population and they were asked to report the number of people in their household. The average of these 1000 responses was found to be 4.6.
(a) What is the population of interest? All households in the U.S.
(b) What is the variable of interest? Size of (number of people in) the household.
(c) What is the parameter of interest? Average household size.
(d) An average computed in the above manner would tend to be larger than the true average size of households in U.S. Explain why this would be the case. Larger households have more people in the list, so members of a large household are more likely to be selected.
(e) To better estimate the average size of households in U.S., the units that should be labeled, and thus sampled from, are not the individual people, but rather the households
LDI2.3
How long? 4-5 minutes
How might it be done? Ask students to read through the scenario and discuss possible answers with a neighbor. How important? This exercise reinforces the ideas of population, parameter, and sampling the wrong unit
Let’sDo It! 2.4 A Simple Random Sample of Companies
An investment magazine publishes data on sales, profits, assets, dividends, shares, and earnings per share for the nation’s 500 most valuable companies. You are to select a simple random sample of 10 companies from the list of 500 companies. Explain how you would label the companies and then use your calculator (with a seed value of 53) or the random number table (Row 26, Column 1, reading from left to right) to identify the labels of the 10 companies that would be selected from the list of 500 companies.
With the TI: Label the 500 companies from 1 to 500. Using a seed of 53, the labels of the 10 selected companies are: 258, 182, 473, 435, 198, 251, 122, 481, 372, 14.
With the Table: Give each of the 500 companies 2 labels as follows: Company 1: 001 Company 2: 002 etc ... Company 499: 499 Company 500: 500
Starting at row 26, column 1, the labels of the 10 selected companies are: 815 (skip), 257, 229, 504 (skip), 839 (skip), 964 (skip), 232, 487, 882 (skip), 651 (skip), 665 (skip), 661 (skip), 477, 876 (skip), 797 (skip), 147, 801 (skip), 330, 087, 074, 796 (skip), 669 (skip), 572 (skip), 529 (skip), 676 (skip), 205.
LDI2.4
How long? 5 minutes
How might it be done? Recap the scenario with the whole class. Most of the time we work through this exercise together as the whole class and then have them work own their own in groups for the next LDI 2.5 exercise. Alternatively if, you spent time going over the material from pages 86 to 89, you might have students work with their neighboring classmate on this exercise to practice taking a simple random sample.
How important? Not completely necessary to do in class, but it is a good basic exercise on taking a simple random sample, to reinforce the basic steps. This exercise could be assigned as a homework problem
Let’sDo It! 2.5 Simple Random Sampling
Form a group of 10 students. The population of interest is your group. Your task is to select a simple random sample of size n = 3 from your group.

Steps:
1. In the space provided below, write the names of the people in your group. Labels if using the random number table Labels if using a calculator
0 Susan 5 Matt 1 Susan 6 Matt
1 Martha 6 Linda 2 Martha 7 Linda
2 Peter 7 Kathy 3 Peter 8 Kathy
3 Brenda 8 Karl 4 Brenda 9 Karl
4 John 9 Albert 5 John 10 Albert
2. Assign a different label to each of the names in your list. Be sure that everyone in your group assigns the same label to the same names!
Note: many ways to label -- and some groups may have fewer or more than 10 in each. You may wish to ask students to think about how to label if these are the cases.
3. Select your sample by selecting labels at random
If you will be using a calculator, use a seed of 21 and your population size N = 10. If you will be using the random number table, start at Row 13, Column 1.
What is the first label selected? =
Who is the first person selected from your group?
TI: TI: Linda, 7, Table: Table: 0 Susan
What is the second label selected? = TI: 10, Table: 9
Who is the second person selected from your group? TI: Albert, Table: Albert
What is the third label selected? =
Who is the third person selected from your group?
Suppose
TI: 8, TI: Kathy, Table: John Table: 4
we wish to learn about the proportion of women in your population, denoted by p.
Count the number of women in your population, COUNT = 5
Count the number of people in your population, N = 10
Compute the proportion of women in your population p = COUNT N = 5/10
Next, let’s look at the results for your simple random sample of size n = 3. In many cases, the corresponding symbol computed for the sample is the same as that for the population, but a hat “ ^” is written over the top, like this p $ (read p-hat)
Count the number of people in your sample: n = 3
Count the number of women in your sample, count = TI: 2, Table: 1
Compute the proportion of women in your sample, p $ = count n = TI: 2/3, Table: 1/3
In this example, p is a select one: parameter or statistic
and p $ is a select one: parameter or statistic.
Does p $ = p? No
LDI2.5
How long? 15-20 minutes
Will this always be the case? No
How might it be done? There are many ways to approach this exercise so it can be adaptable to fit your needs. Since we have large lecture sections and this is the first sampling exercise, we often take about 5 minutes to briefly go through a various steps with our own mock population of 10 people. You could prepare the transparency before class, having already filled in names (step 1). With the whole class, discuss how you might label the units (step 2 if you are only using the table, perhaps ask what if we had 12 in our population), select the first person at random (step 3, using a DIFFERENT seed so they will have to do this themselves in their groups later), and compute your population proportion. Then explain that it is their turn to form groups of about 10 (this number may have to be different for some groups) and complete the full exercise. If they have questions, they should first ask their neighboring classmate, and then raise their hand. After most to all groups have finished, gather the class back together to review the last part of step 3. You might finish out your mock example to wrap this up, then go right into a discussion of the think about it questions following LDI 2.5.
How important? Fairly important Since simple random sampling is used within the remaining sampling methods (random selection within a stratum, of a systematic starting point, of a cluster), it is important that students understand how to do it. By having them do it themselves, with their own population, it reinforces the basic steps.
Let’sDo It! 2.6 Accounting Practices
Accountants often use stratified random sampling during audits to verify a company's records of such things as accounts receivable. The stratification is based on the dollar amount of the item, and often includes 100% sampling of the largest items. One company reports 5000 accounts receivable. Of these, 200 are in amounts over $100,000, another 1000 are in amounts between $10,000 and $100,000, and the remaining 3800 are in amounts under $10,000. Using these groups as strata, you decide to verify all of the largest accounts (over $100,000) and to take a simple random sample of 5% of the midsize accounts ($10,000 to $100,000) and 1% of the small accounts (under $10,000).
(a) Based on this sampling design, how many accounts will be sampled?
(b) Describe how you will label the accounts in the small stratum to select some small accounts to be included in the sample. Use your calculator (seed value = 25) or the random number table (Row 18, Column 1) to select only the first 5 small accounts to be verified. Think carefully about how many small accounts there are to label.
TI: Label the 3800 small accounts from 1 to 3800. Using a seed value of 25 and N = 3800, the first 5 selected small accounts have the following labels: 2429, 1511, 2410, 2777, 636.
Table: Label the 3800 small accounts from 0001 to 3800. Starting at row 18, column 1, the first 5 selected small accounts have the following labels: 0101, 1540, 9233 (skip), 3629, 4904 (skip), 3127, 3041
LDI2.6
How long? 5-7 minutes
How might it be done? Recap the scenario with the whole class. Have students work with their neighboring classmate to practice setting up and starting to take a stratified random sample. Sometimes we work through this exercise together with the whole class. How important? Not completely necessary to do in class, but it is a good basic exercise on stratified random sample, to reinforce the basic steps. Many students rush into it and make the mistake oftaking a sample of 5smallaccounts from some list of 200 small accounts,instead of sampling from a list of N = 3800 small accounts. This exercise could be assigned as a homework problem
Let’sDo It! 2.7 Stratified Random Sampling
Form a group of about eight students. You need to have at least two females and two males in your group. As before, the population of interest is your entire group.
The question of interest: How many times per year do you get a haircut? We want to learn about the average number of haircuts per year for your population. (Note: you may come up with a different question of interest.)
In the space provided below, write the names of the people in your group.
Name # haircuts per year Name # haircuts per year
Ask the question of interest to each member of your population and record their responses next to their name. Compute the average response for your population. Add up all of the responses and then divide by the number of students in your population, N
SUM Average = N = 24/8 = 3
This number is a ( parameter , statistic )
You are able to take a sample of size n = 4. Take a simple random sample of size n = 4.
Steps:
1. Assign a different label to each of the names in your list
2. Select a place to start in your random number table (row 10, column 22) and read off labels until 2 different labels have been selected or use your calculator (seed value = 270) to select your sample of size 4 from your population of N Who did you select from your group and what are their responses?
TI: (seed of 270): => the selected sample is label = 3
with response 5 label = 6 Emily with response 4
3. Compute the average response for your simple random sample of size n = 4 add up the above 4 responses and divide by 4.
Table: Average = sum n = 12/4 = 3 TI: Average = sum n = 14/4 = 3.5
This number is a ( parameter , statistic )
Now you are able to take a sample of size 4, but you want to have 2 females and 2 males in your sample. How?
STRATIFY!
Steps:
1. In the space provided below, write a list of all the males and all of the females in your group, that is, form the strata. Also include their response next to their name in parentheses, for example, Mary (2). Label FEMALES (Stratum 1) Label MALES (Stratum 2)
3 Sarah (4)
2. Assign a label to each unit in each stratum Note that you can start with the same label for each stratum For example, if there were four females and four males in your group, the females could be labeled 1 through 4 and the males could be labeled 1 through 4.
3. Select a simple random sample of size n = 2 females (start at row 14, column 1 or use your calculator with a seed value = 24) and a simple random sample of size n = 2 males (start at row 23, column 20 or use your calculator with a seed value = 35). Record the selected responses below.
Table: Monica and Sarah are selected for ... responses: 3, 4 Jon and Mike are selected for ... responses: 3, 5
TI: Emily and Sarah are selected for ... responses: 4, 4 Jon and Steve are selected for ... responses: 3, 2
4. Compute the estimated average response in each stratum separately:
Table: Stratum 1, Females: Estimated Average = sum n = 7/2 = 3.5
Stratum 2, Males: Estimated Average = sum n = 8/2 = 4
TI: Stratum 1, Females: Estimated Average = sum n = 8/2 = 4
Stratum 2, Males: Estimated Average = sum n = 5/2 = 2.5
5. Compute the overall sample average response by pooling the averages from each stratum together. Since the size of the strata may differ, we take a weighted average of the individual stratum averages. Each stratum average is weighted by the proportion of units in the population that make up that stratum
This number is a (parameter , statistic)
How does it compare to the average for the entire population? Not exactly equal to the population mean of 3. LDI2.7
How long? 15-20 minutes
How might it be done? As with LDI 2.5, there are many ways to approach this exercise. You could take a few minutes to briefly go through a various steps with our own mock population of 8 (or actually any number you wish) people. If you decide to increase the population size, you might also increase the sample size from within each stratum You could discuss some or all of the steps with your mock population. We have found that if you have spent enough time teaching the details about taking a simple random sample, students do not have much difficulty performing the remaining sampling methods. After a brief introduction to the idea of stratified random sampling and doing LDI 2.6, we have gone right into asking students to form groups and complete the full exercise. You might need to spend some of
the time wrapping up this class exercise explaining the weighted average concept (also presented in Example 2.16 which precedes LDI 2.7).
How important? Fairly important. By having them do it themselves, with their own population, it reinforces the basic steps. They see that the labeling is assigned separately within each stratum They experience computing a weighted average.
Let’sDo It! 2.8 Faculty Salaries
A study is being conducted of the faculty salaries for a public university. Of the 1200 tenure-track faculty, 480 are full professors, 336 are associate professors and the remaining are assistant professors. A simple random sample of 100 full professors, 50 associate professors and 50 assistant professors will be taken and information about salary will be obtained.
(a) What type of sampling method is used to obtain the 200 selected faculty members? Stratified random sampling.
(b) Use your calculator (with a seed value of 18) or the random number table (Row 14, Column 1) to give the labels for the first 5 full professors to be selected.
TI: 202, 195, 28, 215, and 174.
Table: 103, 112, 267, 339, and 401.
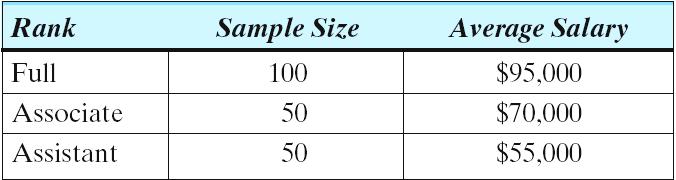
(c) The table summarizes the average salary for the sampled faculty members by rank.
Give the overall estimate of the average salary for all faculty members based on this sample information Show all work and include your units.
(480/1200)($95,000) + (336/1200)($70,000) + (384/1200)($55,000) = $75,200.
LDI2.8
How long? 5 - 7 minutes
How might it be done? Recap the scenario with the whole class. Go through part (a) as a group. It should be somewhat obvious since the exercise is in the Stratified Random Sampling section. You might have students work on parts (b) and (c) in groups of size 2 or 3. When polling the class for their answers to part (c), see if they included the units.
How important? Not completely necessary to do in class, but it is a good basic exercise on stratified random sample, to reinforce the basic steps. It gives students another opportunity to apply the idea of a weighted average to obtain an overall estimate.
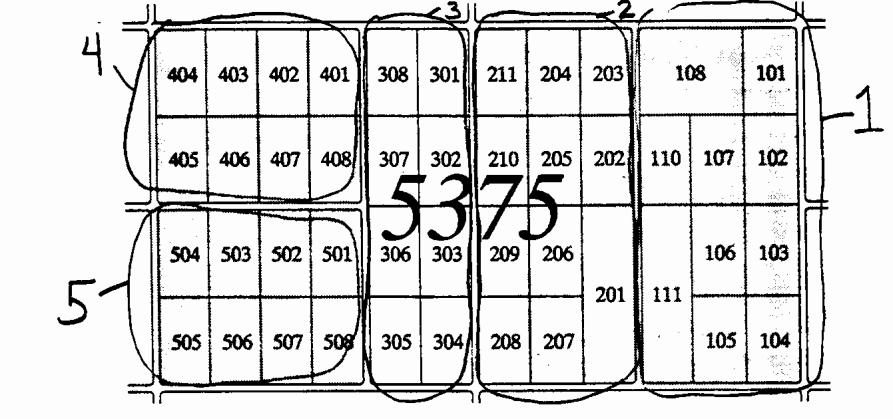
Let’sDo It! 2.9 Systematic Sampling of Census Tract Blocks
The accompanying figure is a map of census tract, #5395 in Detroit, Michigan. Census tracts are small homogeneous areas with an average population of about 4000. Each block in the tract is marked with a Census Bureau identifying number.
In the map, the ID numbers start at 101, which is along the right side, and end at 514 in the upper left corner. Notice that some of the numbers in between are skipped. For example, the numbers jump from 414, located in the middle of the bottom edge, to 501 for Sinai Hospital Interviewers can be assigned to a set of blocks, such as the blocks with ID numbers in the 100s. The ID numbers are also assigned in a serpentine pattern so that the blocks that form a set are close to one another.

Your task is as follows: Take a 1-in-10 systematic sample of the blocks in this tract.
(a) Following the ID numbers for ordering the blocks in this population, use your pen to continue to trace out this order on the above map (that is, connect the blocks with a line in ascending order of ID number).
(b) For a 1-in-10 systematic sample the first ten blocks in the map form your first group. Label these 10 blocks and use your calculator (seed value = 39 and N = 10) or the random number table (row 16, column 6) to randomly select your starting block, which is the first block in your sample.
What is the ID number of the first block selected?
TI: Labels are #101=1, #102=2, #103=3, #104=4, #105=5, #106=6, #107=7, #108=8, #109=9, #111=10
Using a seed value of 39 and N = 10, the first selected label is 1, which is block #101.
Table: Labels are #101=1, #102=2, #103=3, #104=4, #105=5, #106 =6, #107=7, #108=8, #109=9, #111=0
Using a row 16, column 6, the first selected label is 1, which is block #101.
(c) Now starting at the first block selected, count off every tenth block, in order, to be included in your sample. List the block ID numbers which form your sample: #101, #202, #212, #310, #407, #503, #513
(d) How many blocks are in your sample? n = 7 blocks
Is the sample size fixed? Explain. No, the number of blocks in the population is not a multiple of 10. When we started with block #101 we sampled n = 7 blocks. However, if you had started with block #104, you would have sampled n = 6 blocks.
LDI2.9
How long? 8-10 minutes
How might it be done? Recap the scenario with the whole class. Have students work in groups of size 2 or 3. You might do the tracing to form the list up front, so that everyone starts off with the correct list.
How important? This is a nice, real-data exercise to do in class. Since the ID numbers are in order but skip some numbers, the students do have to ‘count’ out every tenth block to be included in the sample. This exercise could be assigned as a homework problem
Let’sDo It! 2.10 Systematic Sampling of Presentation Attendees
An annual meeting for computer programmers was held in a convention center. A total of 1268 computer programmers were in attendance. At 10:00 A.M. on the last day of presentations, the 1268 programmers were attending exactly one of the 20 presentations that they had previously registered for. The 1268 programmers were given consecutive ID numbers based on the registration for the last presentation, as shown:
The meeting organizers would like to survey the programmers to learn of their impressions regarding the annual meeting. It was decided to take a 1-in-50 systematic sample of the programmers using the ID number.
(a) With this type of sampling plan, is each presentation guaranteed to be represented? That is, will the sample include at least one programmer from each presentation?
Circle one: Yes No
Explain: Some presentations had less than 50 registered.
If yes, use your calculator with seed value = 18 (or Row 33, Column 1) and give the ID numbers for the programmers that will be selected. If no, give the maximum value for k such that the 1-in-k systematic sample will always include at least one programmer from each presentation. The smallest number of programmers registered is 9 for presentation #13, so the maximum value of k is 9.
(b) With the correct k from part (a), use your calculator with seed value = 18 (or Row 33, Column 1) and give the first 10 ID numbers for the programmers that will be selected
Using a k = 9 and the TI, we have 4, 13, 22, 31, 40, 49, 58, 67, 76, 85. Using a k = 9 and the Table, we have 6, 15, 24,33, 42, 51, 60, 69, 78, 87.
(c) How many programmers will be included in your systematic sample? We have that 1268/9 = 140 with a remainder of 8. With either the TI or the Table we will sample one more from the last 8 attendees, so the total sample size will be 141. If the first selected digit were a 9, we would have just 140.
(d) Suppose the organizers would like to survey exactly two programmers from each presentation. Suggest a sampling plan to accomplish this. They should do a stratified random sample with the 20 presentations representing 20 strata.
LDI2.10
How long? 10-15 minutes
How might it be done? Talk through the scenario with the whole class. Have students work in groups of size 2 or 3 to discuss part (a). You might gather the class back together to discuss and arrive at k =9, so that everyone can do the remaining parts with the same value for k.
How important? Very Important. Students have to really “think” to complete this exercise. It should generate some good discussion. You could extend part (d) as a homework exercise by having students carry out their suggested plan, showing all details. We have also assigned this as a homework question and given them some time in their weekly lab to discuss it.
Let’sDo It! 2.11 Cluster Sampling of Census Tract Blocks
The following figure is a map of census tract #5375 in Detroit, Michigan.
In the map there are five clusters of blocks based on the hundredths value for the ID number. Your task is as follows: Take a cluster sample by selecting two of the clusters of blocks at random
(a) Label the 5 clusters. Cluster Label 1 corresponds to the 100’s, Cluster Label 2 corresponds to the 200’s. Cluster Label 3 corresponds to the 300’s. Cluster Label 4 corresponds to the 400’s. Cluster Label 5 corresponds to the 500’s.
(b) Take a simple random sample of 2 clusters. Use your Calculator (with seed value = 10 and N = 5) or the random number table (Row 24, Column 31) to select two cluster labels at random. What is the label of the first cluster selected? What is the label of the second cluster selected?
TI: selected clusters are 3 and 2. Table: selected clusters are 4 and 5.
(c) The sample would consist of all of the blocks in those 2 selected clusters. List the ID numbers of the blocks in your sample:
TI: 201, 202, 203, 204, 205, 206, 207, 208, 209, 210, 211, 301, 302, 303, 304, 305, 306, 307, 308.
Table: 401, 402, 403, 404, 405, 406, 407, 408, 501, 502, 503, 504, 505, 506, 507, 508.
(d)What is the chance that a block will be selected for the sample? 2/5
LDI2.11
How long? 5-6 minutes
How might it be done? Recap the scenario with the whole class. Have students work in groups of size 2 or 3. Students generally find that this exercise is fairly straight forward. You may wish to remind them that only the clusters of blocks need to receive a label, not the individual blocks.
How important? Again a nice, real-data exercise to do in class, which does not take too much time.
Let’sDo It! 2.12 Cluster Sampling of Students
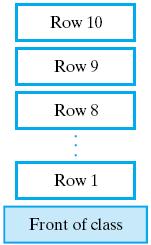
The population of interest is the students in your classroom today. Each row of students will form a cluster.
(a) In the space provided, sketch a map portraying the relative positions of the rows (clusters) in your classroom.
(b) Assign a label to each cluster (each row). What is the chance that any student in the population will be selected?
1/R where R is the number of rows in your classroom. With 10 rows we have:
TI: Row #1 receives label 1, Row #2 receives label 2, ... , Row #10 receives label 10.
Table: Row #1 receives label 1, Row #2 receives label 2, ... , Row #10 receives label 0.
(c) Select one cluster at random Use your calculator with seed value = 279 or Row 9, Column 21 of the random number table.
Which cluster (row) did you select? TI: select Row #1. Table: select Row #1. How many students were in the selected cluster (that is, what sample size did you get)? It will depend on the actual class.
Is the sample size fixed? Explain. Yes if the number of students in each row is the same for all rows. No if the number of students in each row is not the same for all rows.
LDI2.12
How long? 7-8 minutes
How might it be done? We generally do this exercise together as a whole class. If the room arrangement in your classroom is different, you can modify this exercise accordingly, using location between students as a way to form the clusters. Sketch out your resulting map together, discuss and decide on a labeling scheme, and perform the cluster sampling. How important? A nice exercise that directly uses the whole class and does not take too much time.
Let’sDo It! 2.13 Which Sampling Method Could Have Been Used?
A population consists of 12 people, listed in the following table:
The two columns in the table divide up the population into 2 strata, labeled I and II. The population is also divided into 3 clusters by row. Below each name in the table is the person's corresponding ID number. Thus, Cluster 1 consists of Ann, Bowei, George, Juan. Cluster 2 consists of Carrie, Donna, Bob, Steve. Cluster 3 consists of Latisha, Fran, Paul, Tom Stratum I consists of Ann, Bowei, Carrie, Donna, Latisha, Fran. Stratum II consists of George, Juan, Bob, Steve, Paul, Tom.
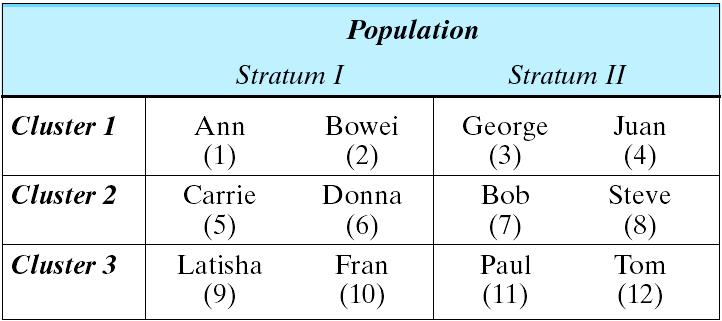
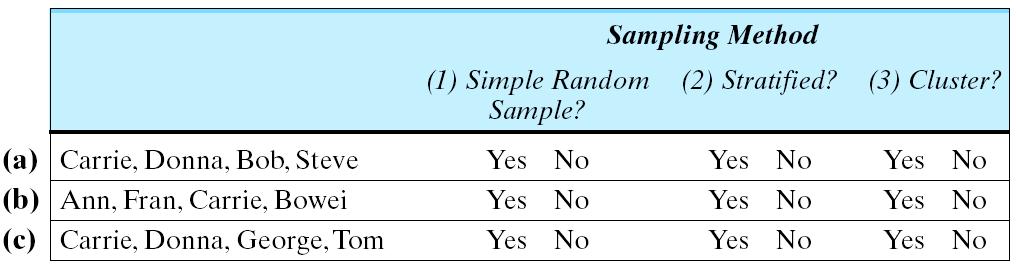
A sample of four people was obtained from this population. Listed next are three different samples. Consider the following sampling methods: (1) simple random sampling, (2) stratified random sampling, with equal sample sizes from each stratum, (3) cluster sampling by rows. For each sample determine which sampling method(s) could have generated that sample, by circling yes or no for each. Hint: more than one method is possible.
(d) Take a systematic 1-in-3 sample from this population. Use the ID numbers as the ordered listing of the population items (that is, Ann = 1, Juan = 4, Steve = 5, etc.). Use your calculator with seed value = 78 and N = 3 or the random number table with Row 3, Column 3. List the names of the people in your sample.
TI: Starting point is #1, so the sample consists of Ann, Juan, Donna, Fran Table: Starting point is #1, so the sample consists of Ann, Juan, Donna, Fran
LDI2.13
How long? 8-10 minutes
How might it be done? Read through the scenario as a whole class. You might go through the possible sampling methods for sample (a) together as a class. Then have the students do sample (b), sample (c), and part (d).
How important? Very important a good exercise that tests students’ knowledge about the sampling methods and their reasoning skills.
Let’sDo It! 2.14 Name that Sampling Method
Read each scenario and identify the sampling method being described (simple random sample, convenience sampling, stratified random sampling, systematic sampling, or cluster sampling). Discuss your answers with your neighboring classmates.
(a) A shipment of 1000 3-ounce bottles of cologne has arrived to a merchant. These bottles were shipped together in 50 boxes with 20 bottles in each box. Of the 50 boxes, 5 boxes were randomly selected. The average content for these 100 selected bottles (that is, all 20 from each of the 5 selected boxes) was obtained.
Method: Cluster Sampling
(b) A faculty member wishes to take a sample from the 1600 students in the school Each student has an identification number. A list of all identification numbers is available. The faculty member selects an identification number at random from among the first 16 identification numbers in the list, and then every sixteenth identification number on the list from then on.
Method: 1-in-16 Systematic Sampling
(c) A faculty member wishes to take a sample from the 1600 students in the school The faculty member decides to interview the first 100 students entering her class next Monday morning.
Method: Convenience Sampling
LDI2.14
How long? 3-5 minutes
How might it be done? A basic ‘name that sampling method’ short quiz. Not directly a group exercise, but students enjoy trying out these short basic questions in class too.
How important? Not crucial, but a quick check on some sampling knowledge.
Think AboutIt (TAI) Solutions
Page 106:
Think aboutit
When will selecting a simple random sample be simple to do? Will it always be possible?
When will it be difficult to do? Why could it be difficult?
Someofthekeyideasarethatyouneedtobeableto assignalabelto all ofthe unitsinthepopulation.Sometimes this is difficult to do or impossible to do. Imagine trying to list all of the adults in a country. We will discuss a multistage sampling method that helps in this area.
How would you label the units if the population size were 78? 292? 4000? Would it be simpler with the random number table or with a calculator (or computer)? In general it is easier to use a calculator or computer and have it produce a (random) list of actual labels from 1 to N. If you use a random number table, you may end up skipping over a lot of unassigned labels or resort to assigning multiple labels to each unit. Suppose the population size were N=292. With a calculator you simply label the units from 1 to 292. With a random number table you use a set of 292 threedigit labels, say 001, 002, ..., 292. The three-digit labels of 000 and 293 through 999 would not be assigned. If you came across any of them in the table, you would skip over them. Alternatively you could assign to each unit a total of 3 three-digit labels. The coding and decoding of this assignment scheme can take some time.
Think aboutit
When do you take a larger sample size from one stratum versus another?
In general, you take a larger sample from a stratum that has more variability in the responses.
When you form the strata, how should the variability of the units within each stratum compare to the variability between the strata?
Ideally, the variability of the units within each stratum should be small compared to the variability between the strata.
Is a stratified random sample a simple random sample? Explain.
A stratified random sample is not a simple random sample. A stratified random sample, using gender as the stratification variable, will always result in a sample with some females and some males. A simple random sample from the same population could result in a sample which contains only males (or only females). Such a sample could not occur under stratified random sampling. With stratified random sampling, all samples of size n do not have the same chance of being selected.
Page 119:
Think aboutit
In a systematic sample, every unit has the same chance of being selected. Does this imply that a systematic sample is a simple random sample?
A systematic sample is not a simple random sample. In Example 2.19, with systematic sampling the sample AEIMQ has a 1/4 chance of being selected, while the sample ABCDE has no chance of being selected. With systematic sampling, all samples of size n do not have the same chance of being selected.
In a systematic sample, the units are effectively divided into groups of size k and one unit from each group ends up being in the sample. Does this imply a systematic sample is a stratified random sample?
A systematic sample is not a stratified random sample. With stratified sampling you would select (at least) one unit from each stratum, not necessarily in the same position. In Example 2.19, the sample AEIMQ is possible under both systematic and stratified sampling, while the sample AFKOR could occur with stratified sampling but not with systematic sampling.
Page 125:
Think aboutit
Is a cluster sample a simple random sample?
A cluster sample is not a simple random sample. A cluster sample, using rows of students as the clusters, will result in a sample with students who sit in the same row. A simple random sample from the same population could result in a sample which contains students from many different rows (and not all of the students from these rows). Such a sample could not occur under cluster sampling. With cluster sampling, all samples of size n do not have the same chance of being selected.
Is a cluster sample a stratified random sample?
A cluster sample is not a stratified random sample. Although you could think of the population of students as being divided into strata by rows, with stratified sampling you would select (at least) one unit from each stratum, not necessarily all of the units from a stratum.
When you form the clusters, how should the variability of the units within each cluster compare to the variability between the clusters?
Ideally, the variability of the units within each cluster should be large compared to the variability between the clusters.
Is this criterion the same as in stratified random sampling?
No, in stratified random sampling, you want the variability of the units within each stratum to be small compared to the variability between the strata.