“c01AnIntroductionToMicroeconomics_PrintPDF” — 2022/7/19 — 7:26 — page 47 — #45
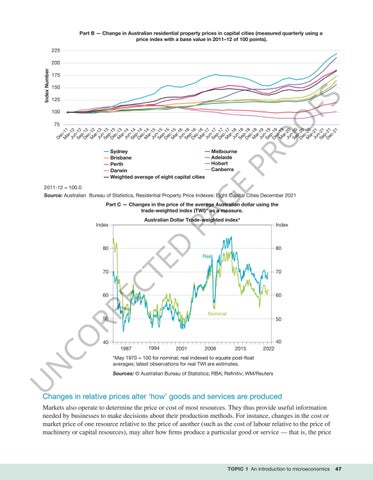
Part B — Change in Australian residential property prices in capital cities (measured quarterly using a price index with a base value in 2011–12 of 100 points). 225
175 150
FS
Index Number
200
125
O
100
Melbourne Adelaide Hobart Canberra
E
Sydney Brisbane Perth Darwin Weighted average of eight capital cities
PR O
De c M -11 ar Ju -12 n Se -12 pDe 12 c M -12 ar Ju -13 n Se -13 pDe 13 c M -13 ar Ju -14 n Se -14 pDe 14 c M -14 ar Ju -15 n Se -15 pDe 15 c M -15 ar Ju -16 n Se -16 pDe 16 c M -16 ar Ju -17 n Se -17 pDe 17 c M -17 ar Ju -18 n Se -18 p De -18 c M -18 ar Ju -19 n Se -19 pDe 19 c M -19 ar Ju -20 n Se -20 pDe 20 c M -20 ar Ju -21 n Se -21 pDe 21 c21
75
2011-12 = 100.0
G
Source: Australian Bureau of Statistics, Residential Property Price Indexes: Eight Capital Cities December 2021
PA
Part C — Changes in the price of the average Australian dollar using the trade-weighted index (TWI)* as a measure. Australian Dollar Trade-weighted index*
D
Index
CO RR EC
70
80 Real
TE
80
Index
70
60
60
Nominal
50
50
40
40
1994
2001
2008
2015
2022
*May 1970 = 100 for nominal; real indexed to equate post-float averages; latest observations for real TWI are estimates. Sources: © Australian Bureau of Statistics; RBA; Refinitiv; WM/Reuters
U
N
1987
Changes in relative prices alter ‘how’ goods and services are produced Markets also operate to determine the price or cost of most resources. They thus provide useful information needed by businesses to make decisions about their production methods. For instance, changes in the cost or market price of one resource relative to the price of another (such as the cost of labour relative to the price of machinery or capital resources), may alter how firms produce a particular good or service — that is, the price
TOPIC 1 An introduction to microeconomics
47