19 minute read
1.4 Choice, opportunity cost and efficiency in resource allocation


Types of productive resources
Natural resources Labour resources Capital resources
Advertisement
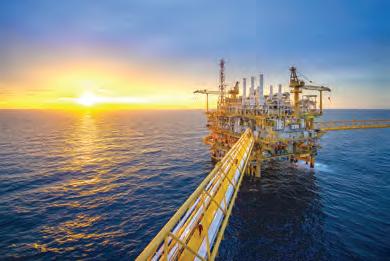
• Nature provides resources used in the production of many types of goods such as crops as well as services. • Examples include rainfall and climatic conditions, mineral deposits, oceans and forests. • Mental skills and physical effort are needed to produce particular goods and services. • Examples include the skills and knowledge of doctors, builders and businesspeople.
• Manufactured items are used by businesses in the production of many goods and services. • Examples include the electricity grid system, commericial buildings, highways, schools, dams and ports. Natural resources Natural resources represent those found in nature and include arable land, oil, minerals, rivers, climate, native forests, air quality and oceans. Natural resources have the potential to support a variety of primary (extractive), secondary (manufacturing) and even tertiary (service) industries. Labour resources Skilled and unskilled labour resources provide physical power, mental talents, and other specialised services that are used in the production process such as those of an architect, mechanic or shop attendant. Entrepreneurship is a specialised type of labour resource and represents the skills of management, company leadership and organisation. Most of Australia’s labour force is employed in tertiary industry. Natural resources are the factors of production found in nature,UNCORRECTED PAGE PROOFS such as minerals, rainfall and the environment. Labour resources used in production are physical power and mental talents provided by employees.
Capital resources In economics, capital resources are manufactured items set aside from past production, often involving physical plant and equipment (such as machinery, factories, power generators, computer systems, trucks, dams, railways and roads) used by businesses and governments to help make other goods and services. Capital equipment also incorporates new technology that results from research and development (R&D). Perhaps the main feature of increased capital resources is that they help lift the efficiency or productivity of natural and labour resources. In turn, if resources are more productive so that output per worker in an hour is greater, a nation can enjoy higher per capita incomes, consumption and material living standards. The big problem for Australia (and all countries) is that we don’t have the quantities of resources, and resources of sufficient quality, to produce the amount of goods and services required to satisfy our unlimited wants. Our productive capacity and material living standards are therefore limited by the scarce resources available. 1.3.3 Relative scarcity and the three basic economic questions Relative scarcity is the concept that simply describes the imbalance that exists between our unlimited wants for goods and services on the one hand, relative to the limited or finite resources that are available to help satisfy these wants, on the other hand. If the problem of scarcity did not exist, goods and services would be free and available to all in infinite quantities. Regrettably, this is not the case and the price of one good or service compared with another, is often used as a guide to each item’s relative scarcity. For instance, because diamonds are relatively scarcer than air, they have a high price, while air is usually free and has a zero price. Given the basic problem of relative scarcity, individuals, governments and nations cannot produce and have all the things they would like. They are all forced to make difficult choices between alternative ways of using their limited resources, based on their priorities. Only the most important wants can be satisfied, while less important ones that provide lower satisfaction, pleasure, or utility, must be abandoned. Capital resources are physical plant and equipment used by firms to help make other goods and services. Productive capacity represents the physical limit to a nation’s production level, when all resources are used as efficiently as possible to gain the highest output. It is represented by the production possibility frontier on a production possibility diagram. Relative scarcity is the basic economic problem. It exists because society’s wants are So, because of scarcity, every nation has an economic system or institution that helps it to make these choices or decisions, and answer three basic economic questions: The ‘what and how much to produce’ question Because of scarcity, individuals, businesses and governments need to decide the specific types and quantities of each good (such as chocolate bars, tourist accommodation, butter, guns) or service (such as education, health, finance, entertainment) that is to be produced with the limited resources available. This decision may be influenced by what consumers want most, their tastes and fashions, advertising, the time of the year, the relative profitability of producing each good or service, and even government laws and regulations that may ban some types of production.UNCORRECTED PAGE PROOFS virtually unlimited yet the productive resources available to satisfy them are limited. This necessitates choices about which wants will be satisfied first, resulting in opportunity costs.
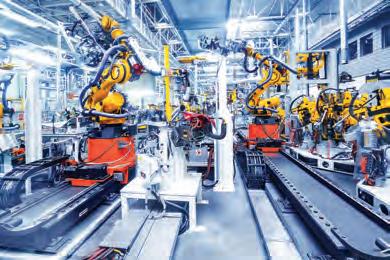
The ‘how to produce’ question Given scarcity, businesses need to produce their goods and services in the most efficient way. For instance, in making a particular type of good or service, often labour resources can be replaced by capital resources or technology including robotics. Whether labour-intensive or capital-intensive production methods are selected by a business, often depends on which production method is the cheapest and most profitable. Sometimes too, government policies will affect a firm’s decisions about its production methods. For instance, the government may set legal minimum wages at a level higher than otherwise, or perhaps impose laws about occupational health and safety in the workplace. The ‘for whom to produce’ question In using our limited resources, decisions must also be made about how the nation’s goods, services, and incomes will be shared, distributed or divided between members of society. Who should gain access to consume or use the goods and services that have been produced? Should this mostly depend on the level of each person’s income that in turn may reflect their personal economic contribution towards making these goods and services, or should the government also help to decide who can gain access to these things, perhaps by taxing the rich and paying welfare to the neediest, or by making some services available to all free of charge? The concept of relative scarcity, and the need for choice or decisions in providing answers to the three basic economic questions, is shown in figure 1.5. FIGURE 1.5 Relative scarcity reflects unlimited wants compared with limited resources available, necessitates making choices and answering three basic economic questions. Unlimited wants Limited resources RELATIVE SCARCITY Business wants O/S wants Household wants Government wants Individuals and societies must make choices relating to three basic economic questions: 1. What and how much to produce? 2. How to produce? 3. For whom to produce? Resourceseses Resources Weblinks Basic concepts in economics UNCORRECTED PAGE PROOFS Scarcity, choices and exchange (EconMovies 1: Star Wars) 12 Key Concepts VCE Economics 2 Units 3 & 4 Eleventh Edition
Students, these questions are even better in jacPLUS
Receive immediate feedback and access sample responses Access additional questions Track your results and progress
Find all this and MORE in jacPLUS
1.3 Quick quiz 1.3 Exercise
1.3 Exercise 1. a. Outline the difference between needs and wants. (2 marks) b. Explain why we say that wants are unlimited. (2 marks) 2. Define and give examples of the three main categories of productive resources that are available to a nation. a. natural resources b. labour resources c. capital resources. (3 marks) 3. Explain the basic economic problem of relative scarcity. (2 marks) 4. a. Classify the following resources as natural, labour or capital resources. (5 marks)
Resources
Type of resource - natural, labour or capital resource i. The new NBN cables ii. A computer at BHP iii. The fertile soils in the Western District of Victoria iv. The MCG sports oval and complex v. The school principal vi. Port Phillip Bay vii. The Sydney Opera House viii. The M80 Ringroad or East Link ix. Native forests in Tasmania x. Ashleigh Barty (Australian tennis player) b. Distinguish capital resources from natural resources. (2 marks) c. Explain why capital resources are such an important influence on a nation’s productive capacity and material living standards. (2 marks) Solutions and sample responses are available online. UNCORRECTED PAGE PROOFS
KEY KNOWLEDGE
• scarcity, choice and opportunity costs • the production possibility diagram: opportunity cost and the production possibility frontier (PPF) • the meaning of economic efficiency: allocative efficiency, productive efficiency, dynamic efficiency and inter-temporal efficiency • the significance of, and relationships between, efficiency in resource allocation and the PPF. • the role of relative prices in the allocation of resources Source: VCE Economics Study Design (2023–2027) extracts © VCAA; reproduced by permission. If our collective wants were not unlimited and if resources were infinite, scarcity would not exist as a central economic problem facing society. Sadly, this is not the case, so we are forced to make choices or decisions about how scarce resources are to be used or allocated. 1.4.1 The need to make choices when allocating resources Resource allocation involves making choices or decisions about how scarce natural, labour and capital inputs are to be used or distributed among competing areas of production Resources have a host of possible uses. For instance, should resources be devoted to the production of childcare centres or freeways, to national defence or to primary production, or to the production of consumer goods or to making capital equipment? Because of the problem of relative scarcity and there are not enough resources to produce everything we would like, individuals and nations are forced to choose between alternative or competing areas of production. This raises the problem of opportunity cost. 1.4.2 Opportunity cost and its role in deciding how resources are used or allocated Opportunity costs arise out of the choices made by individuals and nations. When all available resources are fully and most efficiently used in production, a decision to produce more of one type of good or service means reduced production in some other area. This sacrifice in production is required to free up scarce resources. The opportunity cost is therefore the cost of the benefit forgone or given up, when resources are used in the production of the next best alternative good or service. Apart from the benefits forgone when resources are redirected, opportunity cost can also be measured in other ways. For instance, a particular choice may involve the cost in dollar terms, the cost in time and external costs — these are costs transferred or passed on to others (such as the cost to your neighbours of lost sleep, if you decide to have a noisy party). Resource allocation relates to decisions about which types of goods and services will be produced and which wants will be satisfied. This may be decided by either the market system or by Opportunity cost is commonplace, for individuals as well as nations and governments. • Opportunity costs for individuals. For example, your wise choice to use your time to study a great subject like economics may mean that you were forced to forgo having fun in, say, chemistry or biology. Alternatively, your decision to stay at school until the end of Year 12 UNCORRECTED PAGE PROOFS so that you can benefit from tertiary study, may mean sacrificing income that you government economic planning. could have earned by having a fulltime job. In addition, the payment of school fees Opportunity cost is equal to the meant your parents forewent using the money to travel abroad. benefit forgone by a decision not to direct resources into the next best alternative use.
• Opportunity costs for nations and governments.
In 2022–23, for example, the Australian government planned to spend around $38 billion on defence.
While this decision has benefits and some of society’s wants could be satisfied from it, it is a sobering thought to reflect on how these same resources could have been redeployed or reallocated. It is likely that welfare, childcare, health and industry assistance all suffered cutbacks because of this decision, and/or taxes were higher than otherwise to pay for defence spending. Environmental opportunity costs also result from various economic activities in Australia, especially coal-generated power, product packaging, aspects of the timber industry, a transport system dependent on the private motor car, water usage and irrigationbased agriculture in arid regions, and aviation and tourism. These activities are linked with the costs of accelerated global warming and serious climate change. Perhaps you might like to consider the opportunity cost of a decision to allow expanded uranium mining in Kakadu National Park (Northern Territory), the Adani Carmichael coal mine (Queensland), and its impact on accelerating climate change or further wood chipping in the Otways (Victoria) or in Tasmania. Given that a decision to produce one type of good or service can adversely affect the output of another, it is important that the production options are carefully weighed. Increasingly, firms and governments use a cost–benefit analysis to assist them in making choices that minimise opportunity costs. Failure to consider such matters results in overall lower living standards than could otherwise be the case. 1.4.3 The production possibility diagram The production possibility diagram is a way of illustrating the different production options, combinations or choices available for an economy. As such, it is used by economists to better understand various concepts and ideas including the following: • the basic economic problem of relative scarcity • the concepts of efficiency and inefficiency in allocating resources and their connection with material living standards • how a nation’s productive capacity or ability to produce goods and services is limited at a point in time • that careful choices must be made in deciding how resources are allocated and which needs and wants are to be satisfied • all choices or economic decisions about production and the allocation of resources involve an opportunity cost • how, over a period of time, a country’s production levels or its economy may grow. Constructing a production possibility diagram
In order to construct the production possibility diagram (PPD) shown in figure 1.6 illustrating the output choices available for a nation, we need to understand that it is based on some simplifying assumptions: • It assumes that only two types of output can be produced by a nation — in this case, the country can produce goods or it can produce services (or perhaps some combination of the two). • It is assumed that the nation fully uses its scarce natural, labour or capital resources to produce goods or services, so that no resources are unemployed, wasted or lying idle (since this would mean that the country was not operating at its capacity or potential output). • At a point in time (e.g. 2023), the total quantity or volume of productive resources available for the nation is fixed or limited, although how these resources are allocated between the production of goods or the production of services (i.e. the product mix) can change. • It is assumed that the nation uses the most efficient production methods now available, or the best practice permitted by current technology.
Production possibility diagrams
are used to illustrate the production choices available to society in the ways that resources may be used or allocated. They also help illustrate the concepts of opportunity cost and productive
UNCORRECTED PAGE PROOFS capacity.
FIGURE 1.6 Production possibility diagram for the hypothetical country in 2023.
11
10 A B C
9 Production of services (billions of units per year) 4 3 5 6 7 8 E F G H 2 1 I
0 10 2 3 4 5 Production of goods (billions of units per year) Production combination
Production of services (billions of units per year)
Production of goods (billions of units per year) A B 9.8 C 9.4 D 8.8 E 8.0 F 7.0 G 5.8 H 4.4 I 0.0
0.5 1.0 1.5 2.0 2.5 3.0 3.5 4.0 10.0 0.0 Production possibility frontier = the economy’s original productive capacity in the year 2023 D UNCORRECTED PAGE PROOFS
Perhaps the first thing to note is that the PPD has two axes: • The total quantity of goods produced is shown on the horizontal axis of the diagram. • The total quantity of services produced is shown on the vertical axis of the diagram.
This PPD contains a production possibility frontier (PPF) for the country. This represents the productive capacity or a nation’s potential output of goods and/or services for 2023, given the efficient and complete use of all resources available. The PPF hence marks the current boundary or border between possible and impossible production combinations of goods and/or services. The PPF has been drawn using the table of hypothetical data located at the foot of the diagram. Notice that there are nine production possibilities or combinations of goods and/or services (labelled A to I) from which this country could choose. However, whatever production possibility, product mix or point on the PPF is selected (e.g. point A or point I), there will always be an opportunity cost. By opportunity cost we mean that the production of one thing has to be forgone to produce more of the next best alternative. The scarcity of resources means that it is not possible for the nation to produce maximum quantities of both goods (i.e. a limit of 4 billion units per year) and services (i.e. a limit of 10 billion units per year) at the same time. For example, if production possibility A is chosen and the country produces 10 billion units of services annually, rather than selecting production possibility I, it is clear that the production of goods will have to be cut from 4 billion units a year to 0 units, so as to free up the necessary resources. Here, the opportunity cost of selecting point A rather than I is said to be 4 million units of goods. Notice too that as this gradual shift occurs — moving up and around the PPF from point I through points H, G, F, E, D, C and B, towards point A — the size of the opportunity cost of increasing the production of services gradually rises. It starts off small but progressively increases. In reverse, if the nation chose point I rather than point A on the PPF, increasing the production of goods from 0 to 4 billion units each year would mean cutting the production of services from 10 billion units to 0 units. The opportunity cost of gaining 4 billion units of goods would be 10 billion units of services. Again notice that in this latter case, the opportunity cost of moving down around the PPF — from point A through points B, C, D, E, F, G and H, to I — would start off quite small and then progressively increase. Showing the relationship between efficiency in resource allocation, the PPF and society’s living standards
Allocative efficiency, or the efficient allocation of resources, is defined as a desirable situation where resources are used to produce particular types of goods and services that best maximise the overall satisfaction of society’s needs and wants, wellbeing or living standards (both in the short- and long-term). Resources go to where they are most wanted. As mentioned already, all nine production possibilities (labelled A to I) making up the 2023 PPF shown in figure 1.6, could represent an efficient use of resources. We know this simply because for all points on the PPF, output is at its limit. It is not possible for the country to increase its production of one thing without reducing the production of the other. So any particular product mix that is selected from those making up the PPF can potentially maximise the satisfaction of society’s wants. Nevertheless, some of you may still question whether there is one output mix on the PPF that is superior or better than another. The answer is that all production possibilities (for instance, B, D or G) can potentially optimise society’s general welfare, and that the final combination chosen depends on the personal values held by those making the decisions. However, what we can say is that a production point that is somewhere inside the PPF is using resources inefficiently. This will certainly limit the extent to which society’s wants can be satisfied and lower material living standards.
Allocative efficiency is where resources are used in ways that maximise society’s satisfaction of needs and wants and general wellbeing. Resources are diverted to where they are most wanted.
Referring to the PPD, this will beUNCORRECTED PAGE PROOFS a point chosen by society located somewhere on the PPF.
Apart from allocative efficiency (using resources in ways that maximise society’s satisfaction overall), figure 1.7 shows that there are also at least three other ways of describing economic efficiency: • Productive or technical efficiency implies using the lowest cost production methods, and minimising wastage of resources in making goods and services. At a point in time, any one choice selected by a society on the PPF could represent maximum efficiency where output per unit of input is at its maximum.
However, over time, changes in allocative efficiency will affect the overall size of the PPF and hence whether the frontier moves outwards or inwards. For example, an increase in technical efficiency would help shift the PPF outwards allowing for the satisfaction of even more wants, also increasing allocative efficiency. • Dynamic efficiency occurs when resources are reallocated quickly in response to the changing needs and tastes of consumers. Thinking of the PPD, dynamic efficiency would influence the speed of change from one point selected by society on the PPF, to another point on the PPF. Moving quickly implies that resources are highly mobile and can be reallocated easily between alternative uses when relative prices change. Increased dynamic efficiency will also help to boost allocative efficiency and ensure that resources go to where they are most wanted or valued by society. • Intertemporal efficiency refers to finding the optimal balance between current consumption or the spending of income, versus saving income to finance investment and hence increase future consumption. It is often a matter of finding the right balance between satisfying our immediate wants for goods and services, versus those of future generations. Another way of looking at it is from the perspective involving environmental sustainability. Faster economic growth now will deplete resources and accelerate climate change, limiting the choices of future generations and the extent to which they can satisfy their wants. Clearly this too can affect allocative efficiency. FIGURE 1.7 Elements affecting efficiency in the use of Australia’s scarce resources. Aspects affecting efficiency in the use or allocation of resources Allocative efficiency Productive or technical efficiency Dynamic efficiency Intertemporal efficiency Showing decisions or choices that result in reduced efficiency and unemployment of resources Economic efficiency exists when there is maximum output gained from a given volume of productive inputs, thereby affecting productive capacity and helping to maximise society’s general wellbeing and material living standards. It can mean allocative, dynamic, productive and intertemporal efficiency. Earlier mention was made of the fact that if a nation chooses to produce at a point inside the PPF rather than somewhere on the PPF, this is regarded as an inefficient or wasteful use of resources, where there is unemployment. The shaded area inside the PPF in figure 1.8 shows this situation. The economy is clearly not operating at its capacity. Here, the total level of national output is lower than it could be and the combined production levels of both goods and services would be too low to ensure that all resources are fully employed. In other words, there would be unemployment of labour and other inputs, and material living standards would thus be reduced. UNCORRECTED PAGE PROOFS