“c05AggregateSupplyPolicies_PrintPDF” — 2022/6/14 — 4:32 — page 431 — #47
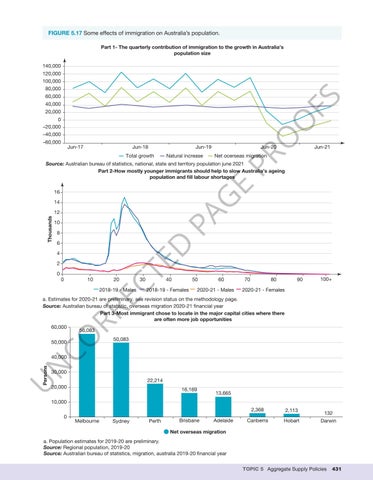
FIGURE 5.17 Some effects of immigration on Australia’s population. Part 1- The quarterly contribution of immigration to the growth in Australia’s population size 140,000 120,000 100,000 80,000
FS
60,000 40,000 20,000
PR O
O
0 –20,000 –40,000 –60,000 Jun-17
Jun-18
Jun-19
Total growth
Natural increase
Jun-20
Jun-21
Net ocerseas migration
E
Source: Australian bureau of statistics, national, state and territory population june 2021 Part 2-How mostly younger immigrants should help to slow Australia’s ageing population and fill labour shortages
G
16 14
PA
10 8 6
D
Thousands
12
2 0 10
20
30
40
CO RR EC
0
TE
4
2018-19 - Males
50
2018-19 - Females
60
2020-21 - Males
70
80
90
100+
2020-21 - Females
a. Estimates for 2020-21 are preliminary. see revision status on the methodology page. Source: Australian bureau of statistic, overseas migration 2020-21 financial year Part 3-Most immigrant chose to locate in the major capital cities where there are often more job opportunities 60,000
56,083
50,083
50,000
30,000
22,214
U
Persons
N
40,000
20,000
16,169
13,665
10,000 0
Melbourne
Sydney
Perth
Brisbane
Adelaide
2,368
2,113
Canberra
Hobart
132 Darwin
Net overseas migration a. Population estimates for 2019-20 are preliminary. Source: Regional population, 2019-20 Source: Australian bureau of statistics, migration, australia 2019-20 financial year TOPIC 5 Aggregate Supply Policies
431