“c04AggregateDemandPoliciesAndDomesticEconomicStability_PrintPDF” — 2022/6/7 — 8:31 — page 293 — #7
4.3 Sources of government revenue (receipts) KEY KNOWLEDGE • sources of government revenue, including direct and indirect taxation; progressive, regressive and proportional taxes; and revenue from government businesses and the sale of government assets.
FS
Source: VCE Economics Study Design (2023–2027) extracts © VCAA; reproduced by permission
PR O
O
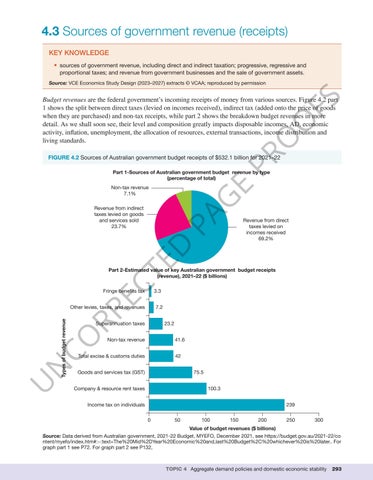
Budget revenues are the federal government’s incoming receipts of money from various sources. Figure 4.2 part 1 shows the split between direct taxes (levied on incomes received), indirect tax (added onto the price of goods when they are purchased) and non-tax receipts, while part 2 shows the breakdown budget revenues in more detail. As we shall soon see, their level and composition greatly impacts disposable incomes, AD, economic activity, inflation, unemployment, the allocation of resources, external transactions, income distribution and living standards. FIGURE 4.2 Sources of Australian government budget receipts of $532.1 billion for 2021–22
E
Part 1-Sources of Australian government budget revenue by type (percentage of total)
G
Non-tax revenue 7.1%
PA
Revenue from indirect taxes levied on goods and services sold 23.7%
TE
D
Revenue from direct taxes levied on incomes received 69.2%
CO RR EC
Part 2-Estimated value of key Australian government budget receipts (revenue), 2021–22 ($ billions) Fringe benefits tax
U
N
Types of budget revenue
Other levies, taxes, and revenues Superannuation taxes
Non-tax revenue
Total excise & customs duties
3.3 7.2 23.2 41.6 42
Goods and services tax (GST)
75.5
Company & resource rent taxes
100.3
Income tax on individuals
239 0
50
100
150
200
250
300
Value of budget revenues ($ billions) Source: Data derived from Australian government, 2021-22 Budget, MYEFO, December 2021, see https://budget.gov.au/2021-22/co ntent/myefo/index.htm#:~:text=The%20Mid%2DYear%20Economic%20and,last%20Budget%2C%20whichever%20is%20later.. For graph part 1 see P72. For graph part 2 see P132,
TOPIC 4 Aggregate demand policies and domestic economic stability
293