“c02DomesticMacroeconomicGoals_PrintPDF” — 2022/7/23 — 6:51 — page 179 — #79
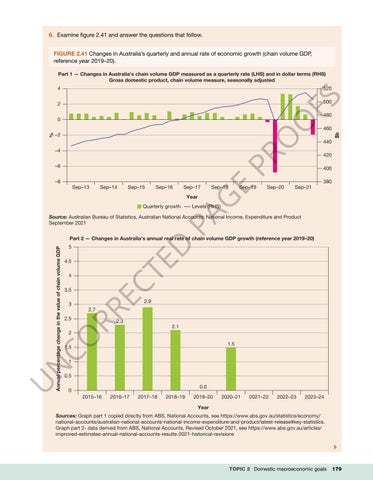
6. Examine figure 2.41 and answer the questions that follow. FIGURE 2.41 Changes in Australia’s quarterly and annual rate of economic growth (chain volume GDP, reference year 2019–20). Part 1 — Changes in Australia’s chain volume GDP measured as a quarterly rate (LHS) and in dollar terms (RHS) Gross domestic product, chain volume measure, seasonally adjusted 4
FS
520 500
2
480
–4
–8 Sep–13
Sep–14
Sep–15
Sep–16
Sep–17
Sep–19
420 400 380
Sep–20
Sep–21
Levels (RHS)
PA
Quarterly growth
Sep–18
440
G
Year
E
–6
460 $b
O
–2
PR O
%
0
Source: Australian Bureau of Statistics, Australian National Accounts: National Income, Expenditure and Product September 2021
D TE
4.5 4
CO RR EC
Annual percentage change in the value of chain volume GDP
Part 2 — Changes in Australia’s annual real rate of chain volume GDP growth (reference year 2019–20) 5
3.5
2.9
3
2.7
2.5
2.3
2.1
2
1.5
1.5
U
N
1
0.5 0.0
0 2015–16
2016–17
2017–18
2018–19
2019–20
2020–21
2021–22
2022–23
2023–24
Year Sources: Graph part 1 copied directly from ABS, National Accounts, see https://www.abs.gov.au/statistics/economy/ national-accounts/australian-national-accounts-national-income-expenditure-and-product/latest-release#key-statistics. Graph part 2- data derived from ABS, National Accounts, Revised October 2021, see https://www.abs.gov.au/articles/ improved-estimates-annual-national-accounts-results-2021-historical-revisions
TOPIC 2 Domestic macroeconomic goals
179