


Charles Dickens
1.1
Miami-Dade
Broward
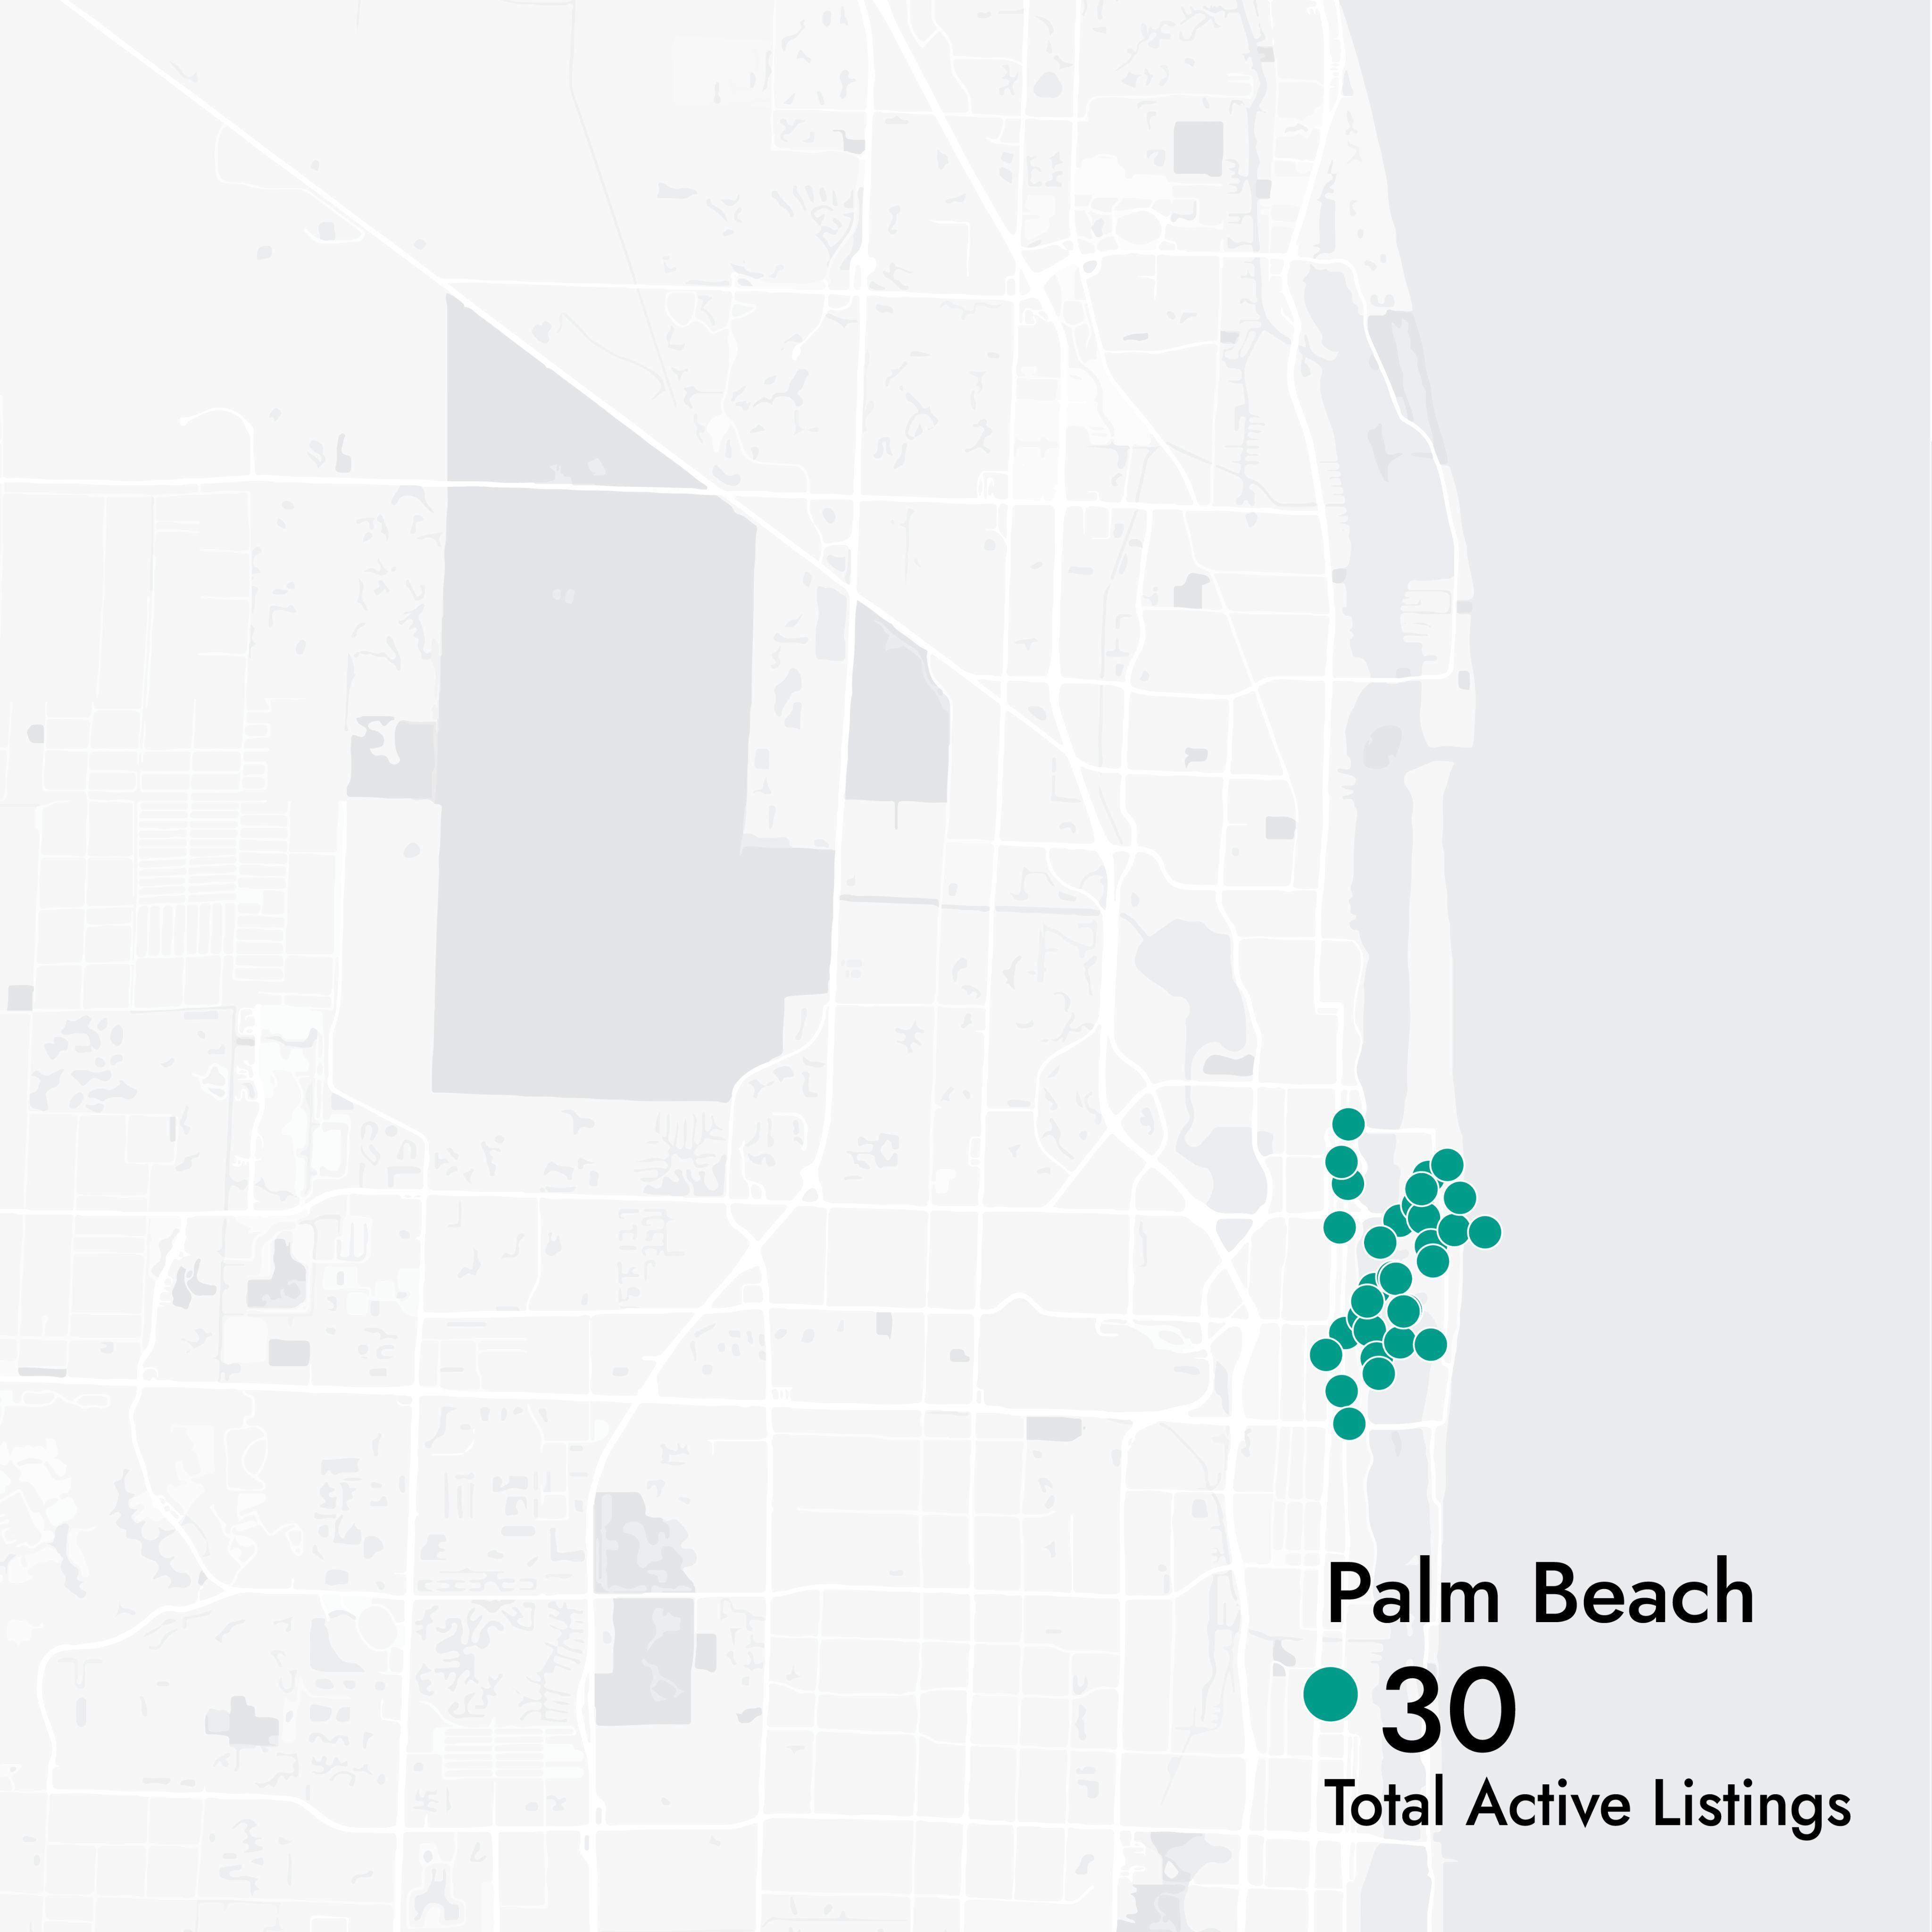
Palm Beach


2023 - 2024 Transactions by Price Range
Condos between $500,000 - $2,000,000
Total Active Single Family Homes By Category (A & B Houses) in Miami-Dade, Broward and Palm Beach Counties
Total ACtive listings AVG. PRICE
3,521 459 Q1-2024 Q1-2024 $18,000,000 $6,900,000 $21,000,000 $8,500,000
301 Q1-2025 2,266 Q1-2025
"B" Houses "A" Houses (Waterfront / Prime Locations) (Non-Waterfront / Prime Locations)
Total Active Single Family Homes By Category (C Houses) in Miami-Dade, Broward and Palm Beach Counties
Total ACtive listings
7,105 Q1-2024 13,985 Q1-2025 $850,000 $1,000,000
AVG. PRICE (Everything ELSE)

1,995 Q1-2020 17,249 Q1-2021 6,849 Q1-2022 8,497 Q1-2023 18,704 Q1-2024
23,009 Q1-2025
April, 2025
The number of local condos on the list, which is maintained by federally chartered mortgage finance corporation Fannie Mae, has more than doubled in the past two years.
The total number of condo buildings in the database in Miami-Dade, Broward and Palm Beach counties sits at 696 as of March.. That’s nearly half the 1,438 condo buildings that Fannie Mae lists as ineligible for its backing in all of Florida.
2024 Total Sales Transactions of Condos Sold Between $500,000 - $2M
11,927
676 Total Transactions Less than 10 Years Old

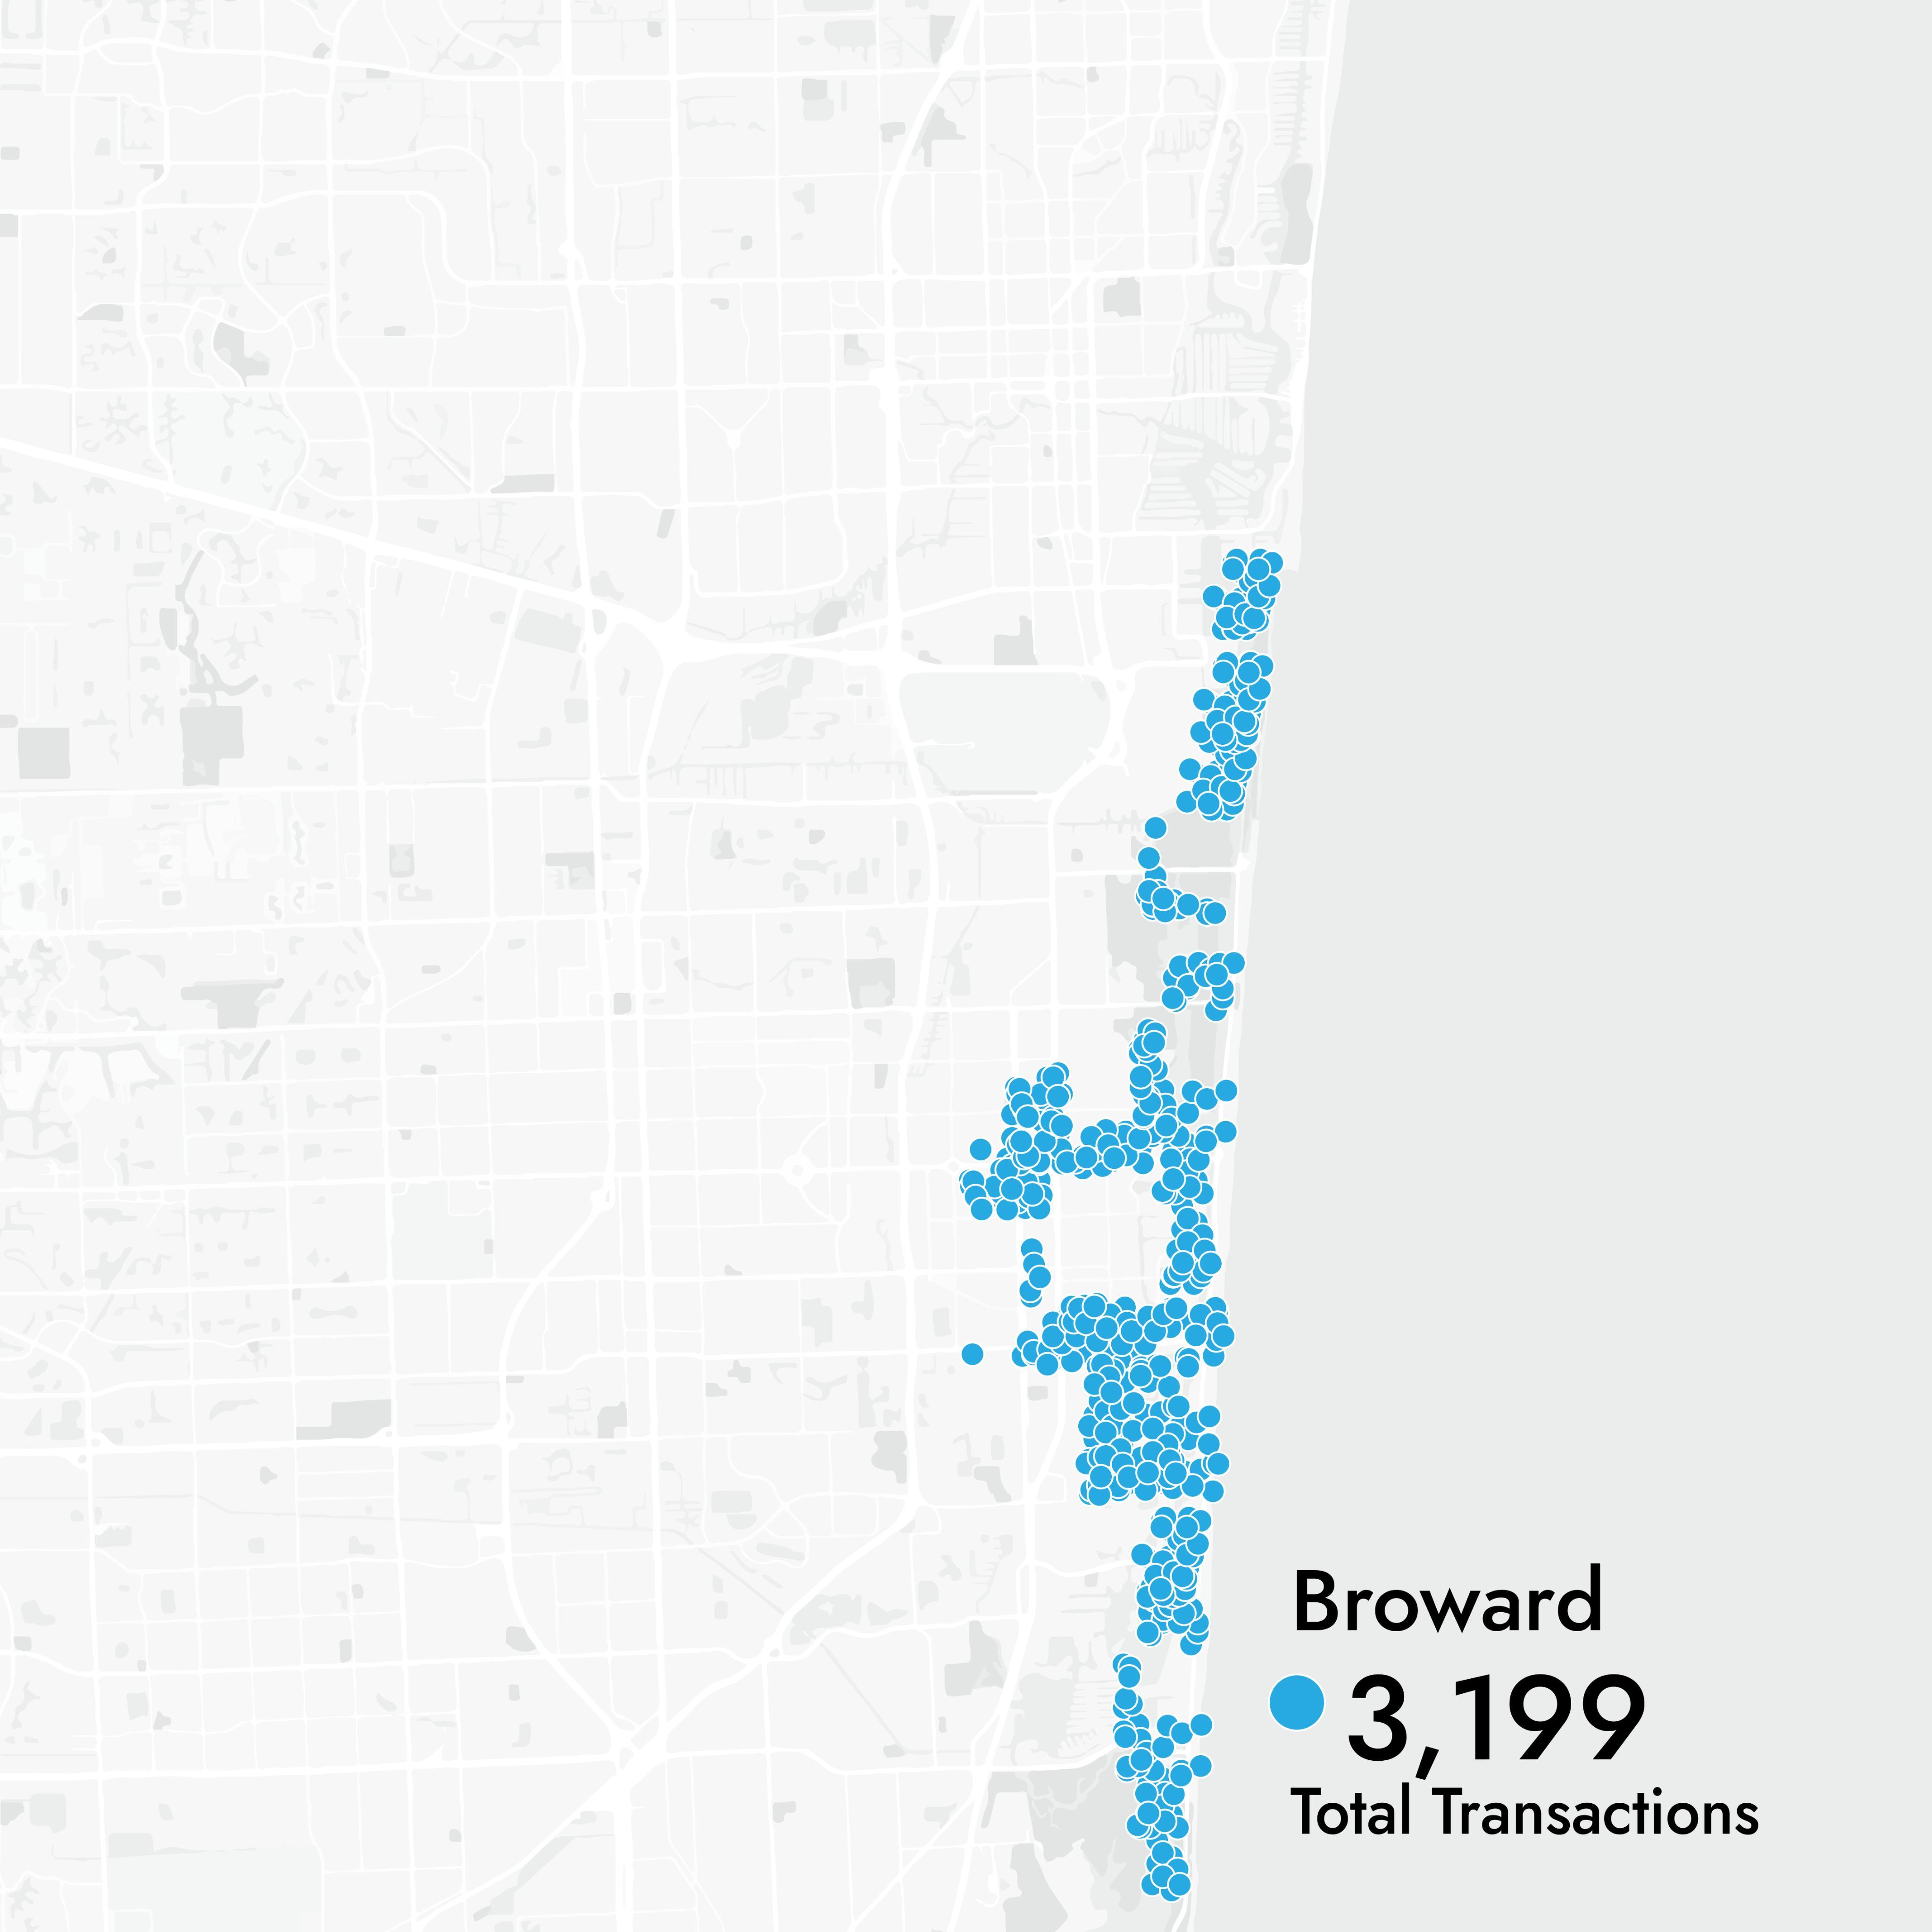
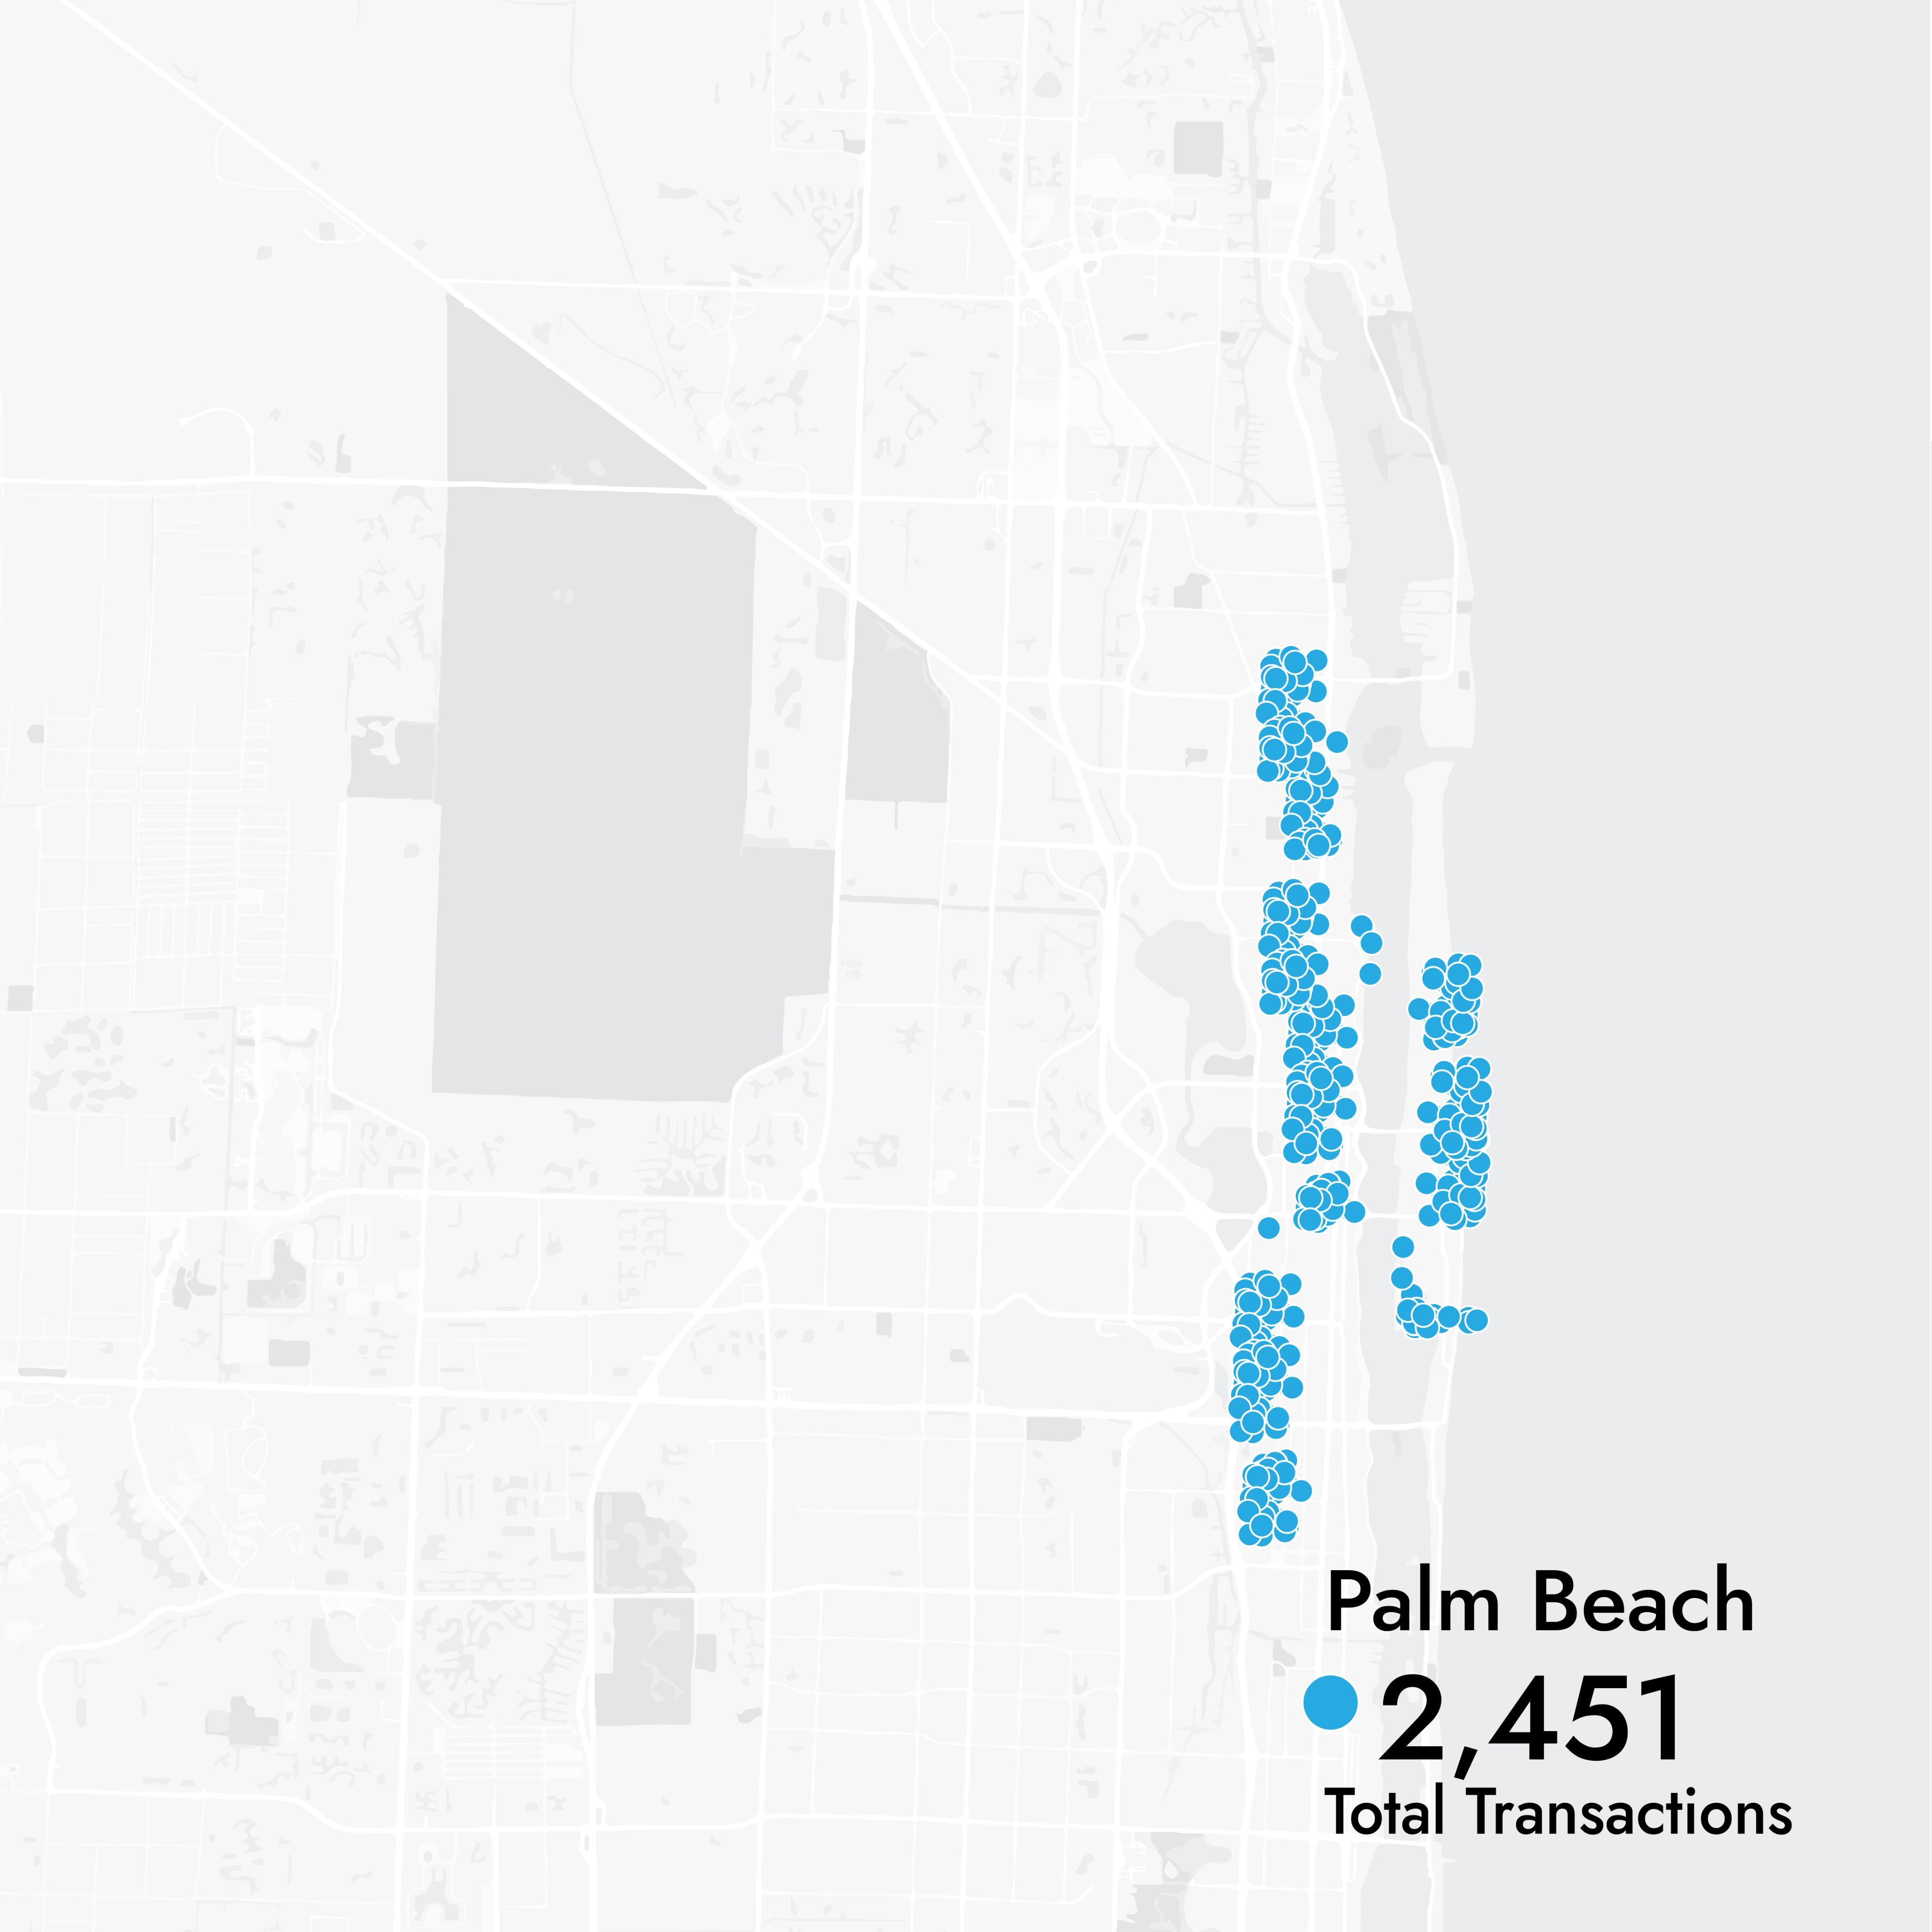
Total Condos Available for Sale Between $500,000 - $2M East of I-95 (No Daily Rentals)
Total Active Listings




August, 2024
South Florida’s multifamily construction pipeline reaches record, as developers seize on south Miami-Dade
Multi-Family Units Delivered Total Units Multi-Family 34,934 23,863 58,797
Multi-Family Units Under Construction

Record Breaking Daily Population Growth

