3 minute read
How does your system perform?


By David Rowe - DPIRD
Knowing the performance of your irrigation system is vital for optimising scheduling and improving production efficiency. One of the best indicators of irrigation performance is uniformity, which is how evenly water is applied to the irrigated area. Systems with high uniformity can produce even-growing crops more efficiently. This is because systems with poor uniformity must operate for longer in order to apply the right amount of water to all parts of the crop. This uses more power and creates ‘wet’ spots where water and nutrients move beyond the root zone and become unavailable to the plants.
Advertisement
Fixed overhead sprinklers
Performance data sheets for sprinklers indicate the level of uniformity to expect given a particular spacing, nozzle type and operating pressure. However, these indications do not account for real-world effects such as slope, wind and pressure variations which have a major impact on uniformity. The best way to assess the performance of overhead sprinkler systems is with a catch-cup test. This involves placing measuring cups in a grid pattern within the irrigated area, running the irrigation system for a set amount of time - usually 15 or 20 minutes – and then recording the depth of water captured in each cup.
Distribution uniformity (DU) is calculated by dividing the average of the lowest quarter of depths recorded


by the average of all depths recorded. This is then multiplied by 100 to obtain a percentage value. The industry minimum standard for overhead irrigation systems is a DU of 75%.
Example: Depth (mm) measurements from a catch-can test arranged from smallest to largest.
7, 7, 8, 8, 8, 9, 9, 9, 9, 9, 10, 10, 11, 11, 11, 11, 12, 12, 12, 13, 13, 14, 14, 15
Average of lowest quarter = 7.8 mm Average of total = 10.5 mm
7.8 × 100 = 74.6% DU 10.5
Tips for doing a catch-cup test
• Use at least 24 cups spaced at 2m apart to get a reliable result
Some cups measure volume (ml) while others measure irrigation depth (mm) and some measure both. Volume can be converted to depth using an equation
Choose a location that is representative such near the middle of the lateral where pressures are closer to the average
Do the test during typical wind conditions for your location to ensure results are representative of real conditions
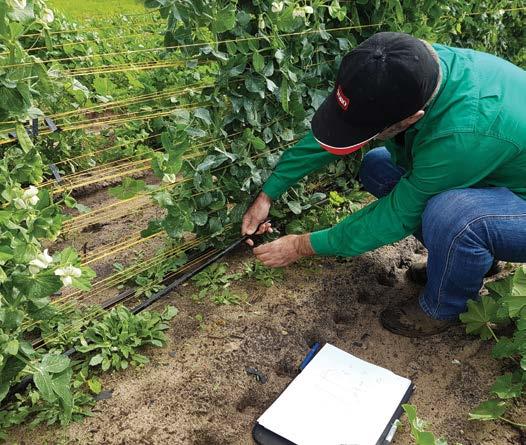
Above: DU testing a centre pivot
Centre pivots
Testing the uniformity of centre pivots uses a similar method to that for fixed overhead sprinklers. The main difference is the cups are arranged in a single line along the pivot radius. It is usually desirable to reverse the pivot once it finishes the first pass of the cups and then again after the second pass. This allows threes passes in quick succession which increases the reliability of the data. Cups are usually not placed along the innermost one or two spans as this allows more complete passes to be made over a given amount of time.
Drip systems
Testing uniformity of drip systems requires a slightly different approach to that for overhead systems. Using a small measuring cup, water is captured directly from an emitter over a set period of 30-60 seconds. This is replicated in different locations along several drip lines to ensure any pressure/flow variations are accounted for. About eight measurements is enough to calculate the average application rate (L/hr) and DU as described previously. The industry minimum standard for uniformity of drip irrigation systems is 85%.
For more information on measuring delivery of irrigation systems contact DPIRD’s Research Scientist David Rowe (david.rowe@dpird.wa.gov.au)
Below: Measuring flow rate of drip emitter