
International Research Journal of Engineering and Technology (IRJET) e-ISSN: 2395-0056
Volume: 13 Issue: 02 | Feb 2026 www.irjet.net p-ISSN: 2395-0072
International Research Journal of Engineering and Technology (IRJET) e-ISSN: 2395-0056
Volume: 13 Issue: 02 | Feb 2026 www.irjet.net p-ISSN: 2395-0072
Aaryan Ratnesh Shukla¹, Prof. Meghna Singh²
¹ Student, Department of Data Science,
ZSCT's Thakur Shyamnarayan Degree College (Affiliated to University of Mumbai), Mumbai, India
² Professor, Department of Data Science, ZSCT's Thakur Shyamnarayan Degree College (Affiliated to University of Mumbai), Mumbai, India
Abstract - Deforestation in Maharashtra, India, poses a critical threat to two globally significant ecological zones the Western Ghats UNESCO World Heritage biodiversity hotspot and the dense tropical forests of the Vidarbha region. Existing monitoring mechanisms, including the biennial Forest Survey of India (FSI) reports and globally scopedtools such as Global Forest Watch (GFW), suffer from significant temporal lags, a lack of district-level granularity, and zero accessibility for non-technical field officers. This paper presents VanRakshak, a web-based decision support platform integrating Google Earth Engine (GEE) satellite computations specifically Hansen Global Forest Change data at 30-meter resolution and GLAD deforestation alerts with an AI chatbot assistant (VanBandhu) powered by Google Gemini 1.5 Flash. The system delivers district-level forest loss analytics for all 36 Maharashtra districts, deforestation driver classification via ESA WorldCover 10meter land cover data, protected area vulnerability assessment using WDPA boundaries, emerging hotspot detection on a 5×5 km grid, linear trend forecasting for 2024–2025, and carbon emission estimation. VanBandhu enables Marathi and Hindi-language natural language interaction withsatellite data thefirstsuch capability for Maharashtra's forest monitoring domain. A three-tier caching architecture achieves sub-50ms response for cached queries. Gadchiroli records a cumulative forest loss of 11,585.784 ha (2001–2023) with agriculture expansion as the dominant driver (60–70%). VanRakshak establishes a replicable model for sub-national, vernacular-accessible forestmonitoringindevelopingregions.
Key Words: Forest monitoring, Google Earth Engine, deforestation detection, decision support system, large language models, multilingual AI, Maharashtra, remote sensing, GLAD alerts, Hansen GFW
1. INTRODUCTION
Maharashtra, India's second-most populous state, encompasses approximately 61,939 km² of recorded forest area, representing 20.1% of its total geographical extent [1]. This forest estate spans two ecologically distinct zones: the Western Ghats a UNESCO World Heritage Site and one of the world's eight biodiversity
hotspots andthedensetropicalforestsoftheVidarbha region, particularly in Gadchiroli (76.4% forest cover), Chandrapur, Gondia, and Nandurbar. Both zones face accelerating anthropogenic pressure from agricultural expansion,urbangrowth,andcoalmining.
Despitetheavailabilityofhigh-resolutionsatellite-derived datasets the Hansen Global Forest Change (GFC) dataset [2], Global Forest Watch (GFW), and GLAD deforestation alerts [3] their practical accessibility for Maharashtra's forest managers and field officers remains critically limited. The Forest Survey of India (FSI) publishes its State of Forest Report biennially, creating a structural two-year lag in actionable intelligence. GFW provides near-real-time data but lacks district-level granularity for Indian administrative units and offers no vernacular language support a significant barrier for frontlineofficersoperatinginMarathi.
This paper presents VanRakshak (meaning 'forest guardian' in Marathi/Hindi), a web-based, multistakeholder forest monitoring platform purpose-built for Maharashtra. VanRakshak integrates GEE satellite computation, ESA WorldCover land cover classification, WDPA protected area boundaries, and an AI-powered vernacular chatbot (VanBandhu) into a unified, zerotechnical-expertise interface. Section 2 reviews related literature. Section 3 describes the system architecture. Section 4 details VanBandhu. Section 5 presents results. Section6concludeswithlimitationsandfuturework.
Hansen et al. [2] established the foundational 30-meter global forest cover change dataset derived from Landsat imagery, enabling annual loss quantification from 2001 onward the primary data source in VanRakshak. Tamiminiaetal.[4]conductedasystematicreviewofGEEbased remote sensing applications in forestry, confirming the platform's efficacy for large-area analysis intractable on local infrastructure. Potapov et al. [5] extended Hansen's methodology with improved tree cover
International Research Journal of Engineering and Technology (IRJET) e-ISSN: 2395-0056
Volume: 13 Issue: 02 | Feb 2026 www.irjet.net p-ISSN: 2395-0072
dynamics classification, relevant to Maharashtra's mixed forestlandscape.
Turubanovaetal.[3]introducedtheGLADalertsystemfor near-real-time tropical forest disturbance detection, achieving approximately one-week latency directly implemented in VanRakshak's alert module. Tyukavina et al.[6]providedcomprehensiveglobaldeforestationdriver quantification using GEE, establishing the classification framework (agriculture, urban expansion, etc.) informing VanRakshak'sdriveranalysisengine.
Reddy et al. [7] analyzed Western Ghats forest fragmentation using multi-temporal remote sensing, documenting accelerating loss of interior forest patches directly relevant to VanRakshak's western district analytics. Kumar et al. [8] assessed India's official monitoring frameworks, identifying the biennial FSI reporting cycle and absence of district granularity as primary limitations the exact gaps VanRakshak addresses.Joshietal.[9]demonstratedthatnon-technical interfaces significantly increase GIS tool adoption among forest personnel, empirically validating VanRakshak's designphilosophy.Reichstein etal.[10]and Rolnick et al. [11] established the role of deep learning and LLMs in bridging raw satellite outputs and actionable environmental intelligence the application space VanBandhu operationalizes. No prior system has integrated GEE-based monitoring, GLAD alerting, districtlevel granularity, AI interpretation, and Marathi support forMaharashtra.
3.1
VanRakshak follows a decoupled client-server architecture. The frontend is a React 19 single-page application (SPA) bundled via Vite and hosted on the Vercel edge network. The backend is a FastAPI (Python) asynchronous REST API deployed on Google Cloud Run. Authentication is managed by Clerk via JWT tokens. Google Earth Engine handles all satellite computation via the Python earthengine-api SDK, while Google Gemini 1.5 Flash powers VanBandhu. Table 1 summarizes the full technologystack.
Table -1: VanRakshak Technology Stack
Component Technology
Frontend
React19+Vite+TailwindCSS
Maps/Charts Leaflet+Recharts
BackendAPI FastAPI+Uvicorn(Python)
Database SQLite→SupabasePG(planned)
SatelliteComputation GoogleEarthEngineAPI
AIChatbot GoogleGemini1.5Flash
Authentication Clerk(JWT)
FrontendHosting VercelEdgeCDN
BackendHosting GoogleCloudRun
Multilingual i18next(EN/ / )
GEE computations introduce 15–20 second latency per district query. VanRakshak resolves this through a threetier strategy. Tier 1 (Preload Cache): APScheduler precomputes GEE results for critical districts on startup, storedinSQLitewithone-hourTTL,servedat~50ms.Tier 2(CDNCache):APIresponsescarryCache-Control:public, max-age=3600 headers, enabling Vercel's edge CDN to serverepeatssub-50ms.Tier3(LiveGEE):Oncachemiss, the backend calls GEE via run_in_executor() thread pool, preventing the FastAPI event loop from blocking during the15–20secondoperation.
International Research Journal of Engineering and Technology (IRJET) e-ISSN: 2395-0056
Volume: 13 Issue: 02 | Feb 2026 www.irjet.net p-ISSN: 2395-0072
Annual forest loss is derived from the Hansen GFW lossyear band, filtered to Maharashtra district boundaries via GADM administrative geometries at 30-meter resolution, aggregated per year (2001–2023) and per district. Deforestation drivers are classified by spatially joining loss pixels to ESA WorldCover 2020 land cover classes at 10-meter resolution, identifying post-loss landscape correspondence to agriculture (Class 40), urban/built-up (Class 50), or other categories. Protected areavulnerabilityisassessedbyintersectinglosspolygons withWDPAboundaries,computingabsolutelossarea and loss-as-percentage-of-protected-areametrics.
Emerging deforestation hotspots are identified via a 5×5 kmregulargridoverlaidonMaharashtra.Cellswithrecent loss (2019–2023) disproportionate to historic baseline (2001–2018) are classified as 'New Front'; cells with sustained high loss across both periods are classified as 'Persistent.'Alinearregressionmodelfittedto2018–2023 annual loss valuesprojectsindicative estimatesfor 2024–2025 with R² reported per district. The application explicitly notes: 'Forecast uses linear trend extrapolation. Treatasindicativebaselineonly.'
4. VANBANDHU: AI MULTILINGUAL FOREST INTELLIGENCE
VanBandhu ('forest friend' in Marathi) is VanRakshak's integrated AI assistant powered by Google Gemini 1.5 Flash. It employs dynamic, per-request prompt construction assembling: (1) VanBandhu's expert Maharashtra forest analyst persona; (2) the selected district's live analytics data loss time-series, drivers, GLAD alert counts, and protected area loss metrics; (3) hardcodedMaharashtraforestdomainknowledge;and(4) a language directive to respond in the user's selected language (English, Marathi, or Hindi). This grounds all responses in actual computed data, minimizing hallucinationonfactualqueries.
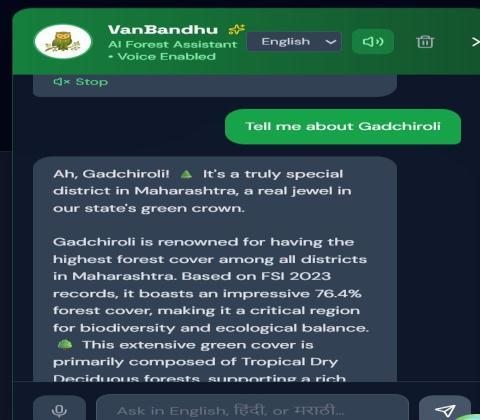
Fig -2: VanBandhu AI Forest Assistant in English mode, citing FSI 2023 data for Gadchiroli (76.4% forest cover). Interface supports EN/ / with voice output.
Sessioncontinuityismaintainedvianversation_memory.py, prepending the last N message exchanges to each Gemini API call. Marathi and Hindi generation leverages Gemini's native multilingual capability without an external translation layer. The VanBandhu service module (vanbandhu_service.py, ~41 KB) is the largest single codebase component, reflecting extensive prompt engineering investment. Three user personas Forest Official,Researcher,andCitizen/NGO aredifferentiated via GrowthBook feature flags, providing role-appropriate interfaceswithoutseparatedeployments.
Analysis of Hansen GFW data (2001–2023) via VanRakshak reveals that Gadchiroli records a cumulative forestloss of11,585.784ha atanaverageof584ha/year, withpeaklossin2011,coincidingwith infrastructureand mining expansion in the Vidarbha region. Figure 3 shows the full analytics dashboard displaying the loss timeline, deforestation driver breakdown, and carbon emission estimates.
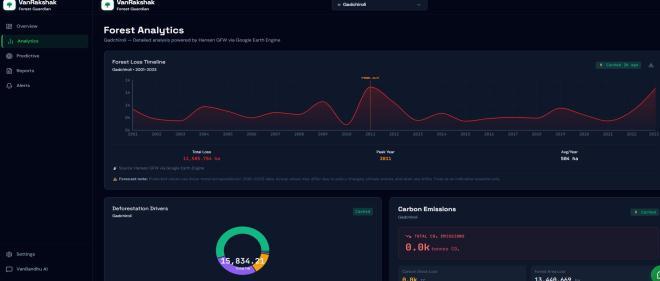
Fig -3: Analytics Dashboard Gadchiroli Forest Loss Timeline (2001–2023), total loss 11,585.784 ha, peak 2011, avg 584 ha/year. Source: Hansen GFW via Google Earth Engine.
International Research Journal of Engineering and Technology (IRJET) e-ISSN: 2395-0056
Volume: 13 Issue: 02 | Feb 2026 www.irjet.net p-ISSN: 2395-0072
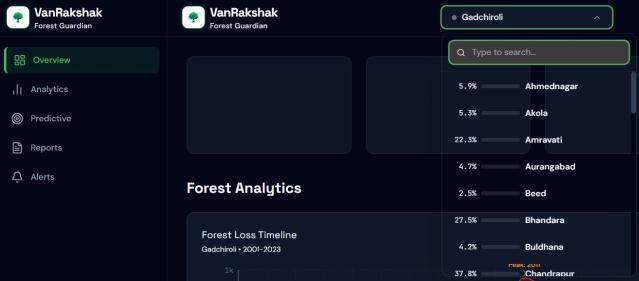
The loss time-series reveals a non-monotonic pattern: elevated loss during 2003–2005, a sharp peak in 2011, relative stabilization in 2014–2017, and an upward trend resuming from 2020. Agriculture expansion consistently emerges as the dominant driver (60–70% of total loss area) across all high-loss districts, followed by urban/built-up expansion (15–20%). Chandrapur (37.8%), Bhandara (27.5%), and Amravati (22.3%) rank among the highest relative loss districts in the state, as surfacedbythedistrictdropdownvisualization.
5.2 Emerging Hotspot Detection
The5×5kmgridanalysisforGadchiroliidentifiesspatially discrete 'New Front' (red) and 'Persistent' (orange) hotspot clusters (Fig. 4), enabling forest officers to prioritize field inspection resources. The Chandrapur boundary region exhibits the highest Persistent hotspot concentration, consistent with sustained mining and agriculturalencroachment. NewFronthotspotsineastern sub-tehsils indicate emerging deforestation fronts not yet capturedinaggregateddistrictstatistics.
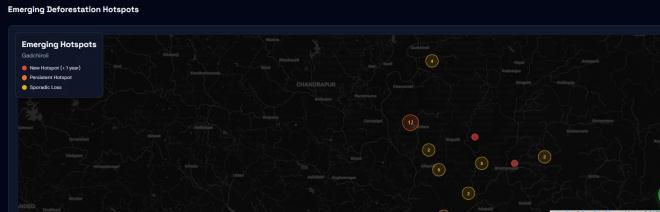
Fig -4: Emerging Deforestation Hotspot Map Gadchiroli: New Hotspot (red, <1 yr), Persistent (orange), Sporadic Loss (yellow) on 5×5 km grid. Near-Chandrapur corridor shows highest Persistent density.
5.3 Report Generation and Operational Utility
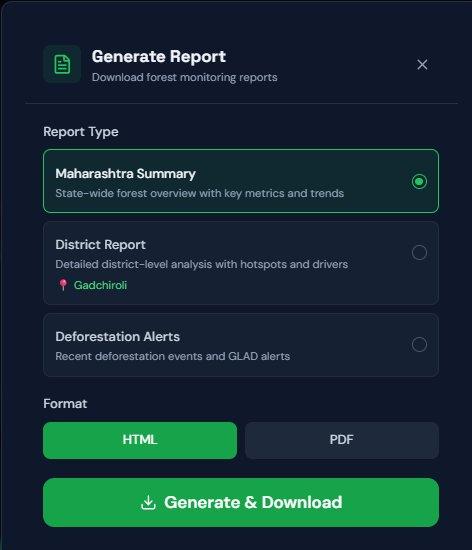
Fig -5: PDF/HTML Report Generator Maharashtra Summary, District Report (hotspots + drivers), and Deforestation Alerts report types for offline field deployment.
The report generation module (Fig. 5) produces three standardizedreporttypes MaharashtraStateSummary, DistrictReport,andDeforestationAlerts inbothHTML andPDFformat.Thisaddressesa critical operational gap: forest officials in field stations require offline-capable, printable summaries that no existing satellite platform providesforMaharashtra.
5.4 Performance Metrics and Comparative Analysis
Table -2: VanRakshak Performance Metrics and Key Findings
Metric Value
Preloadcache(Tier1) ~50ms
CDNedgecache(Tier2) <50ms
LiveGEEcompute(Tier3) 15–20seconds
VanBandhuresponse 3–6seconds
Hansenspatialresolution 30m/pixel
ESAWorldCover resolution 10m/pixel
Hotspotgridresolution 5×5kmcells
Districtscovered All36Maharashtra
Gadchiroliloss(2001–23) 11,585.784ha
Dominantdriver Agriculture(60–70%)
Table -3: Comparative Analysis VanRakshak vs. Existing Tools
Capability VanRakshak GFW FSI Bhuvan 36-district granularity
Marathi/Hindi support
International Research Journal of Engineering and Technology (IRJET)
Volume: 13 Issue: 02 | Feb 2026 www.irjet.net
Capability VanRakshak GFW FSI Bhuvan
NoGISexpertise needed
AIdata interpretation
PDFfieldreports
PAvulnerability analysis
This paper presented VanRakshak, a web-based, AIaugmented forest monitoring platform for Maharashtra, India, bridging the gap between raw satellite data and actionable intelligence for non-technical stakeholders. By integrating GEE's Hansen GFW, GLAD alerts, ESA WorldCover, and WDPA datasets with Gemini-powered multilingual VanBandhu, VanRakshak delivers districtlevel forest loss analytics, driver classification, hotspot detection, protected area vulnerability assessment, and trend forecasting through a zero-expertise interface. Gadchiroli's 11,585.784 ha cumulative loss (2001–2023) with a 2011 peak, and agriculture as the dominant driver (60–70%), represent the system's primary empirical contribution. The three-tier caching architecture demonstrates a practical solution to GEE's cold-start latency, achieving sub-50ms cached responses across all 36Maharashtradistricts.
Current limitations include: linear regression forecasting without climate variables (Prophet-based forecasting planned); SQLite unsuitable for large concurrent load (Supabase PostgreSQL migration underway); ESA WorldCover 2020 static snapshot; and VanBandhu susceptible to hallucination on hyper-specific queries if context injection fails. Future work will address GLAD-S2 Sentinel-2alertintegration,mobilePWAdeployment,realtime fire detection, and an expanded public API. VanRakshak demonstrates that the convergence of cloudbased Earth observation, large language models, and vernacular accessibility can meaningfully democratize satellite-derived environmental intelligence for frontline conservationcommunities.
[1] Forest Survey of India, "India State of Forest Report 2021," Ministry of Environment, Forest and Climate Change,Govt.ofIndia,Dehradun,2021.
[2] M. C. Hansen et al., "High-resolution global maps of 21st-century forest cover change," Science, vol. 342, no.6160,pp.850–853,Nov.2013.
[3] S. Turubanova, P. V. Potapov, A. Tyukavina, and M. C. Hansen, "Ongoing primary forest loss in Brazil, Democratic Republic of the Congo, and Indonesia," Environmental Research Letters, vol. 13, no. 7, p. 074028,2018.
[4] H. Tamiminia et al., "Google Earth Engine for geo-big data applications: A meta-analysis and systematic review," ISPRS Journal of Photogrammetry and RemoteSensing,vol.164,pp.152–170,2020.
[5] P. V. Potapov et al., "Global maps of cropland extent and change show accelerated cropland expansion in the twenty-first century," NatureFood, vol. 3, pp. 19–28,2022.
[6] A. Tyukavina et al., "Types and rates of forest disturbance in Brazilian Legal Amazon, 2000–2013," ScienceAdvances,vol.3,no.4,p.e1601047,2017.
[7]C.S.Reddy,S.Jha,andV.K.Dadhwal,"Assessmentand monitoring of long-term forest cover changes in Western Ghats biodiversity hotspot," Journal of Earth SystemScience,vol.125,no.1,pp.103–114,2016.
[8] A. Kumar, P. Sharma, and R. R. Mishra, "Limitations of biennial forest reporting in India," Forest Policy and Economics,vol.108,p.101952,2019.
[9] N. Joshi et al., "Understanding 'saturation' of radar signalsoverforests,"ScientificReports,vol.7,p.3505, 2017.
[10] M. Reichstein et al., "Deep learning and process understanding for data-driven Earth system science," Nature,vol.566,pp.195–204,2019.
[11] D. Rolnick et al., "Tackling climate change with machine learning," ACM Computing Surveys, vol. 55, no.2,pp.1–96,2022.