SEISMIC STUDY OF THE RC FRAME STRUCTURE BY USING THE PUSHOVER ANALYSIS WITH NON-LINEAR STATIC METHOD

Page 1


International Research Journal of Engineering and Technology (IRJET) e-ISSN:2395-0056

Volume: 12 Issue: 06 | Jun 2025 www.irjet.net p-ISSN:2395-0072

SEISMIC STUDY OF THE RC FRAME STRUCTURE BY USING THE PUSHOVER ANALYSIS WITH NON-LINEAR STATIC METHOD

1Master of Technology, Civil Engineering, Lucknow Institute of Technology, Lucknow, India

2Assistant Professor, Department of Civil Engineering, Lucknow Institute of Technology, Lucknow, India

Abstract - We perform an in depth pushover analysis of a G+19 RC frame construction with the Non Linear Static Method used. Pushover analysis is a known seismic performance method which helps shed light on how structures respond to lateral stresses. Finally, at fracture, each component is fatigued. In order to assess the safety and performance of the G+19 RC frame construction which is a typical high rise building, it is necessary to examine its reaction to seismic forces.

Also, in the initial research, a detailed description of the loading condition, structural configuration, and material properties are presented. The importance of model these non linear material and connection behavior correctly is highlighted. Pushover analysis, otherwise called Non-Linear Static Method, is what engineers use to test how buildings can resist earthquakes by gradually succeeding ones.

It will be defined by Indian Standard Code 1893 part1:2016, the RC frame structure will be defined using Indian Standard Code 456:2000 and different sections of code IS 875 will be used to determine the seismic load.

Key Words: Frame Structure, ETABS, Pushover, Nonlinear,G+19structure,ResponseSpectrumMethod.

1. INTRODUCTION

There are many reasons that tall buildings are built, depending on economic, geographi and sociological conditions. When there is a lack of available land in a highly crowded metropolitan area, it is more efficient to build tall structures as vertical construction means that space is utilized in an effective manner. It also helps in verticaldevelopmentforaddressingtherisingdemandfor housing and commercial spaces in congested urban areas where land utilization has to be optimized to the core. In addition, tall buildings symbolize financial success and serve as notable symbols to attract the attention of the town and augment its reputation and its international recognition [1]. Also economic reasons come into play in thedevelopmentoftallstructuresasdevelopersaretrying to find less cost effective solutions in places where land price are very expensive. However, it is also found that some of the high rise buildings have incorporated the sustainability and energy efficiency elements in the buildings. Also, the mix of this kind of projects, according

to [1], inside of these buildings creates vibrant urban settings where residential, commercial, and recreational zones are found together. The complex process of the choice to construct high rise is made in order to combat the ills of urbanization while creating visibly desirable, functionally feasible, and economically viable urban environments.

Earthquakes are any earthquakes that there exist which causes seismic activity that does have a large impact on buildings,thegroundshakingareseenbothinthevertical and horizontal orientations. The seismic waves, that originate from the epicenter of an earthquake, would cause vibrations which may endanger structures. The effect of the two is dependent on its distance from the epicenter,soilcompositionaswellasspecificarchitectural design. Structural damage occurs; fissures arise in walls and foundations, or partial or whole collapse of the structure may occur due to seismic activity. The inherent frequency of a building coinciding with some of the seismic wave (or earthquake) frequencies such that a resonant condition occurs inwhichtheshaking increases. Under particular situations it may compromise the stability of foundations by soil liquefaction. A weakened infrastructure is further stressed by aftershocks. Second,

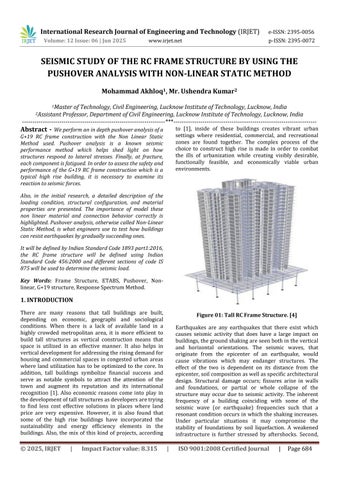
Figure 01: Tall RC Frame Structure. [4]

International Research Journal of Engineering and Technology (IRJET) e-ISSN:2395-0056

Volume: 12 Issue: 06 | Jun 2025 www.irjet.net p-ISSN:2395-0072

earthquakes can cause structural damage as well as non structural damage that affects utilities and interior components [2]. Mitigating measures include seismic design principles, and strict compliance with the rules of building so that a system can resist to seismic pressures andwouldmitigatethepossibilityofdamage.

1.1. Pushover Analysis on the RC Frame Structure

Thestructuralengineering basednonlinearstaticanalysis technique pushover analysis is used for evaluation of seismic behavior of reinforced concrete (RC) frame constructions. In this study, similar to what would be experienced from seismic forces, the horizontal pressures are applied progressively to the structure. These forces areallocatedaccordingto expectedseismic requirements. The construction is designed for both consideration of material and geometric nonlinearities due to reinforcing steel yielding and concrete cracking. We expect plastic hinges to develop at appropriate locations, where large plastic distortion is occurring. A capacity curve relating lateral load and lateral displacemet is produced by the study. This curve gives us information as to how the structure behaves under higher forces. This curve is used by engineers to evaluate performance, identify potential weakspots,andtoassurethatthestructurewillsatisfythe determined limit states. The pushover analysis is very useful in evaluating the seismic performance of, existing reinforced concrete frame structures. Thus, it offers a meaningful approach of determining how they act during earthquakes and how to design retrofitting or strengthening operations that enhance their capability to resistseismicevents.

ThePushoverAnalysisCurveisavisualresultproducedas a result of a nonlinear static analysis for the purpose of structuralassessmentindeterminingtheseismicbehavior ofthebuildingparticularlyreinforcedconcrete(RC)frame structures.Acrucialresultoftheworkissimplythecurve shown, illustrating the structure’s reaction to increasing lateral forces. The lateral load lateral displacement relation when the loads are slowly improved is shown in the graph [6]. Often the curve is comprised of the key

pointswiththedevelopmentofplastichingesinkeyspots of the structure. The shape of the curve gives away some oftheexecutionbehaviourofthestructurewhenstressed by seismic stress, and that it withstands deformation before it collapses. Engineers use the Pushover Analysis Curvetojudgecapabilityofmaterialsbaseduponstrength, ductility and probable flaws. This allows the determination of structural weaknesses and therefore choices on retrofitting tactics or procedures that effectivelyenhanceseismicresilienceofthestructure.

1.2. Purpose of Non-Linear Pushover Analysis

Civil and structural engineering often relies on such a method,whichisnon-linearpushoveranalysis,toevaluate how much stressful reaction of a structure can resist seismic activity. This is the main objective for replication of behavior of a building or structure when subjected to increasing sided leaning pressures simulating occurrence of plastic hinges and deformations in an earthquake. This research is used to assess the capability of a structure's resilienceanditspossiblevulnerabilitiestoseismicforces todeterminewhetheritwilldeviatefromasafeoperating state before the state of collapse. Nonlinear pushover analysis is used to identify those components and vulnerable areas where the plastic hinges are formed. Steerable tilt meters are a valuable tool for the development of efficient retrofit approaches to increase the seismic resilience of existing buildings. It has an additionalimportanttasktoadheretoarchitecturalnorms and standards that cannot be worked out with simply linear analytic techniques [7]. This study’s findings strengthen the use of performance based seismic design methods by making informed decisions, communicating effectively with stakeholders, and communicating the issues from the perspective of the performance based seismic design methods. Guaranteeing seismic safety and resilienceofbuildingsduringearthquakesiscrucial,which isbestachievedthroughnon-linearpushoveranalysis.

2. METHODOLOGY

In the methodology section, we will study the method of the analysis, software used for the analysis, material, framesectiondetails,seismicparameterdetails,etc.These alldetailsaregivenbelow:

2.1. Materials Details

Inthisresearchwork,wehaveselectedfourgradesofthe materialforRCframestructure,thesematerialdetailsare givenbelow:

Figure 02: Curve of Pushover Analysis [8]

International Research Journal of Engineering and Technology (IRJET) e-ISSN:2395-0056

Volume: 12 Issue: 06 | Jun 2025 www.irjet.net p-ISSN:2395-0072

Table 01: Details of the Materials

Serial Number Material Name with Grade Application

1 M30Concrete ForBeamandSlab

2 M35Concrete ForColumnOnly

3 Fe415SteelBar ForLateralReinforcement

4 Fe500SteelBar ForLongitudinal Reinforcement

2.2. Geometry of Model

In the geometry of the model, we will know about the dimension of the beam and, the dimension of the column. The thickness of the slab, plan area of the building, total floor height of the structure, etc. These details are given belowinthetablenumber02.

Table 02: Geometry of Model

Serial Number Geometry

1 Dimensionofthebeam Depth=650,width=325

2

3

4

6 PlanAreaoftheModel 21000*15000

7 SpanoftheBeam 3000

2.3.

Load on the Model

Inthesectionontheloadonthemodels,wewillknowthe typeofloadusedinthemodels,thedetailsoftheloadare giveninTableno03:

Table 03: Load on the Model

2.4. Seismic Load on the Model

In the models, we have used the Indian Standard Code 1893 part-1:2016, and the value used in the models is givenbelowinTable04.

Table 04: Seismic Parameter on the Model

1

2.5. Response Spectrum Analysis

The analysis method adopted is based on response spectrum method, a specific dynamic method of analysis. Response Spectrum Analysis as per IS 1893 Part 1:2016 plays an important role in seismic design of Indian structures. Spectral accelerations are employed as modal responses during the procedure by selecting a design spectrum according to the seismic zone and modeling the structure with the pertinent properties [10]. The results from these responses are combined then compared with the structure’s capacity for needed design modifications. Such systematic approach guarantees that buildings in seismic prone areas are more resilient towards earthquakes and safer. The graph of the response spectrumisgivenbelow:

Graph 01: response spectrum.

2.6. Pushover Analysis

Withthepushoveranalysis,wearecheckingthehingesin the structure. Pushover analysis for a reinforced concrete (RC) frame involves subjecting it to successive lateral loads and evaluating the structure response at each level.

International Research Journal of Engineering and Technology (IRJET) e-ISSN:2395-0056

Volume: 12 Issue: 06 | Jun 2025 www.irjet.net p-ISSN:2395-0072

Such method is used to assess the seismic performance and capacity of the frame through its displacement and force distribution. Engineers can utilize the simulation of seismic forces to identify the potential weaknesses of the frame, assess the structural stability and optimize the design parameters to maximize the frame's resistance to earthquakes. The pushover analysis is very helpful as it helps in developing robust earthquake resistant design of astructureunderextremeconditions[9].

2.7. Details View of the Model

Theplanview,elevationview,and3Dviewofthemodelis givenbelow:

Figure 03: (a) Plan View, (b) Elevation View, and (c) 3D View of Model.

3. RESULT AND ANALYSIS OF MODEL

In this section of the result and analysis of the model, we have selected important parameters, based on these parameters we will study whether the model is stable or not.Theparametersaregivenbelow:

1. DesignReactionoftheModel

2. LateralForceoftheModel

3. MaximumStoreyDisplacement

4. HingeResponseoftheColumn

5. HingeResponseoftheBeam

6. PushoverAnalysisaccordingtoASCE4113NSP

7. Pushover Analysis according to FEMA 440 EquivalentLinearization

3.1. Design Reaction of the Model

The design response of an RC frame structure entails predicting and mitigating the effects of forces and moments throughout the process of loading. Vertical responses at supports oppose the force of gravity, shear reactions resist horizontal forces, and moment reactions combat rotating inclinations. Engineers conduct analysis and design the structure to guarantee the ability of materials, such as concrete and steel, to endure these reactions [11]. The size and configuration of components are determined by safety, serviceability, and economic

considerations.Specialcareisgiventocriticalplaces,such asjoints.Theobjectiveistocreatearobuststructurethat can bear various types of loads while complying with designandsafetyregulations.

Thereare48columnsinthemodel,sothedesignreaction will be also 48. Here we have selected the load case Dead Load (because we have considered it as non-linear). The graphofthedesignisgivenbelow:

Graph 02: Design Reaction of the Model.

From the above graph of the design reaction, we found that the maximum value of the design reaction is 1519.2263KNatthenumber21(C21).

3.2. Lateral Force of the Model

By IS 1893 Part 1:2016, the base shear for a reinforced concretestructureduringanearthquakeisdeterminedby multiplying the seismic weight with the response accelerationcoefficient.The seismic weightistheproduct ofgravitationalaccelerationandtheeffectiveseismicmass is obtained by multiplying the mass participation factor withtheseismicmass.Specificfactorsandcoefficientsare outlined in the code, considering seismic zones, soil type, andstructuralcharacteristics.

The value of the lateral force on the structure is given belowintheformofthegraphattheloadcaseEY:

Graph 03: Lateral Force on the Model at the Load Case EY.

International Research Journal of Engineering and Technology (IRJET) e-ISSN:2395-0056

Volume: 12 Issue: 06 | Jun 2025 www.irjet.net p-ISSN:2395-0072

Fromtheabovegraphof thelateral forceonthe model at theloadcaseEY,the maximumvalueexists atfloorno 19 ofthemodel.

3.3. Maximum Storey Displacement

The term "maximum storey displacement" denotes the greatest horizontal displacement encountered by a structure during seismic occurrences. Seismic design is of utmost importance as it indicates the structure's capacity to endure earthquakes. Inter-storey drift is a measurement that shows the relative movement between floors that are next to one other. Engineers use sophisticated analysis to forecast and regulate these displacements while complying with design norms and standards. Enforcing a restriction on the maximum displacement of a building's storeys guarantees the structural soundness of the building, so mitigating potential damage and assuring the safety of its occupants inregionspronetoearthquakes.

The graph of the maximum storey displacement of the model is given below at the load case PAY (Pushover AnalysisinY-Direction).

Concerning Graph 04, the maximum storey displacement exists existing the top floor of the model. As we know accordingtotheIS1893part1:2016,themaximumstorey displacementshould not be greater thanH/250(where H representsthetotalheightofthestructureinmm.)

3.4. Hinge Response of the Column

Pushover analysis entails monitoring the plastic deformation of column hinges in response to seismic occurrences. Plastic hinges are formed when a column section achieves its maximum ability to resist deformation,resultinginasubstantial rotationwithoutan increase in resistance [12]. The precise positioning and size of these hinges provide valuable information about a structure's capacity to absorb and redistribute seismic pressures, assisting engineers in evaluating its overall ductility and resilience. Analyzing the reaction of column hinges using pushover analysisprovidesvaluable insights

for making informed choices about retrofitting or constructing buildings to enhance their seismic performanceandensurethesafetyofoccupants.

Thereare48columnsoneveryfloorofthemodels,andwe haveselectedcolumnnumber01ontheground,first,and second floors. Thehinges response of thecolumnis given below at the load case PAX (Pushover Analysis in the XDirectionofthemodel)

Figure 04: Hinge Response of the Column

FromFigure 04, the valueofthe M3 momentincreases as increasingthefloorheightofthestructureattheloadcase PAX(PushoverAnalysisofthemodelintheX-direction).

3.5. Hinge Response of the Beam

Duringpushoveranalysis,theoccurrenceofplastichinges ina beam's response indicates the development of plastic deformation when subjected to lateral stresses. These hinges, which are produced at points of yielding, enable the dissipation of energy and redistribution of forces, so avoidingsuddenstructuralcollapse.Thehingeresponseis essential for evaluating the ductility of a structure. It provides engineers with information about how the structure performs under various limit conditions. This information is valuable for capacity design and helps in identifyingprobablefailuremodeswhensubjectedtohigh lateralpressures.

Thereareatotalof82beamsoneachlevel ofthemodels. Wehavechosenbeamnumber01fortheground,first,and second floors. The beam's hinge reaction is shown below for the PAX load situation, which involves doing a PushoverAnalysisinthedirectionofthemodel.

Figure 05: Hinge Response of the Beam Frame

Graph 04: Maximum Storey Displacement at load Case PAY.

International Research Journal of Engineering and Technology (IRJET) e-ISSN:2395-0056

Volume: 12 Issue: 06 | Jun 2025 www.irjet.net p-ISSN:2395-0072

3.6. Pushover Analysis according to ASCE 41 13 NSP

Pushover analysis, according to ASCE 41-13 NSP, evaluates the seismic performance of a structure by applyinggraduallateralloads.Theprimaryemphasisison deformation rather than force, using a finite element model to accurately reproduce real-world behavior. The resultant capacity curve establishes a relationship between lateral forces and structural deformations. The analysis takes into account various levels of performance and guides retrofit solutions to achieve the acceptance requirements of ASCE 41-13 NSP. Documentation is essential for recording the outcomes and selected modifications that are crucial for enhancing the ability of buildings to withstand seismic activity in areas close to activefaultlines.

The static pushover curve of the mode is given below at theloadcasePAX(PushoverAnalysisinX-Direction)using ASCE4113NSP.

As we can see from Figure 06, the capacity curve of the pushover analysis is a little high as compared to the bilinearcurveofthepushoveranalysis.

3.7. Pushover Analysis according to FEMA 440 Equivalent Linearization

The use of Equivalent Linearization, following FEMA 440, is applied in pushover analysis to evaluate the seismic performance of a structure. The approach entails approximating the non-linear behavior by using a

sequence of linear segments. The finite element model undergoes incremental lateral forces, and the resultant connection between force and displacement is linearized. Subsequently, this comparable linear system is used for dynamicanalysis.Thistechniqueenablestheidentification of possible vulnerabilities and the recommendation of retrofittingactionstoimprovetheseismicresilienceofthe structure. Nevertheless, it is important to use caution when interpreting the findings, and it may be essential to conductfurtherstudiestogetafullreview.

At the load scenario PAX (Pushover Analysis in XDirection),thestaticpushovercurveofthemodeisshown below. This curve was generated with FEMA 440 EquivalentLinearization.

Figure 07: Pushover Analysis according to FEMA 440 Equivalent Linearization

4. CONCLUSION

After completing the Pushover Analysis of the model by using the ETABS software, and using the Indian Standard Code 1893 part1:2016. The conclusion of the works are givenbelow:

From the design reaction of the model, we found that the maximum valueof thedesignreactionatsupportnumber 21is 1519.2263KN, and the minimumvalue of the design reaction at support number 01 is 1171.6029KN. The total difference between the maximum design reaction and the minimum design reaction is 22.8816 percent. Concerning these values, hinges will be generated first at support number21andthelastatsupportnumber01.

Thevalueofthelateralforceonthemodelattheloadcase EY (Earthquake force in the Y- Direction of the model) is

Figure 06: Pushover Analysis according to ASCE 41 13 NSP

International Research Journal of Engineering and Technology (IRJET) e-ISSN:2395-0056

Volume: 12 Issue: 06 | Jun 2025 www.irjet.net p-ISSN:2395-0072

maximum at the second last floor of the model from the bottom, and minimum value of the lateral force is at the groundfloorofthemodel.Becauseweknowthatthevalue ofthelateralforceonanystructureincreasesastheheight ofthe structure increases.Thevalueof the lateral force is get little low as compared to floor number 19, this is because we did not consider the floor finishing load on thatfloor.

IntheresultoftheHingeresponseofthecolumnmember of the model at the load case PAX (Pushover Analysis of themodelinX-Direction),thegraphrepresentstheplastic rotationvs moment. The maximum bending moment is at the second floor of the model which is approximately 42.34KNm at the plastic rotation 1.41 radian at column number 01 (C1), and the minimum value of the bending moment is at the ground floor of the model which is 11.12KNmatthesameplasticrotation.

From these conclusions, we found that the chances of generating plastic hinges in the structure are increased if the dimensions of the beam-column, and reinforcement arenotsufficientaccordingtotherequirementoftheload onthestructure.

REFERENCE

[1]. Zizi, M.; Bencivenga, P.; Di Lauro, G.; Laezza, G.; Crisci, P.; Frattolillo, C.; De Matteis, G. Seismic Vulnerability Assessment of Existing Italian Hospitals: The Case Study of the National Cancer Institute “G. Pascale Foundation” of Naples. Open Civ.Eng.J.2021,15,182–202.

[2]. Kassem, M.M.; Nazri, F.M.; Farsangi, E.N. The seismic vulnerability assessment methodologies: A state-of-the-art review. Ain Shams Eng. J. 2020, 11,849–864.

[3]. Bekta¸s, N.; Kegyes-Brassai, O. Conventional RVS Methods for Seismic Risk Assessment for Estimating the Current Situation of Existing Buildings: A State-of-the-Art Review. Sustainability2022,14,2583.

[4]. YishuXia1,2,WuxiongLi3,WeiyaLiu2,Yanhui Liu 1,*, Xin Xu 1 and Chenyun Zhang “Experimental Study of Frame-Supported Shear Wall Structure of High-Rise Buildings with TransferSlabinMetroDepot”Buildings2022,12, 1940.

https://doi.org/10.3390/buildings12111940

[5]. Ray, P.P.R.; Kegyes-Brassai, O.K. Orsolya Katalin Kegyes-Brassai Earthquake Hazard Analysis and Building Vulnerability Assessment to Determine theSeismicRiskofExistingBuildingsinanUrban Area Title of the dissertation: Earthquake Hazard AnalysisandBuildingVulnerabilityAssessmentto Determine the Seismic Risk of Existing Buildings in an Urban Area. Ph.D. Thesis, Széchenyi István University,Gy˝or,Hungary,2015.

[6]. FEMA. Fema Improvement of Nonlinear Static Seismic Analysis Procedures; FEMA 440; FEMA nehrp:RedwoodCity,CA,USA,2005.

[7]. Seismic Evaluation and Retrofit of Concrete Buildings Volume 1 aTe Applied Technology CouncilProposition122SeismicRetrofitPractices Improvement Program. Available online: www.4downloader.ir (accessed on 21 August 2023).

[8]. Vijayakumar, D. L. V. Babu, “Pushover Analysis of Existing Reinforced Concrete Framed Structures”, European Journal of Scientific Research, Vol.71, No.2,pp.195-202,2012

[9]. M. S. Attar, “Evaluation of the Seismic Performance of A Typical School Building”, M. S. Thesis, King Abdul Aziz University, Saudi Arabia, 2003

[10]. P.Poluraju,N.Rao,“PushoverAnalysisof reinforced concrete frame structure using SAP 2000”, International Journal of Earth Science and Engineering ISSN 0974-5904, Vol. 04, No. 06, pp. 684-690,2011.

[11]. Skokan M. J. Hart G.C. (2000) ‘Reliability of Nonlinear Static Methods for the Seismic PerformancePredictionofSteelFrameBuildings.’ Proceedings 12th World Conference on Earthquake Engineering, Paper No. 1972, Auckland,NewZealand.

[12]. Williams M.S., Albermani F. (2003) ‘Evaluation of Displacement-Based Analysis and Design Methods for Steel Frames with Passive Energy Dissipators.’ Civil Engineering Research Bulletin No. 24, Department of Civil Engineering, UniversityofQueensland.

Turn static files into dynamic content formats.

Create a flipbook
Issuu converts static files into: digital portfolios, online yearbooks, online catalogs, digital photo albums and more. Sign up and create your flipbook.