
International Research Journal of Engineering and Technology (IRJET) e-ISSN: 2395-0056
Volume: 12 Issue: 04 | Apr 2025 www.irjet.net p-ISSN: 2395-0072
International Research Journal of Engineering and Technology (IRJET) e-ISSN: 2395-0056
Volume: 12 Issue: 04 | Apr 2025 www.irjet.net p-ISSN: 2395-0072
Prajeeth L1 , V Punya Lakshmi2 , Mr. Nagaraj A3 , Ms. Sridevi Nagaraja4
1,2Students, Computer Science and Engineering, Jyothy Institute of Technology, Bengaluru, India
3ProfessorofPractice, Computer Science and Engineering, Jyothy Institute of Technology, Bengaluru, India
4Founder and CEO, NiyantTEK Private Limited, Bengaluru, India
Abstract - MarketPulse is a dynamic, real-time financial analytics platform designed to streamline the process of stock market analysis and decision-making. Combining the power of data science, machine learning, and web scraping technologies, the platform delivers real-time stock prices, predictive analytics, sentiment analysis, and interactive chart visualizations. Built using Django and React.js, it leverages third-party financial news APIs services to provide updated market trends and data. Users can compare stocks, track market indices, explore news sentiment, and visualize data using tools like Chart.js and D3.js. The integration of real-time data with smart analysis tools ensures accurate risk assessment, making MarketPulse a complete decisionsupport system for investors, traders, and financial enthusiasts.
Key Words: Financial Analysis, Stock Forecasting, Django, React.js, Real-time Data, Financial Dashboard, Data Science
In the rapidly evolving financial landscape of today, having immediate access to precise market data and analytics is essential for making prompt and wellinformed investment choices. MarketPulse is a comprehensiveonlinefinancialanalysisplatformdesigned to meet this demand by combining data science, web scraping, and modern visualization technologies. This system utilizes both real-time and historical stock data, financial news, and sentiment analysis to provide actionable insights through a user-friendly interface. Developed with Django for backend processing and React.js for the frontend, the platform includes features such as interactive stock charts, stock comparisons, a MarketMoodIndicator,andacustomizablewatchlist.Data is gathered from reliable APIs. By offering a centralized, enhanced dashboard for examining market trends, MarketPulse enables traders, investors, and financial enthusiasts to make more intelligent, data-driven decisions.
The financial market is known for its significant volatility and intricate nature, presenting difficulties for
investors and traders who depend on conventional techniquestoeffectivelyassessmarketdynamics.Totackle this challenge, MarketPulse was developed as a datafocused platform aimed at streamlining stock market analysis by utilizing visual tools and integrating real-time data. The main goal of this initiative is to enable users to understand market trends, assess risks, and make wellinformed decisions, all through an intuitive interface backedbystrongdataanalytics.
MarketPulse'sprimarygoalistomakefinancialanalysis moreaccessible byconvertingintricatestock marketdata into easy-to-understand visual representations. This approach helps users grasp market trends and dynamics more effectively. Additionally, the platform is designed to offer real-time stock monitoring features, allowing users toobservechangesandmovementsastheyoccur.Finally, it guarantees the provision of interactive charts and secure data access, which enhances both user experience anddatasecurity.
The purpose of MarketPulse is to provide a real-time financial dashboard with in-depth knowledge about the world stock market. The platform has AI-powered components including the Market Mood Indicator, which assessesinvestoremotionand riskratingsbasedoncurrent data.Additionally,usersmayaccesssectoralandworldwide indexes, which gives them a comprehensive picture of the financial environment and aids in improved decisionmaking. A responsive experience across devices is guaranteed by the system, which is fundamentally scalable and user-friendly. It also facilitates future improvements andintegrationwithnewfeaturesanddatasources.
The stock market is a dynamic and complex system where shares of publicly traded companies are continuouslyboughtandsold,withtheirvaluesinfluenced byfactorssuchassupplyanddemand,investorsentiment, and macroeconomic indicators. Beyond facilitating trades, it reflects the financial health of companies, sectors, and
International Research Journal of Engineering and Technology (IRJET) e-ISSN: 2395-0056
Volume: 12 Issue: 04 | Apr 2025 www.irjet.net p-ISSN: 2395-0072
entire economies. Effective stock market analysis requires interpreting a wide range of data price fluctuations, trading volumes, and news sentiment to predict trends andguideinvestmentdecisions.
MarketPulse was developed to simplify this complex analysis process for users of all experience levels. It provides real-time stock prices, historical data, and sentiment-based insights, all presented through interactive, customizable charts. Unlike traditional static graphsormanualdataanalysis,MarketPulseenablesusers tomonitorlivemarkettrends,comparestockperformance, and assess market sentiment all within a single, userfriendly platform. By converting raw data into actionable insights, MarketPulse empowers investors to make confident,informeddecisions.
Data science is at the heart of modern stock market analysis, enabling users to derive actionable insights from vast and complex datasets. In MarketPulse, data science techniquesareemployedtoanalyzehistoricalstockprices, track market trends, and visualize key metrics that influence stock performance. By processing large volumes offinancialdata,theplatformhelpsusersidentifypatterns, correlations,andpricemovementswithgreaterclarityand efficiency. Rather than simply displaying raw numbers, MarketPulse transforms financial data into interactive charts and comparative visualizations using libraries like Chart.js and React Charts. It incorporates statistical techniques such as moving averages, percentage change calculations, and price-volume correlation to generate meaningfulinsights.
The platform also leverages web scraping tools like BeautifulSouptocollectreal-timefinancialnewsandstockrelatedupdatesfromtrustedsourcessuchasMoneycontrol andEconomicTimes.Thiscuratedinformationhelpsusers understand the broader market environment alongside technical trends. By combining data science and web scraping, MarketPulse offers a smarter, more informative experience than traditional stock tracking platforms. It empowersuserstomakeinformeddecisionsbypresenting timely,processed,andvisuallyrichdatathatcapturesboth market performance and sentiment-driven developments inauser-friendlyinterface.
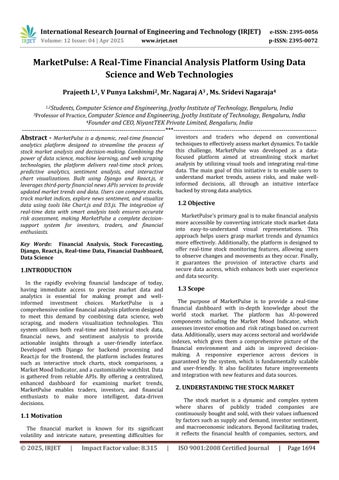
DatavisualizationplaysacriticalroleinMarketPulseby transformingrawstockmarketdataintomeaningfulvisual insights that enhance user understanding and decisionmaking. The platform utilizes advanced libraries like Chart.js, React Charts, and Google Charts to render realtime and historical data through interactive and dynamic visual elements. Users can explore candlestick charts, line graphs, and bar charts to analyze stock performance over
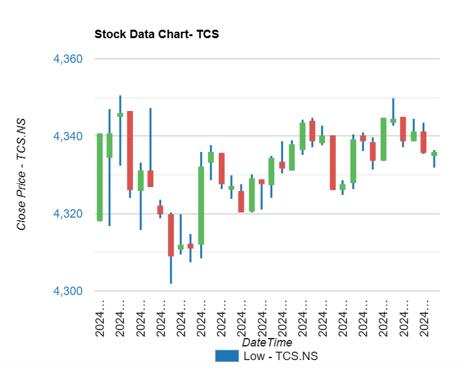
different intervals and compare multiple stocks or indices onaunifiedtimeline.Customchartcontrolsallowusersto adjust parameters like time range, chart type, and data intervals, offering granular control over the analysis. Additional tools such as zoom, drag, and tooltip features enable deeper inspection of price movements and trading patterns.
The visualization layer also incorporates market mood indicators,sectoraltrends,andindexcomparisons,making it easier for investors to assess bullish or bearish sentiments and recognize key market signals. By presenting complex financial data in an intuitive and responsive format, the platform empowers users to make informed trading and investment decisions with confidence.
3. RELATED WORK
3.1 Literature Survey
Numerous studies have explored the application of machine learning and data science techniques for stock market forecasting and analysis. Amisha Kirti et al. [1]
International Research Journal of Engineering and Technology (IRJET) e-ISSN: 2395-0056
Volume: 12 Issue: 04 | Apr 2025 www.irjet.net p-ISSN: 2395-0072
employed models like LSTM, GRU, and SVR to predict stock indices, concluding that LSTM and SVR yielded better accuracy, supported by metrics such as RMSE and R².TheirworkalsoproposedaninteractiveMLdashboard forvisualizingmarkettrends.Similarly,ShrawaniPagaret al. [2] implemented data science tools like Python and YFinance for technical analysis, combining data preprocessing and feature engineering with trading pattern recognition to enhance investment strategies. Jai Jagwani et al. [3] took a time series approach, integrating ARIMA and Holt-Winters models to forecast Apple Inc.'s prices using Yahoo Finance data, noting that combining seasonal and non-seasonal models improved prediction accuracy. Meanwhile, Kamaladdin Fataliyev et al. [4] emphasized the importance of text-based data news, social media, and financial reports in stock forecasting, applying NLP and sentiment analysis to extract insights andidentifychallengesinpredictivemodeling.
Other works reinforce the role of visualization and statistical tools in financial forecasting. Sameer Yadav [5] examinedIndianmarketvolatility,linkingmacroeconomic factors and speculative trading to price fluctuations while reviewing control mechanisms like circuit breakers. Bharat Gupta et al. [6] utilized Monte Carlo simulations and Bootstrap methods for risk assessment, demonstrating that visualizing stock trends enhances decision-making. A. Leelavathi et al. [7] proposed a Python-based SVM model paired with candlestick and correlation charts, which improved user analysis and stockclassification.Dr.KanahaiyaLalAmbashthaetal.[8] analyzedNifty-50withtechnicalindicatorslikeSMA,EMA, and Dow Theory, validating buy/sell signals with statisticaltests.FlorinaCovacietal.[9]createdafinancial dashboard integrating real-time data and key financial ratios, enabling informed trading. Finally, Sneh Patil et al. [10] presented a holistic approach using technical and fundamental indicators along with algorithmic trading models, showcasing the advantages of data-driven forecasting in minimizing human bias and enhancing investmentstrategies.
4.1
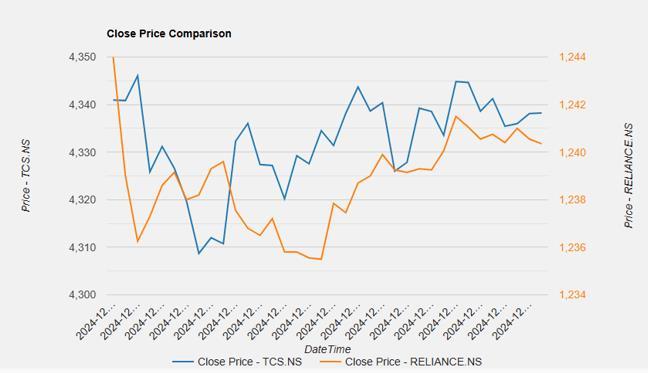
The proposed operational framework of MarketPulse adheres to a systematic, real-time financial analytical methodology that aids investors and traders in executing data-informed decisions through the utilization of sophisticated visualization and sentiment analysis instruments. The platform amalgamates both historical and real-time stock information, presenting insights via interactive, customizable charts that facilitate users in monitoring stock trends, sectoral performance, global indices, currencies, and commodities. A salient feature is the Market Mood Indicator, which quantifies sentiment
through the integration of market volatility and performancemetrics,furtheraugmentedbythesentiment analysis of financial news. The operational process commences at the User Interaction layer, where users undertake actions such as searches, clicks, and submissionsviaawebinterface.
These inputs are subsequently processed by the Client Layer,which transmitsHTTPrequeststo the APIServices (Presentation Layer). The API layer is responsible for validating and routing the requests to the Business/Application Layer, where the core logic is executed encompassingdataretrieval,analysis,machine learningpredictions,andsentimentscoring.TheDatabase Layer oversees the management of the storage and retrieval of processed stock data, user preferences, and sentiment-classified news articles. Ultimately, the system transmitstheresponseback throughtheAPItotheclient, where the UI is dynamically refreshed with visual and analytical feedback. This cohesive flow guarantees that users obtain timely, precise, and actionable financial insights, thereby facilitating efficient and informed investmentstrategies.
The innovative evolution of the MarketPulse platform meticulously intertwines a variety of fundamental data science methodologies along with advanced web scraping techniques,ultimatelyaimingtofurnish userswithanallencompassinganddeeplyinsightful stockmarketanalysis experience that is both engaging and informative. To achieve this ambitious goal, the platform strategically employs powerful libraries such as Pandas and NumPy, which are essential tools for the intricate manipulation and rigorous analysis of vital stock market indicators, including but not limited to stock prices, trading volume fluctuations, and significant historical trends over time. Through the application of sophisticated statistical methods, including moving averages, percentage changes,
International Research Journal of Engineering and Technology (IRJET) e-ISSN: 2395-0056
Volume: 12 Issue: 04 | Apr 2025 www.irjet.net p-ISSN: 2395-0072
and the intricate correlation between price and volume, MarketPulseadeptlyidentifiesandelucidatespatternsand valuable insights that are embedded within complex financial data, thus empowering users to make informed decisions.
Furthermore, in addition to these advanced analytical techniques,MarketPulseharnessesthecapabilitiesofweb scraping tools, notably BeautifulSoup and Requests, to meticulouslyaggregateandextractrelevantfinancialnews articlesfromreputablesourcessuchas Moneycontroland Economic Times, thereby ensuring a steady stream of upto-date information. This scraped content undergoes a rigorous filtering and processing procedure to maintain high relevance and quality, resulting in a meticulously curated news feed that is directly linked to the specific stocks of interest for each user, enhancing their engagement and understanding. For the purpose of effective data visualization, the platform incorporates a diverse array of libraries including Chart.js, React Charts, and Google Charts, which collectively facilitate the creationofinteractivestockcharts,dynamictrendgraphs, andcomparativeanalysistoolsthatarevisuallyappealing and informative. The integration of these multifaceted techniquesguaranteesthatusersreceivenotonlyaccurate andreal-timedatabutalsotheopportunitytoengagewith thisinformationinaninteractivemannerthatsignificantly promotes a deeper understanding of financial markets, ultimatelyleadingtomoreastuteinvestmentdecisions.By synthesizing data science with web scraping and visualization techniques, MarketPulse positions itself as a pivotal resource for investors seeking to navigate the complexities of the stock market landscape with greater confidence and clarity. Such a comprehensive approach not only enriches the user experience but also enhances the overall effectiveness of investment strategies in an ever-changingeconomicenvironment.
MarketPulsehasbeenmeticulouslydesignedwithahighly modular and inherently scalable framework, which is crucial for facilitating a performance that is not only robust but also aligned with the principles of user-centric design. The backend infrastructure is fundamentally poweredbytheDjangowebframework,complementedby theDjangoRESTFramework,whichplaysapivotalrolein managing API endpoints, overseeing user authentication processes, and orchestrating interactions with the databasethroughthecomprehensivecapabilitiesprovided bytheDjangoadmininterface.
The frontend component of the application has been adeptly developed utilizing React.js, which endows the user interface with a dynamic, responsive, and visually engaging experience that significantly enhances user interaction. For the visualization of financial data, advanced charting components are employed that
leverage the capabilities of Chart.js and D3.js, thus enabling the presentation of real-time financial information through customizable and visually appealing representations.
Real-timestockmarketdataisefficientlyretrievedviathe API, while the aggregation of financial news is adeptly conducted through web scraping techniques as well as externalAPIs,whichprovideacomprehensiveoverviewof relevant financial information. Furthermore, an advanced machine learning layer has been ingeniously constructed usingScikit-learn,whichfacilitatesthegenerationofstock price predictionsalongside sentimentanalysisscoresthat are subsequently displayed within the user-friendly dashboardinterface.
Among the plethora of additional features, the platform guarantees secure user authentication through the implementation of JWT (JSON Web Tokens) and OAuth2 protocols, while also ensuring precise timezone synchronization through the utilization of Python’s pytz library in conjunction with JavaScript’s Date() objects, thereby accommodating users from diverse geographical locations. Currently, the local deployment of the entire platform is operational on a localhost server, providing a controlledenvironmentfortestinganddevelopment.
Moreover, the architecture of the system incorporates Continuous Integration and Continuous Deployment (CI/CD) pipelines in conjunction with Docker technology, which collectively facilitate streamlined processes for automated deployment and rigorous integration of new features and fixes. The platform also supports a robust role-based access control mechanism, thereby ensuring that user permissions are meticulously managed according to predefined roles. Additionally, it includes sophisticated real-time logging and error handling functionalities that are indispensable for maintaining system stability and long-term maintainability of the application. Particular emphasis has been placed on enhancing the Market Mood Indicator and Index Trend modules to provide users with deep insights into market sentimentandstock-indexcorrelation.
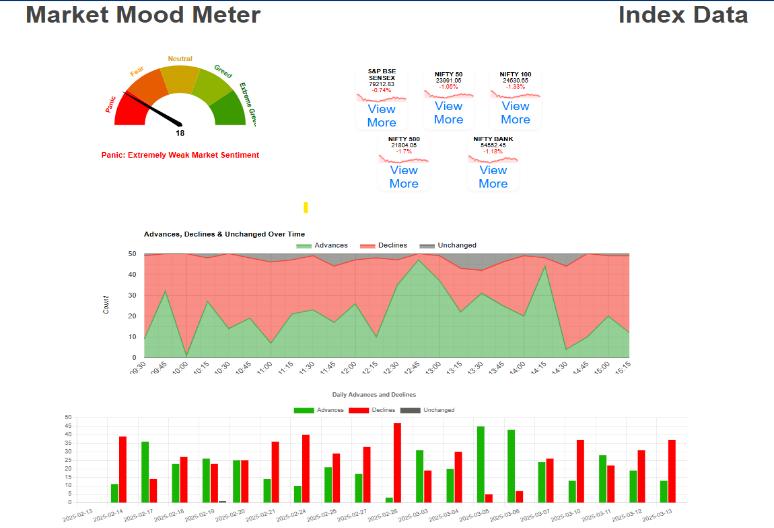
TheMarket Mood Meteris a unique and insightful feature designed to reflect the emotional sentiment and overall risk environment of the stock market on any given day. It evaluates the ratio of advancing to declining stocks and translates this data into five emotional states:Panic, Fear, Neutral,Greedy,andExtremeGreedy.Whenthenumberof declining stocks far exceeds the advancing ones, the market is considered to be in a state ofPanicorFear, indicating high uncertainty and potential selling pressure. A balanced ratio typically points to aNeutralsentiment, whereneitherbullishnorbearishforcesdominate.Onthe other hand, when advances significantly outnumber
International Research Journal of Engineering and Technology (IRJET) e-ISSN: 2395-0056
Volume: 12 Issue: 04 | Apr 2025 www.irjet.net p-ISSN: 2395-0072
declines, the mood shifts towardGreedyorExtreme Greedy, signaling heightened investor confidence and a strong buying trend. By encapsulating complex market behavior into easily understandable emotional cues, the Market Mood Meter empowers users to gauge market sentiment at a glance and make more informed, riskawaretradingdecisions.
4.3.2 Index Trend
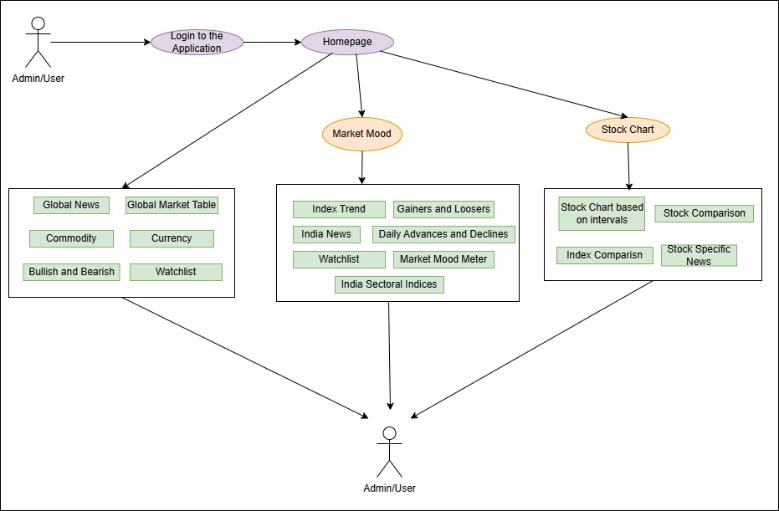
TheIndex Trendmodule is a powerful analytical tool that helps users understand how individual stocks are performing in relation to their benchmark indices. It evaluates whether a stock's movement is in alignment with or diverging from the overall trend of its correspondingindex.
This alignment provides key insights intosector strength,investor sentiment and potentialmomentumtrading opportunities. A stock movinginsyncwitharisingindexsuggestsstrongsectorwide momentum, while divergence may signal unique stock-specific factors or early signs of reversal. What makes this feature especially dynamic is that users cancustomizethecorrelationthresholdaccordingtotheir preference enablingthem toadjustthesensitivity ofthe trend analysis. This flexibility allows for personalized insights, letting users visualize how closely a stock tracks itsindexbasedonthedefinedcorrelation,andadapttheir trading strategies accordingly. Whether tracking consistencyorseekinganomalies,theIndexTrendmodule serves as a strategic edge for both trend-followers and tacticaltraders.
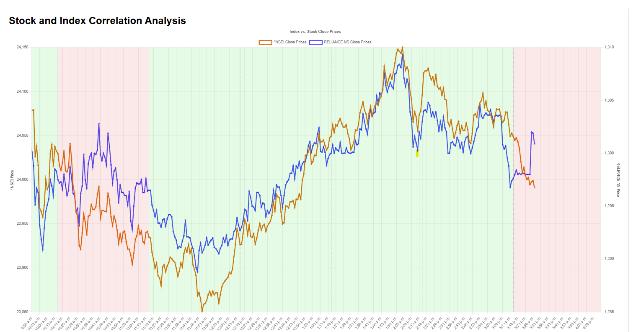
Figure 5:IndexTrend AnalysisdescribingNifty50index versusReliancestock
MarketPulse illustrates how combining data science, web technologies, and financial analytics can transform the interaction between investors and stock market data. By utilizing real-time data retrieval, machine learning algorithms, sentiment analysis, and interactive visualizations,theplatformprovidesathoroughanduserfriendlydecision-supportsystem.Itsmodulararchitecture allows for scalability and easy maintenance, while secure authenticationsafeguardsuserinformation.Withthehelp of advanced tools such as Django, React.js, Chart.js, and NLP libraries, MarketPulse delivers precise predictions, indicators of market sentiment, and informative visual displays to support financial decision-making. The platform effectively connects raw financial data with accessible insights and lays the groundwork for future developments like automated trading, tailored recommendations, and portfolio optimization. In summary, MarketPulse standsoutasapowerful,scalable, and intelligent solution for contemporary financial analysis.
[1]. Kirti, S. Chandra, R. C. Barik and B. Biswal, "Forecasting and VisualizingStockMarket Indices: A Machine Learning Dashboard," 2023 7th International Conferenceon Trends in Electronics and Informatics (ICOEI), Tirunelveli, India,2023,pp.1272-1279.
[2]. S. Pagar, A. Jaiswal, A. Auti, V. Purohit and V. Mishra, "Technical Analysis of StockMarket using DataScienceanditstools,"20237thInternational Conference On Computing, Communication, Control And Automation (ICCUBEA), Pune, India, 2023,pp.1-5.
International Research Journal of Engineering and Technology (IRJET) e-ISSN: 2395-0056
Volume: 12 Issue: 04 | Apr 2025 www.irjet.net p-ISSN: 2395-0072
[3]. J. Jagwani, M. Gupta, H. Sachdeva and A. Singhal, "Stock Price Forecasting Using Data from Yahoo Finance and Analysing Seasonal and Nonseasonal Trend," 2018Second International Conference on Intelligent Computing and Control Systems(ICICCS), Madurai, India, 2018, pp. 462467.
[4]. Fataliyev, Kamaladdin & Aneesh, Sreevallabh & Prasad, Mukesh &Liu, Wei. (2021). Stock Market Analysis with Text Data. 10.48550/arXiv.2106.12985.
[5]. Yadav, Sameer. (2017). STOCK MARKET VOLATILITY - A STUDYOF INDIAN STOCK MARKET. Global Journal for Research Analysis. 6. 629-632.
[6]. Gupta,Bharat&Bhardwaj,Shefali&Govinda,K.& Rajkumar, Rajasekaran. (2020). Stock Market Analysis using Data Visualization. International Journal of Recent Technology and Engineering. 8. 10.35940/ijrte.C4193.038620.
[7]. A. Leelavathi, G. Sri Jaya Sairam, G. Rishitha, V. Venkat, SH. Thahira, D. HarikaPoorna, “Visualization and Forecasting Stocks,” InternationalResearchJournalofEngineeringand Technology(IRJET),April2024.
[8]. Ambashtha, Dr-Kanahaiya & Singh, Manoranjan. (2020). Comparative Technical Analysis and PredictionofNifty-50Performance.9.
[9]. Covaci, Florina & Boscan, Dragoș. (2023). Financial Analysis Dashboard Applicationfor Stock Exchange Listed Companies. Journal of Computer Science and TechnologyStudies. 5. 1021.10.32996/jcsts.2023.5.4.2.
[10]. SnehPatil,YashBharatJadhav,NeelGude,Anish Shivram Gawde, MohammedNaif, Aditi Bombe, “DataScienceApproachtoStockMarketAnalysis,” InternationalResearchJournalofEngineeringand Technology(IRJET),August2023.