International Research Journal of Engineering and Technology (IRJET) e ISSN: 2395 0056

Volume: 09 Issue: 07 | July 2022 www.irjet.net p ISSN: 2395 0072

International Research Journal of Engineering and Technology (IRJET) e ISSN: 2395 0056
Volume: 09 Issue: 07 | July 2022 www.irjet.net p ISSN: 2395 0072
Jafer T P1, Dr. Jayasree N2
1PG Scholar Manufacturing Systems Management, GEC Thrissur, Kerala, India,680009
2Assosiate Professor Department of production engineering, GEC Thrissur, Kerala, India 680009 ***
Abstract -Demand forecast of product and service is an important input for both long range and short range planning for organizations In this study the focus is on forecasting of product hierarchies. The objective of present study is to find a suitable forecasting strategy when forecasts are required at several levels of product hierarchy and the individual product demand exhibit a seasonal pattern. Data employed for the study pertains to the sales data of car Industry. The study employs 6 year monthly data of total domestic sales company. Forecasting is essential for the 3 levels of hierarchy. Base level includes sales of Mini, Compact, Utility, and Vans. Middle level comprises sales of passenger car and passenger vehicles. Top level includes total domestic sale of company. The forecasting strategies deliberated in the project are; Top down, Bottom up and the optimal combination approach with Ordinary least square (OLS) for reconciliation. The performance of different strategies is compared using the Mean Absolute Percentage Error (MAPE). The Moving average, exponential smoothing techniques; single exponential smoothing, double exponential smoothing and triple exponential smoothing are used for forecasting individual series. The results show that the performance of bottom up approach and Optimal combination approach is more or less same for the data series studied.
Words: HierarchicalTimeSeries,HierarchicalProduct Forecasting,Exponentialsmoothing,OLSReconciliation
Forecasting is a critical business process for nearly every organizationandoftenitistheveryfirststeporganizations mustundertakewhendetermininglong termcapacityneeds, annual business plans, and shorter term operations and supplychain.Forecastingisalsoimportantforproduction planning.Productionmanagersneedfuturedemandforecast to plan and schedule a production and determine other related activities, like requirements planning and the applicationofforecastinginproductionandinventory,and proposed the “ideal” design of a forecasting system for productionandinventory control.Hierarchicalforecasting has different forms pertaining to temporal and contemporaneous aspects. Here, we exclusively focus on contemporaneous hierarchies, specifically on products aggregatedingroupsandcategories.Thisstudysummarizes the relevant theoretical background on hierarchical forecastingmethodsandtheapproachesofbottom up,top
down,Optimalcombinationapproachesforforecasting.We especially focus on the use of the hierarchical structure, product dependencies and heteroscedasticity in product demand, and critically evaluate approaches. Hierarchical product forecasting techniques should allow the product forecasts at each level to be summed giving the product forecastsatthelevelabove.
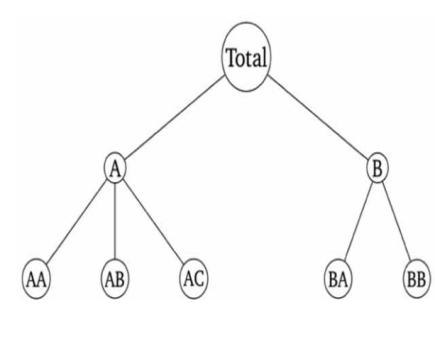
Bycommonmethodforproducthierarchicalforecasting,we first generate independent forecasts for each series at the bottomlevelofthehierarchy.Figureshowsasimpleproduct hierarchy.AtthetoplevelofthehierarchyistheTotal,the most aggregate level of the product. This Product is break into two categories, A and B, which are in turn break into threeandtwosubcategoriesrespectively Accuratedemand forecasts lead to efficient operations and high levels of customerservice,whileinaccurateforecastswillinevitably leadtoinefficient,high costoperationsand/orpoorlevelsof customer service. Risk and uncertainty are central to forecastingandprediction;itisgenerallyconsideredgood practice to indicate the degree of uncertainty attaching to forecasts.Inanycase,thedatamustbeuptodateinorder fortheforecasttobeasaccurateaspossible.Therecognition of the best forecasting techniques is very crucial in the forecasting field, since the forecasts are used to drive the budget, distribution, and production planning processes. This study mainly aims to find the effective forecasting techniques and approaches of Hierarchical product time seriesonthebasisofforecastsaccuracy.madebydifferent time series forecasting methods. So as to do this a large number of Hierarchical time series data is collected and forecasts are found out using various methods and strategies.Thenwefoundthebestandoptimumforecasting approachforthedataseries studied.Thedatausedinthis studyarerealmonthlysalesdataoforganization
International Research Journal of Engineering and Technology (IRJET) e ISSN: 2395 0056
Volume: 09 Issue: 07 | July 2022 www.irjet.net p ISSN: 2395 0072
Themainobjectivesofthestudyareasfollows:
• ToCreateasetofproductaggregationstrategiesto forecast the demand of product hierarchies correspondingtoaspecificclassofdata.
• Identify the different forecasting techniques throughliteraturesurvey.
• Identifying the main determinants of forecasting accuracythroughliteraturesurvey.
• Studythevarioustechniques&strategyusedforthe forecastingspecificclassofdata.
From the literature study, varying performance of the forecasting methods could be attributed to different statisticalfeaturesofthedata;alongforecastinghorizonora highdegreeofsubstitutabilitymakeHierarchicalForecasting is better than Direct Forecasting. It is desirable that researcherexaminesallavailableliteraturebothconceptual andempirical.Theconceptualliteratureisonewhichdeals withconceptsandtheories.Empiricalliteratureisthatwhich containsstudiesmadeearlierandsoitconsistsofmanyfacts and figures observed in the earlier study. A study of this literatureenablingtheresearchertoknowaboutthedataand materials available for operational purpose. Review of literature shows the previous studies carried out by the researcher in this field. In the literature review, they are usingsimulateddataorempiricaldata.Ineveryorganization supply Chain process, managers have special interest in acquiringinformationaboutfuturedemand,disaggregated accordingtotheinformationtheyneedinordertoplanthe business processes. This is the point where hierarchical forecasting (HF) is needed [1]. Hierarchical time series represent multiple time series that are hierarchically organizedandcanbeaggregatedatseveraldifferentlevelsin groups based on products and TD strategy consistently outperformstheBUstrategyforforecastingproductfamily [2]. The main criterion for selecting among different methodologies in hierarchical forecasting is the forecast accuracy. As a forecasting technique they mainly use Exponential Smoothing in product hierarchical forecasting and Study found that characteristics of demand can be significantinselectingappropriateforecastingstrategies[3]. The reviewed paper shows that Bottom up approach with HybridARIMA RBFNNmodellingcanbeusedforlong term predictions.Asfortheshortandmedium termpredictions,it canbeusedabottom upapproachRBFNNmodelling.Overall bottom up approach with RBFNN modelling give the best result [4]. Combined forecast is not always the best forecasting method but the combined forecast is the most effectivewaytotherelievetheforecastingrisk[5]Integrated approachtoforecastinghierarchicalseriesdemonstratesthat forecast accuracy and inventory performance can be substantially improved with respect to other [6]. The top
downmethodperformsbetterwhendatahavehighpositive correlation compared to high negative correlation and combinationofforecastingmethodsmaybethebestsolution whenthereisnoevidenceofthecorrelationship[7].Optimal reconciliation models showed the best mean performance [8]. Forecasting literature show mixed results as to a preference for either top down or bottom up forecasting. Thisisnotsurprisingastheperformanceoftheapproaches dependsontheunderlyingdemandprocessofproducts[9]. Duetotheadditivenatureofthehierarchy,inwhichsumsof productsalesdeterminegroupsales,which,inturn,addupto determinecategorysales,theunderlyingdemandprocessis transformed at various levels of the hierarchy [10]. Aggregationcanleadtosubstantialinformationloss,which makesbottom upforecastingseemfavorable[14].However, ifnoimportantinformationislost,benefitscanbegainedif randomnoisecancelsout,whichmakestop downforecasting seemmorefavorable[11].Awidevarietyofperformanceis seen as the nature and extent of differences between top down and bottom up are dependent upon contextand the assumeddemandprocesses[12].Dependenciesbetweenthe demandfordifferentproductsareakeycharacteristicofthe demandprocess,andhenceamaindriverofdifferencesin performancebetweentop downandbottom upapproaches [13].
We can see that recent approach consists of forecasting all series at all levels of the hierarchy independently,followedbyaregressionmodeltooptimally combineandreconciletheseforecasts.Fromrecentpublished paper we found that introducing a different approach in Product hierarchical forecasting, labelled the Optimal combination approach with reconciliation, which uses the hierarchical structure to create revised forecasts. This forecasting approach follows two steps: generate independentforecastsforeachseriesinthehierarchy,weight these forecasts according to the hierarchical structure to determinethefinalforecasts.Thesefinalforecastsadhereto thehierarchicalstructureinthesensethataggregatesofthe forecastsatthebottomlevelexactlymatchforecastsathigher levels in the hierarchy. We concluded from the Literature reviewthattopdownandbottom upapproacharecommon in hierarchical forecasting so we are introducing new approachinproducthierarchicalforecastingisReconciliation technique
Hierarchical time series forecasting is the process of generatingcoherentforecastsallowingindividualtimeseries tobeforecastindividually,butpreservingtherelationships withinthehierarchy.Inthisstudythefocusisonthedemand forecastingofhierarchiesformedbyaggregationofproducts. way of how the base forecasts is combined in order to produce revised forecasts. By base forecasts, we consider independent forecasts that are generated by some of the forecasting methods (for example: exponential smoothing, MovingAverage)
Factor value: 7.529 | ISO 9001:2008 Certified Journal |
International Research Journal of Engineering and Technology (IRJET) e ISSN: 2395 0056
Themethodologyforthestudyisasfollows:

• Conduct literature review on existing forecasting techniques, strategies and reconciliation methodologiesinthecontextofproducthierarchy leading to, Identification of research gap and Problemdefinition
• Data Collection and Data analysis using different software’s.
• Forecasting each of the series using different techniques like Moving average, single, Double, TripleExponentialsmoothening.
• ForecastingofproducthierarchyusingTopDown, Bottom Up&OptimalCombinationapproach
• IdentificationofOptimumstrategy&reconciliation methodfortheseriesdata
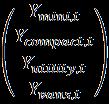
Over6yearsofmonthlysalesdataofdifferentproductdata werecollected.Collecteddataincludedomesticsalesofthe company.Datawereanalyzedandstudythecharacteristicsof dataoffourdifferentproducts(Mini,Compact,Utility,Vans) whichincludedinbaselevelofhierarchy,Productsgroups (Passenger cars and Passenger vehicle) which included in MiddlelevelandtotaldomesticsalesinToplevel.Collected datadividedintotrainingandtestsets.Three yearmonthly salesdatasetasatrainingdatausedforsettingandfinding parametersforthespecificdata.One yearmonthlydataset asatestdata,whichisusedforcomparisonandtesting.Data were analyzed and found the components included in the data like trends, seasonal, irregularity, cyclical. Regression equation and trendline of the data were determined. we applythedifferentforecastingapproachtorealworldsales datacompany.Wethenintroducethecompanyandexplain our study in which we compare the performance of the differentapproachesandtechniquesinproductHierarchical forecastingforthecompanydata.
passenger vehicles. Top Level of the hierarchies is total domesticsaleofthecompany.Weplotcharts,ACF,PACFfor each node in product hierarchy using MS Excel, SPSS Software and go for detailed analysis of data of different products, product groups and product categories. After plotting the graph, we understand the trend and characteristicsofeachseriesoftheproductHierarchy
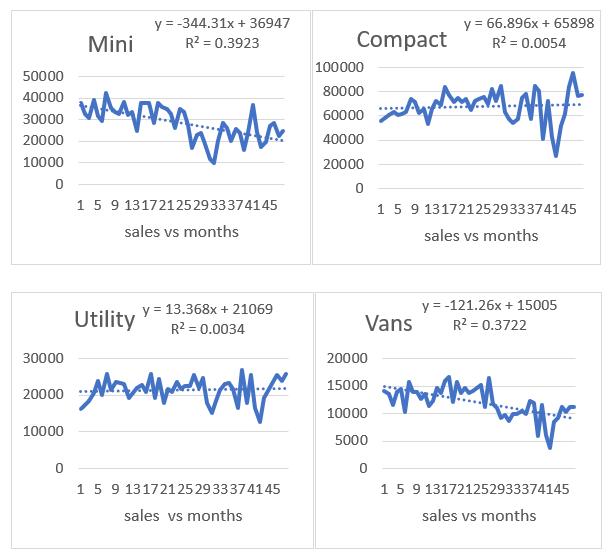
Chart 1:salesofbaselevelproducts
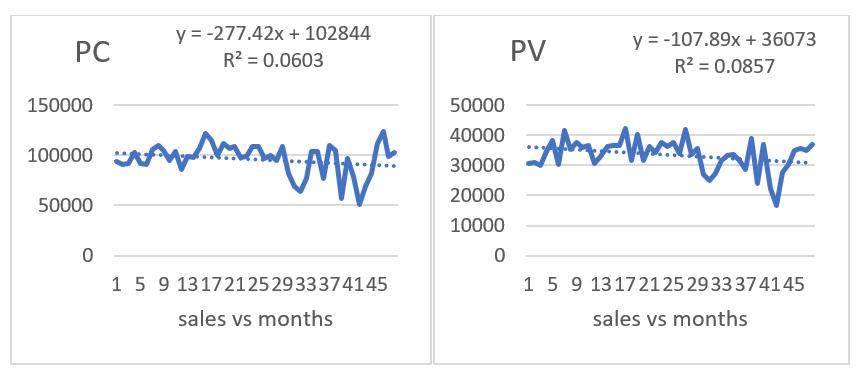
Chart 2:salesofmiddlelevelproducts
ForbetterunderstandingofthebasicprinciplesofHF,the diagramofthehierarchicalstructureisprovidedinFigure above.ThediagramconsidersahierarchywithK=2levels andn=7seriesintotal.Thisstudyproducthierarchyisas follows, Base levels are Mini, Compact, Utility, Van. In the middlelevelhavetwoproductgroupsarePassengercar&
Volume: 09 Issue: 07 | July 2022 www.irjet.net p ISSN: 2395 0072 2022, IRJET | Impact Factor value: 7.529 | ISO 9001:2008
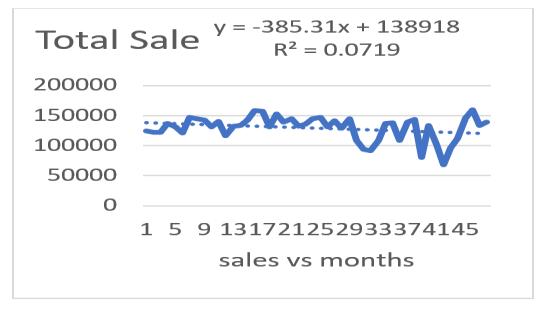
Chart 3:salesofToplevel
International Research Journal of Engineering and Technology (IRJET) e ISSN: 2395 0056
Volume: 09 Issue: 07 | July 2022 www.irjet.net p ISSN: 2395 0072
Moving average, Single exponential smoothing, double exponential smoothing, and triple exponential smoothing techniques are used for forecasting. The forecasts of individual nodes in each level were forecasted using the threemethods.Theindividualforecaststhenreconciledto generate more accurate forecast. Moving average, Single, double,andtripleexponentialsmoothingaredoneusingthe forecast equations. α, ß, and Γ values are set for choosing bestforecast.
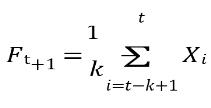
(i) Moving average: Movingaverageisoneofthesimplest forecastingtechniqueswhichforecaststhefuturevalueofa timeseriesdatausingaverage(orweightedaverage)ofthe past ‘N’ observations. Mathematically, a simple moving averageiscalculatedusingtheformula.Thepointforecasts are calculated as an unweighted average of the last k observations,asfollows:
techniquessuchasmovingaverage,exponentialsmoothing, and double exponential smoothing are no longer appropriate. In most cases, the fitted error values (actual demandminusforecast)associatedwithsimpleexponential smoothingandHolt’smethodwillindicatesystematicerror patterns that reflect the existence of seasonality. For example,presenceofseasonalitymayresultinallpositive errors, except for negative values that occur at fixed intervals. Such pattern in error would imply existence of seasonality. Such time series data require the use of a seasonal method to eliminate the systematic patterns in error.
Tripleexponentialsmoothingisusedwhenthedatahas trendaswellasseasonality.Thefollowingthreeequations whichaccountforlevel,trend,andseasonalityareusedfor forecasting;
Levelequation:Lt =α(Yt/St c)+(1 α)[Lt 1 +Tt 1]
Trendequation:Tt =ß(Lt Lt 1)+(1 ß)Tt 1
Seasonalequation:St =Γ(Yt/Lt)+(1 Γ)St c
(ii)Single exponential smoothing: Single exponential smoothingassumesafairlysteadytime seriesdatawithno significanttrend,seasonalorcyclicalcomponent.Here,the weightsassignedtopastdatadeclineexponentiallywiththe mostrecentobservationsassignedhigherweights.Insingle ES,theforecastattime(t+1)isgivenby(Winters,1960)
Ft+1 =αYt +(1 α)Ft
Parameterαiscalledthesmoothingconstantanditsvalue liesbetween0and1.
(iii) Double exponential smoothing: Holt’s method of double exponential smoothingisusedinthisstudy due to drawbacksofsingleexponentialsmoothingisthatthemodel does not do well in the presence of trend. This can be improved by introducing an additional equation for capturing the trend in the time series data. Double exponential smoothing uses two equations to forecast the futurevaluesofthetimeseries,oneforforecastingthelevel (short term average value) and another for capturing the trend.
Level(orIntercept)equationis (Lt):Lt =αYt +(1 α)Ft
Thetrendequationis(Tt):Tt =ß(Lt Lt 1)+(1 ß)Tt 1
αandßarethesmoothingconstantsforlevelandtrend, respectively,and0<α<1and0<ß<1.
(iv) Triple exponential smoothing: In this study, Holt Wintermodeloftripleexponentialsmoothingareusedfor calculations. Single and double exponential smoothing techniquesdiscussedsofarcanhandledataaslongasthe datadonothaveanyseasonalcomponentassociatedwithit. However,whenthereisseasonalityinthetime seriesdata,
The forecast Ft+1 using triple exponential smoothing is givenby:
Ft+1 =[Lt +Tt]*St c
Where c is the number of seasons (if it is monthly seasonality,thenc=12;incaseofquarterlyseasonalityc= 4;andincaseofdailydatac=7).
3.2 Forecasting approaches for hierarchical time series.
ThisstudymainlyfocusedonBottom up,Top downand Optimalcombinationapproaches.
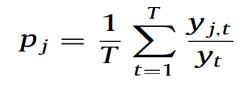
(i) Top Down: Thetop downapproachaimstoperforma forecast for the top level of the hierarchy (ŷh), and then disaggregateittothedifferentnodesbyusingapredefined proportion. The most common approach is the use of the average for each node, j, relative to its “parent” node as a proportion.Forthetop downapproach,thetop levelrevised forecastsareequaltothetop levelbaseforecasts
Theequationforselectingtheproportion(pj)isgivenby;
ForthehierarchyshowninFig.2,thepredictionsfor thedifferentnodesbasedonŷh aregivenby:ŶPC,h =ppc· ŷsaleh
ŶPVh =ppv·ŷsale,h
Ŷmini,h =pmini ·ŷPC,h
2022, IRJET | Impact Factor value: 7.529 | ISO 9001:2008 Certified
International Research Journal of Engineering and Technology (IRJET) e ISSN: 2395 0056
Volume: 09 Issue: 07 | July 2022 www.irjet.net p ISSN: 2395 0072
Ŷcompact,h =pcompact ·ŷPC,h
Ŷutility,h =putility ·ŷPV,h
Ŷvans,h =pvans ·ŷPV,h
(ii) Bottom Up: Bottom up(BU)approachfirstgenerates the base forecasts in the bottom level of the forecasting structure,usinga forecastingmodel.All otherforecastsin thestructurearegeneratedthroughaggregatingofthebase forecasttothehigherlevels,inamannerwhichisconsistent with the observed data structure. This approach is generating the initial base forecasts at the lowest disaggregatedlevelofthehierarchy(bottomlevel).sothere isn'tanylossofinformationfromthedata,whichmayoccur whendealingwiththedata frommoreaggregatelevels of the hierarchy, as in the case of top down methodology In thisstudy,thecalculationsusedforbottom upapproaches are;
ŶPC,h =ŷmini,h +ŷcom,h

ŶPV,h =ŷutility,h +ŷvans,h
Ŷsale,h =ŷPC,h +ŷPV,h
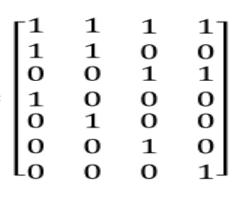
(iii) Optimal combination approach: Theapproachfirstly considersgeneratingtheindependentbaseforecastsforall nodesinthehierarchy.Theproblemwithindependentbase forecasts is that they will not provide “aggregate consistency”, since they will not sum up according to the hierarchy.Thisapproachsolvestheseissuesbycombining thebaseforecaststoproduceasetofrevisedforecaststhat areascloseaspossibletotheindependentforecasts,butalso meettherequirementthatforecastsatupperlevelsinthe hierarchyarethesumoftheassociatedlower levelforecasts.
Forthisstudy,thematrixrepresentationis;
=
Thehierarchicalforecastingwithreconciliationcanthen bewrittenas,
ForsomeappropriatelychosenmatrixP.Thatis,existing methodsinvolvelinearcombinationsofthebaseforecasts. Theselinearcombinationsare“reconciled”inthesensethat lower levelforecastssumtogivehigherlevelforecasts.The effectofthePmatrixistoextractandcombinetherelevant elementsofthebaseforecasts,whicharethensummedbyS togivethefinalrevisedhierarchicalforecasts
These equations are programmed in python. The hierarchical forecasts of each level are reconciled using python software. The reconciled forecasts then used for comparisontofindoptimumstrategy.
Meanabsolutepercentageerror(MAPE)istheaverageof absolutepercentageerror.Assumethatthevalidationdata has n observations and the forecasting is carried out on thesenobservations.Themeanabsolutepercentageerroris givenby;
Reconciliation is the process of making the forecasts coherent. In this study, the reconciliation on hierarchical forecastisdoneusingOLS(Ordinaryleastsquare)method. Reconciliation to hierarchical forecasting gives optimal combinationapproach.TheOLSreconciliationtechniqueis introducedbyusingprogramminglanguageofpython.
Theconvenientgeneralmatrixrepresentationis;
Yt =Sbt
where S is a “summing matrix” of order m × n which aggregates the bottom level series to the series at aggregationlevelsabove.Herethesummingmatrixininthe orderof7x4.Thereconciliationisconductedbyintroducing amappingmatrix(P)intotheequation.
MAPE= *100
The equation is used for measuring the accuracy of the forecast.TheforecastwithminimumMAPEvalueistakenas bestforecastingmethod.TheMAPEvalueofeachlevelare used for comparing the forecasting techniques and to developasetofaggregationstrategy.
Thefinalresultsarebasedonaccuracyofforecastmethos and approaches that we performed during the study. Corresponding MAPE values for each node in the product hierarchyforthedatasetwerecalculated.Techniquesand approacheswithminimumMAPEvalueistakenasoptimum method and approach for the product hierarchical forecasting.Thecomparisonofeachforecastingtechniques and strategy using MAPE value in the context of product hierarchyisdiscussedinTablesbelow.
International Research Journal of Engineering and Technology (IRJET)
e ISSN: 2395 0056
Volume: 09 Issue: 07 | July 2022 www.irjet.net p ISSN: 2395 0072
Table 1: MAPE(*100)ValuesofBaseLevelForecast
Base Level Forecast
Mini Compact Utility Vans
Triple 0.05091 0.02792 0.02129 0.0346 Double 0.211183 0.163791 0.136537 0.1778 single 0.203318 0.18573 0.171613 0.17378 Moving 0.183553 0.167484 0.136982 0.164223
Forbaselevel,differentproductsareMini,Compact,Utility, VanshavingdifferentMAPEvaluesfordifferentmethodsbut comparing with techniques like Moving Average Single, Double, Triple exponential smoothing, result shows that tripleexponentialsmootheningisthemosteffectiveandbest suited method for all series in base level of hierarchy, becauseithaslesserroraccuracymeasureMAPE
Table 2: MAPE(*100)ValuesofmiddleLevelForecast
Middle Level Forecast (*100) PC PV
Triple MAPE 0.03144 0.01884
Double MAPE 0.13374 0.13702 single MAPE 0.1304 0.13423 Moving MAPE 0.1386 0.138
Fromthetableabovewefoundthaterroraccuracymeasure valueoftripleexponentialforecastingtechniqueislessfor differentmiddlelevelproductsgroups.Bycomparingeach seriesinthelevel,PassengerCarhavingMAPEvalue0.03144 and Passenger Vehicle have MAPE value 0.01884. Least efficient method for the middle level of the product hierarchyisMovingAveragemethodofForecasting.Single andDoubleexponentialhavesimilarerroraccuracy.
Table 3: MAPE(*100)ValuesofTop LevelForecast.
Top Level Forecast (*100) Total Sale
Triple MAPE 0.02487 Double MAPE 0.12539
Single MAPE 0.12405 Moving MAPE 0.13019
TheToplevelofproducthierarchyistotaldomesticsaleof the company. By studying the table, we got that Triple exponentialSmootheningismuchbetterforforecastingwith higher accuracy comparing to other methods The MAPE value of total domestic sale is 0. 024870.Least accuracy methodforthetop levelforecastisMovingAverage.Single and double having comparatively similar MAPE values so bothhavesameeffectonforecasting
Best Forecasting approaches or strategy for the different level in the hierarchy is discussed below and found the optimumforecastingapproachfordifferentlevels
Table 4: MAPE(*100)valuesofdifferentapproachesin Baselevel.[TD TopDown,BU BottomUp]
Base Level
Mini Compact Utility Vans
TD 0.245763 0.126917 0.122264 0.275491 BU 0.04719 0.02792 0.02129 0.03467 Optimal 0.04272 0.02923 0.024098 0.035907
Table 5: MAPE(*100)valuesofdifferentapproachesin middlelevel[TD TopDown,BU BottomUp]
Middle Level
PC PV
TD 0.039622 0.078583 BU 0.033732 0.01748 Optimal 0.03207 0.019846
Table 6: MAPE(*100)valuesofdifferentapproachesin Toplevel[Optimal Optimalcombinationapproach]
Top Level
Total Sale
TD 0.024872 BU 0.026417 Optimal 0.025018
From this plotted tables we can understand that different approachesfor baselevel of theproduct hierarchyhaving differentaccuracyanderror.WetabulatedtheMAPEvalues for TD, BU and Optimal approach for products (Mini, Compact, Utility, Vans) specifically. From the result best strategy for base level of product hierarchy is Bottom Up approachratherthanTopdownandOptimalcombination For a Middle level in product hierarchy, we can see that OptimalCombinationapproachandBottom Upapproachis effective method for different products groups like Passengercar,passengervehiclethanTopdown.Thelowest MAPE values for passenger car and passenger vehicle is 0.032069&0.017477respectively.Fortoplevelinproduct hierarchy, Total domestic sales having different data characteristics but comparing with different approaches, resultshowsthatTop Downismosteffectivemethodfortop level in product hierarchy. Bottom Up and Optimal Combination approaches also have similar error accuracy measurescomparetoTop Down.Thestudyhelpstodevelop asetofaggregationstrategytoforecasttheTotaldomestic sale of a organization for the period of 12 months in hierarchiesbasedonProductaggregationcorrespondingtoa specificclassofproductsalesdataoftheorganization.Total Domestic sale, Product group of passenger Car and PassengervehiclesandProductslike(Mini,Compact,Utility, Vans)forecastsarecalculatedusingthedevelopedmodelfor thetestperiodanditisvalidatedusingactualdata.
2022, IRJET | Impact Factor value: 7.529 | ISO 9001:2008 Certified Journal
International Research Journal of Engineering and Technology (IRJET) e ISSN: 2395 0056
Volume: 09 Issue: 07 | July 2022 www.irjet.net p ISSN: 2395 0072
The main objective of the study was to develop a set of aggregationstrategytoforecastthedomesticproductsaleof aorganizationinhierarchiesbasedonProductaggregation corresponding to a specific class of collected data. In this study, the best forecasting methods are identified in each node of each level and the best forecasting strategy are identified in each level. That is, the optimum forecast techniquesandstrategyforIndividualproductslike(Mini, Compact,Utility,Vans)oftestdata setare developed.The approaches used are Bottom up, Top down and Optimal combinationwithReconciliation.Theforecastingtechniques used are Moving average, single exponential smoothing, double exponential smoothing, and triple exponential smoothing. MAPE (error measure) is used for finding the best forecasting approach and best forecasting technique. From the study, results show that the best forecasting methodforBaselevel,MiddlelevelandToplevelisTriple exponentialsmoothingcomparetomovingaverage,single anddouble exponential methodsforthedata seriesinthe study. The forecasting approaches for each level are also identified. Performance of Optimal combination approach andbottomapproachoutperformstheTop Downapproach onaverageandacrossalllevelproducthierarchy.Theresult also shows that performance of bottom up approach and Optimalcombinationapproachismoreorlesssameforthe data series studied. This study was not focused on the, ARMA,ARIMAforecastingtechniquesandalsoapproaches like modifiedtopdown,middle outapproaches.Similarly, therearedifferentreconciliationtechniqueslikeOLS,WLS, Minimum Trace, etc. For this study, the OLS method of reconciliationisused.Itcanalsobealimitationofthestudy. Theseallwherethelimitationsofthestudy.Thefuturework of the study relies on different areas like forecasting for intermittent demand data, forecasting for seasonal data usingSARIMAmodels Past2yearsCovidpandemicmakes worst condition in automobile industry in India. So, our Hierarchical product forecasting will be effective in 3 differenttimeperiods.Thatis,pre covidperiod(upto2019), Pandemic period (2020 & 2021), and a post covid period (Present year). For future works, suggestions include the timeperiodofcollecteddataisveryimportantandamount ofdataforforecastingisveryCrucialforefficientandbetter forecasting.
[1] DejanMircetic,BahmanRostami Tabar,Svetlana Nikolicic&MarinkoMaslaric(2021),Forecasting hierarchical time series in supply chains: an empiricalinvestigation InternationalJournalof ProductionResearch.
[2] PetropoulosF.,MakridakisS.,AssimakopoulosV. (2014) “Horses for Courses‟ in Demand Forecasting”, European Journal of Operational Research,Vol.237,No.1,pp.152 163
[3] TiagoSilveiraGontijo1,*andMarceloAzevedo Costa(2020), Forecasting Hierarchical Time SeriesinPowerGeneration,EuropeanJournalof OperationalResearch
[4] Mauro Costantinia,∗ , Carmine Pappalardob (2010), A hierarchical procedure for the combinationofforecasts,InternationalJournalof Forecasting26(2010)725 743
[5] SeongminMoona,n,ChristianHicksb,Andrew Simpson (2012),The development of a hierarchical forecasting method for predicting sparepartsdemandintheSouthKoreanNavy Acasestudy,Int.J.ProductionEconomics
[6] Adya,M.,Armstrong,J.S.,Collopy,F.,&Kennedy, M. (2000). An application of rule based forecasting to a situation lacking domain knowledge.InternationalJournalofForecasting, 16,477 484.
[7] Assimakopoulos,V.,&Nikolopoulos,K.(2000). Thethetamodel:Adecompositionapproachto forecasting.InternationalJournalofForecasting, 16,521 530.
[8] Rob J Hyndman, Roman A Ahmed & George Athanasopoulos (2010), Optimal combination forecastsforhierarchicaltimeseries
[9] AlyshaM.DeLiveraandRobJ.Hyndman,(2012), ForecastingTimeSeriesWithComplexSeasonal PatternsUsingExponential Smoothing,Journal oftheAmericanStatisticalAssociation
[10] Nikolaos Kourentzes, & Fotios Petropoulos (2016),Forecastingwithmultivariatetemporal aggregation:Thecaseofpromotionalmodelling, Int.J.ProductionEconomics
[11] George Athanasopoulos, Rob J. Hyndman, Nikolaos Kourentzes, & Fotios Petropoulos (2017), Forecasting with Product Hierarchies, JournalofEconomicSurveys
[12] M. Zied Babai, Mohammad Ali (2019), The impactoftemporalaggregationonsupplychains, EuropeanJournalofOperationalResearch
[13] DazhiYang(2020),Reconcilingsolarforecasts: Probabilistic forecast reconciliation in a nonparametricframework,SolarEnergy.
[14] Andrea Silvestrini & David Veredas (2008), Temporal aggregation of univariate and multi variatetimeseriesmodels:Asurvey,Journalof EconomicSurveys