International Research Journal of Engineering and Technology (IRJET) e ISSN: 2395 0056

Volume: 09 Issue: 07 | July 2022 www.irjet.net p ISSN: 2395 0072

International Research Journal of Engineering and Technology (IRJET) e ISSN: 2395 0056
Volume: 09 Issue: 07 | July 2022 www.irjet.net p ISSN: 2395 0072
1 A. V Muley, 2S. M Pore, 3M. S Malandkar, 4P. D Ganvir, 5A. A Khobragade,
2Professor, Department of Civil Engineering, Dr. Babasaheb Ambedkar Technological University, Lonere, India 3Asst. Professor, Department of Civil Engineering, Dr. Babasaheb Ambedkar Technological University, Lonere, India 145UG Students, Department of Civil Engineering, Dr. Babasaheb Ambedkar Technological University, Lonere, India ***
Abstract : Groundwater isa resource of water that occurs below the surface of the earth. Groundwater ismostly found underground in between cracks and spaces in soil, rocks, and sand. Groundwater is a source of recharge for lakes and rivers.Groundwaterisusedasthemainsourceofwatersupplyintowns,cities,andruralareassurfacewaterschemesare moreexpensivebecauseofprojectconstructioncosts.Raigaddistrictfacesextremescarcityofwaterinthesummerseason due to improper management of rainwater. Therefore, it is leading to puncturing of the rivers, canals, and lakes by unnecessary construction of well or digging borewell, which eventually will dry out. The Comparative Study of Groundwater potential zones inDr. BATU Campus itwould be done because the campus faces water scarcity, as well as therearemanyupcomingconstructionsinthecampus.Thestudydemonstratesthepotentialofgeographicalinformation systemsandstatistical basedapproachestoidentifythehydrologicalprocessesanddemarcatethegroundwaterprospect zones nearacampus building.Thearea issituated inHeavyRainfall, Humidtropicalclimate, and influenced by the Canal followinginsomepartsofcampus.Variousthematicmapssuchasdrainage,geomorphology,geology,slope,soil,lineament, andlineamentdensitywill beused. Thearea ofthecampus is971.7km2 andthe coordinatesofthe area are E18°10'15", N73°20'22".PotentialgroundwaterzoneswillbedetectedbyusingQGIS,GoogleEarth, and using Earth Resistivity meter. The mainobjective of this study isto findout the potential groundwater zones and also the slope of groundwater inthe campussoaccordinglywellsorborewellcanbedug soatappropriatepoints.ToevaluatePhysic chemicalcharacteristics ofgroundwater,tostudythespatialandtemporalvariationofgroundwaterquality,todevelopaqualitymodelusingsuitable predictionmodelling.
Index Terms – Geographical information systems (GIS)
Thespatialvariabilityofphysicalpropertiesthatsignificantlyinfluencethefateofwaterandsoluteinsoilsneedsalarge numberofmeasurementstobequantified.Surfaceelectricalresistivitytechniquescouldbeusedasasimpleandpractical method to determine this spatial variability. Electrical sounding and profiling measurements were taken on a small agriculturalfield(30by60m)undertwodifferentsoilconditions(dryandwetconditions).Thesoilprofileiscomposedof threelayers:ahighlypermeablesandyloam(alluvialterrace)overlyingagravellysandytillthatcoversafriablesandyto siltyshale.Thesoilphysicalproperties(grainsizedistribution,porosity,hydraulicconductivity,bulkdensity,andorganic mattercontent)oftheuppermostlayerweremeasuredinthelaboratoryonundisturbedsoilcorestakenatthreedifferent depthsona6by15mgridinthefield.
Geographic Information System (GIS) can be defined as a system for entering, storing, manipulating, analysing, and displayinggeographicorspatialdata.ThedevelopmentofGeographicInformationSystemsGISishighlyinfluencedbythe evolutionofinformationtechnology;theparadigmofGISisshifting.TraditionalGISsystemsprovidecapabilitiestohandle geo referenced data, including data input, storage, retrieval, management, manipulation, analysis, and output. However, with closed and centralized legacy architecture, current GIS systems cannot fully accommodate distributed, diverse network environments due to their lack of interoperability, modularity, and flexibility. With advances in computer networkingtechnologies,adistributedgeographicinformationservicesparadigmbecomesareachablegoal.
Remote sensing is the process of detecting and monitoring the physical characteristics of an area by measuring its reflectedandemittedradiationatadistance(typicallyfromsatelliteoraircraft).Special camerascollectremotelysensed images,whichhelpresearchers"sense"thingsabouttheEarth.Someexamplesare:
International Research Journal of Engineering and Technology (IRJET) e ISSN: 2395 0056
Volume: 09 Issue: 07 | July 2022 www.irjet.net p ISSN: 2395 0072
Cameras on satellites and airplanes take images of large areas on the Earth's surface, allowing us to see much morethanwecanseewhenstandingontheground.
Sonarsystemsonshipscanbeusedtocreateimagesoftheoceanfloorwithoutneedingtotraveltothebottomof theocean.
Camerasonsatellitescanbeusedtomakeimagesoftemperaturechangesintheocean
Tocheckiftheareaissuitableforfutureconstructionofbuildinginthecampusornot.Also,tocheckifthewaterleveland typeofrockpresentatthedecidedpointswhichwillbenefitthefutureconstruction.Also,toknowtheground waterlevel becausetheareafacesaseverewaterscarcityinthesummerseason.
The base map of DBATU campus was prepared according to the Survey of India (SOI) toposheets (1:50,000 scale). To assess groundwater potential zones, multi parametric data set, namely, geomorphology, watershed, contour map, slope, vector,LU/LC,drainagedensity,werepreparedusingtopographicmaps,existingmap,datacollectedfromthefieldstudy, and satellite image using integrated techniques such asRS and GIS .The satellite data, Sentinel 2 imagery, were accessed fromEarthtoexplorethesite(http://www.usgs.gov/).TheLU/LC,drainagemapwerepreparedbasedontheSentinel 2 (spatialresolution10meter)falsecolourcomposite(FCC)imagesinQGISsoftwareusingvisualinterpretationtechniques withfieldcheck.
Geomorphologyisthestudyoflandforms,theirprocesses,formandsedimentsatthesurfaceoftheEarth(andsometimes onotherplanets).Studyincludeslookingatlandscapestoworkouthowtheearthsurfaceprocesses,suchasair,waterand ice,canmouldthelandscape
3.1.3
Land Use/Land Cover (LU/LC) is a broad term that describes the categorization or classification of human activities and naturalfeaturesonthelandscapeacrosstimeusingestablished scientificandstatisticalmethodsofanalysisofacceptable sourcematerials
Thelengthofthestreamto a unitarea oftheregionisdefinedasthedrainagedensity.Itisasuitabletoolforanalysis of thelandformintermsofgroundwaterpotential.
3.1.5
The slope is an important criterion that helps to delineate the groundwater potential zone. It directly affects infiltration and surface runoff. Low/nearly level slope has high infiltration and low runoff, resulting in good groundwater recharge, whilemoderatetosteepslopeenhancessurfacerunoff.AslopemapwaspreparedfromtheSRTMelevationdatawiththe helpofArcGISsoftwaretheslopemapiscategorizedintothreeclasses,nearlysloping(0 1%),verygentlysloping(1 3%), andgentlysloping(3 5%)
3.1.6
TheVectorMap(VMAP),alsocalledVectorSmartMap,isavector basedcollectionofgeographicinformationsystem(GIS) data aboutEarthat various levels of detail. Level zero (low resolution) coverage is global and entirely in thepublic domain.Level1(globalcoverageatmediumresolution)isonlypartlyinthepublicdomain.
International Research Journal of Engineering and Technology (IRJET) e ISSN: 2395 0056
Volume: 09 Issue: 07 | July 2022 www.irjet.net p ISSN: 2395 0072
1. Earth Electric Resistivity Meter A resistivity meter is an electronic device used to measure the flow ofelectric currentthroughthegroundfromelectrodesinsertedatregularintervalsbyusingSchlumbergerMethod

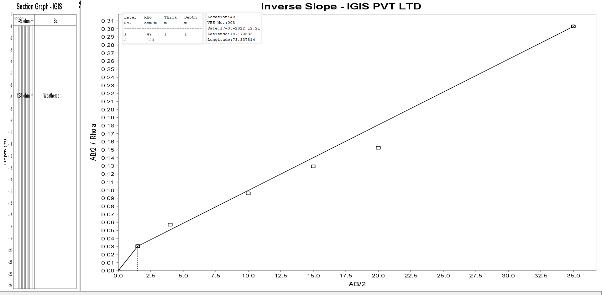

2.Software IGISVESisuseformakinggraphs
Point No. 1
Location: Latitude E18017’08”andLongitude N73033’78’’
Soilfounduptothedepthof0to1m,weatheredrockfounduptothedepthof1to23m.Weatheredrockhavelow resistivity,sotherewillbepresenceofgroundwaterwithinthelevelofweatheredrock.
Point no. 2
Location: Latitude E18017’06’’, Longitude N73033’36”
Soilfounduptothedepthof0to4mandweatheredrockfounduptothedepthof 4to7m,fracturedrockfounduptothe depthof 7to26m.Weatheredrockandfracturedrockhavelowresistivitysotherewillbepresenceofgroundwater withinthelevelofweatheredrockandfracturedrock.
Point no. 3
Location: LatitudeE18016’88’’andatLongitude N73033’66’’
Weatheredrockfounduptothedepthof0to1m,fracturedrockfounduptothe depthof1to13m,Hardandcompact rockfounduptothedepthof13to26m.Hardrockhavethehighresistivity,sotherewillbenopresenceofgroundwater.
International Research Journal of Engineering and Technology (IRJET) e ISSN: 2395 0056
Volume: 09 Issue: 07 | July 2022 www.irjet.net p ISSN: 2395 0072
Point No. 4
Location: Latitude E18016’40’’andat Longitude N73033’88’’
Weatheredrockfounduptothedepthof0to10m,Fracturedrockfounduptothedepthof10to46m.Weatheredrock andfracturedrockhavelowresistivitysotherewillbepresenceofgroundwaterwithinthelevelofweatheredrockand fracturedrock.
Mapmakingisaneventthatweperformeveryday.GISallowsuserstocreate,collect,analyseandvisualizedatain an integrated database for use in a wide array of disciplines. Community based planners can utilize GIS along with contemporarydataandlocalknowledgeforcapacity buildingandlong termsustainability.Landuselandcovermapsare prepared byusing ofGISandobtainedfromIRS ID LISS III,whichgeoreferenced withSOIof1:50,000scale.Information onlanduseandlandcoverisrequiredfortheassessmentofgroundwateravailabilityandmanagement.Theresearcharea containsaverityoflandusesandlandcoveringincludingagriculturalland,builtuparearegion,forests,wastelands,trees andwaterbodies.Asshown,therearevariousclassesofdrainagedensityrangingfromverylowtoveryhigh.Inourstudy area it shows that zone of lower drainage density will have good groundwater prospectus. The slope is an important criterionindeterminingthepotentialzoneforgroundwater.Ithasanimpactoninfiltrationaswellassurfacerunoff.The VectorMapisacompilationofGISdataaboutEarthwithvaryinglevelsofdetailthatisvector based.

Based on all the case study presented, it shows that the application of SSR MP ATS had successfully helped engineersinmappingseveralcivilengineeringinterestsandproblem,especiallyduringpreliminarystageingroundwater exploration. The groundwater can be easily detected with supported by borehole data and geochemistry information as this technique is efficient in term of cost, time and data coverage. Besides, the types of arrays chosen during data acquisitionisimportantinobtainingpreciseresultbasedonthemainobjectiveofthestudy.Thetheoryandapplicationof resistivitymethodshouldbeexploredindepthbyengineerstoobtainareliableinformation.Toimproveunderstandingof this application, guidance and help from geophysicists are required as this field was their expert. We take 14 different readingswiththeSSR MP ATSmachineandgetthefollowingresults:point1depthofsoilis1.0mandweatherrockare1 23m.Byplottingtheinverseslope,wegetagraphthatshowshighgroundwaterispresentatthatpoint.Similarlyatpoint 2depthofsoilis4m.Weatherrockis1 7mandfracturerockare7 26m.Byplottinginverseslope,wegetthegraphwhich showshighgroundwaterpresentsatthispoint.Atpoint 3depthofweather rock is1m,fracturerock is1 13mandhard and compact rock is 13 26 m. Moderate groundwater presents and this site is suitable for civil construction purposes. Similarly,forpoints1 14wegetthevaluesforthoseparticularpointsandbyplottinganinverseslopegraphweget,points 1, 2,4,6,8,10,11,13 at these points we get high level of groundwater available and these sites are highly suitable for construction of wells and bore wells. For points 7,9,12 by plotting an inverse slope graph we get high depth difference betweenfracturedandhardandcompactrock.Atthesepointswegetthemoderatelevel ofgroundwateravailability.So, these sites are suitable for bore wells construction. For points 3,5,14 plotting by the inverse slope graphs we get highly present of hard and compact rocks, so in that case groundwater availability is very poor. These sites are suitable for constructionpurposes.
International Research Journal of Engineering and Technology (IRJET)
e ISSN: 2395 0056
Volume: 09 Issue: 07 | July 2022 www.irjet.net p ISSN: 2395 0072
Conclusive Table:
Points Location Water Presence
1
Latitude E180°17’08”Longitude N730°33’78’’ High
2 Latitude E180°17’06’’,Longitude N730°33’36” High
3 LatitudeE180°16’88’’Longitude N730°33’66’’ Low
4 Latitude E180°16’40’’Longitude N730°33’88’’ High
5 Latitude E180°17’10’’,Longitude N73033’99’’ Low
6 Latitude E18017’07’’,Longitude N730°34’29’’ High
7
Latitude E180°16’84’’Longitude N730°34’30’’ Moderate
8 Latitude E180°16’84’’Longitude N730°33’74’’ High
9
Latitude E180°16’75’’Longitude N730°33’86’’ Moderate
10 Latitude E180°16’60’’Longitude N730°33’61’’ High
11 Latitude E180°17’05’’Longitude N730°33’66’’ High
12
Latitude E180°17’18’’Longitude N730°33’82’’ Moderate
13 Latitude E180°17’30’’Longitude N730°33’75’’ Low
14 Latitude E180°17’44’’Longitude N730°33’54’’ High
From the foregoing, it may be mentioned that both resistivity imaging results revealed the highly complex hydrogeological setting of the study area. These studies also identified potential aquifer zones in such a geologically complexsetting.Resistivitymodelsgeneratedbyinversemodellingofmeasuredapparentresistivitydatasignifypotential groundwateraquifersatlateraldistancesoverdifferentprofiles,wegetthesoilat0 50Ωmofdepth,whereinfracturedand weathered rocks are predominant at depths beneath 151 250Ωm and 51 150Ωm simultaneously. Which is good for potentialzoneexplorationofwater.Layerofhardandcompactlayerwithintercalationofsandindicatesat251 1000Ωm. The vertical electric resistivity data helps to indicate different types of aquifers present in the study area. By this we identifythepotentialaquiferzone.Thelongitudinalcondensemapsuggeststheareafallsunderthecategoryofverygood andexcellentprotectivecapacityratingwhichisahightransmissivityinsomepartofthearea whichformsthe potential aquifers. The lithology of the bore well also supports the resistivity model. Also, result indicates that the low resistivity obtained at depths of and below is conducive for groundwater extraction. This zone coincides with the low resistivity precinct observed at distance over profile. Thus, this spot can be considered to drill a bore well. The combine result of lithologyandobtaindatafromtheelectricresistivitymetersignifythevariouseffectiveresulttofindoutmostsuitablesite for groundwater exploration. This study is beneficial to the farming community for exploration and management of groundwater.Inthefollowing14readingwhichweredecidedbydoingGISsurveyofthestudyarea. Also,byreferringall the maps slope, drainage density, land use and land cover. Then after the points were decided electric resistivity meter wasusedtofindoutthegroundwaterlevelaswellasrocksotocrosscheckthedataofGIS.
1. Abdul Hameed M Jawad Alobaidy, Mukheled A Al Sameraiy, Abass J Kadhem & Athmar Abdul Majeed 2010, ‘Evaluationoftreatedmunicipalwastewaterqualityforirrigation’,JournalofEnvironmentalProtection,vol.1,no. 3,pp.216 225.
2. Asheesh Sharma, Madhuri Naidu & Aabha Sargaonkar 2013, ‘Development of computer automated decision supportsystemforsurfacewaterqualityassessment’,Computers&Geosciences,vol.51,pp.129 134.
International Research Journal of Engineering and Technology (IRJET) e ISSN: 2395 0056
Volume: 09 Issue: 07 | July 2022 www.irjet.net p ISSN: 2395 0072
3. Austin, R.S., and Rhoades, J.D. (1979): A compact low cost circuit for reading four electrode salinity sensors. Soil Sci.Soc.Am.J.43.808 809,
4. Bineet Singh, Vikas Jain & Anuraag Mohan 2013, ‘Monitoring of groundwater chemistry in terms of physical and chemical parameters of Gajraula a semi urbanized town of North India’, Physics and Chemistry of the Earth, vol. 58 60,pp.34 41.
5. Cheng Shin Jang, Shih Kai Chen & Lin Ching Chieh 2017, ‘Using multiple variable indicator kriging to assess groundwater quality for irrigation in the aquifers of the choushui river alluvial fan’, Hydrological Processes, vol. 22,pp.4477 4489.
6. DeepaliMarghade,MalpeDB&ZadeAB2012,‘Majorionchemistryofshallowgroundwaterofafastgrowingcity ofCentralIndia’,Environ.MonitAssess,vol.184,pp.2405 2418
7. Irene M Farnham, Vernon F Hodge, Kevin & Johannesson, H 1999, ‘Using multivariate statistical analysis of groundwater majorcationandtraceelementconcentrationsto evaluategroundwaterflowina regional aquifer’, HydrologicalProcess,vol.13,no.17,pp.153 167.
8. Islam & Shamsad 2009, ‘Assessment of irrigation water quality of bogra district in bangladesh’, Bangladesh JournalofAgricultureResearch,vol.34,no.4,pp.597 608.
9. JafarAhamed,A,Ananthakrishnan,SK,Loganathan,K&Manikandan,K2013,‘Assessmentofgroundwaterquality forirrigationuseinalathurblock,perambalurdistrict,tamilnadu,southindia’,AppliedWaterScience,vol.3,no.4, pp.763 771.
10. Jamshidzadeh, Z & Mirbagheri, SA 2011, ‘Evaluation of groundwater quantity and quality in the Kashan Basin, CentralIran’,Desalination,vol.270,pp.23 30.
11. Kavta Batheja, Sinha A K, Geota Seth & Jaipal Garg 2007, ‘Physicochemical characteristics of groundwater at ChurerTehsil,Rajasthan,India’,JournalofEnvironmentalScienceandEngg.,vol.49,no.3pp.203 206.
12. Lazhar Belkhiri, Abdurrahman Boudoukha, LotfiMouni & ToufikBaouz 2010, ‘Multivariate statistical characterization of groundwater quality in ain azel plain, algeria’, African Journal of Environmental Science and Technology,vol.4,no.8,pp.526 534.
13. ManishKumar,KalpanaKumari,Ramanathan&RajinderSaxena2007,‘Acomparativeevaluationofgroundwater suitability for irrigation and drinking purposes in two intensively cultivated districts of punjab, india’, EnvironmentalGeology,vol.53,pp.553 574.
14. Mithas Ahmad Dar, Sankar, K & Imran Ahmad Dar, 2010, ‘Major ion chemistry and hydrochemical studies of groundwaterofpartsofPalarriverbasin’,TamilNadu,India,EnvironMonitAssess,vol.176,no.1 4,pp.621 636.
15. Naik PK, Tambe J, Duhury B N & Tiwari A N 2008, ‘Impact of urbanisation on the groundwater regime in a fast growingcityinCentralIndia’,EnvironmentalMonitoringandAssessment,vol.146,pp.339 373.
16. Nilgun, Harmancioglu & Necdet Alpaslan 1992, ‘Water quality monitoring network design: A problem of multi objectivedecisionmaking’,WaterResourcesBulletin,vol.28,no.1,pp.179 192.
17. Prakash,KL&Somashekar,RK2006,‘GroundwaterqualityassessmentonAnekalTaluk,BangaloreUrbanDistrict, India’,JournalofEnvironmentalBiology,vol.27,no.4,pp.633 637.
18. Sadik,B., Jawad and Karim,A.H., “Groundwater monitoring network Rationalition using statistical analysis of peizometricfluctuation”,Hydrologicalsciences Journal des sciences,Vol.33,No.2,1998.
19. Sang KiMoon,NamChilWoo&KwangSLee2004,‘Statisticalanalysisofhydrographandwater tablefluctuation toestimategroundwaterrecharge’,JournalofHydrology,vol.292,no.1,pp.198 209.
International Research Journal of Engineering and Technology (IRJET) e ISSN: 2395 0056
Volume: 09 Issue: 07 | July 2022 www.irjet.net p ISSN: 2395 0072
20. Saravanakumar,K&Ranjithkumar,R2011,‘AnalysisofwaterqualityparametersofgroundwaternearAmbattur industrialarea,TamilNadu,India’,IndianJournalofScienceandTechnology,vol.4,no.5,pp.660 662.
21. Soumaya Hajji, Bachaerayed, Ibtissemriahi, Nabila allouche, EmnaBoughariou & Salem Bouri 2018, ‘Assessment and mapping groundwater quality using hybrid PCA WQI model: case of the middle miocene aquifer of hajeblayoun jelmabasin(CentralTunisia)’,ArabianJournalofGeosciences,vol.11,pp.620 641.
22. Srinivasa Reddy, K 2013, ‘Assessment of groundwater quality for irrigation of bhaskar rao kunta watershed, nalgonda district, india’, International Journal of Water Resources and Environmental Engineering, vol. 5, no. 7, pp.418 425.
23. Sumit Das & Sudhakar D Pardeshi 2018, ‘Integration of different influencing factors in GIS to delineate groundwater potential areas using IF and FR techniques: A study of pravara basin, maharashtra, india’, Applied WaterScience,vol.8,pp.197 213.
24. Tahmasebi, P, Mahmudy Gharaie, MH, Ghassemzade, F & Karimi Karouyeh, A 2018, ‘Assessment of groundwater suitabilityforirrigationinagoldminesurroundingarea,NEiran’,EnvironmentalEarthSciences,vol.77,pp.766 775.
25. Tiwari and Manzoor Ali, “Groundwater of Nuzrid town: Regression and chemical analysis of water quality parameters”,IndianJournalofEnvironmentalProtection,Vol 9,No.1,1989,PP:13 38.
26. Tyagi,SK,Datta,PS&Pruthi,NK2009,‘Hydrochemicalappraisalofgroundwateranditssuitabilityintheintensive agriculturalareaofMuzaffarnagardistrict,UttarPradesh,India’,EnvironGeol,vol.56,no.5,pp.901 912.