International Research Journal of Engineering and Technology (IRJET) e ISSN: 2395 0056

Volume: 09 Issue: 06 | Jun 2022 www.irjet.net p ISSN: 2395 0072

International Research Journal of Engineering and Technology (IRJET) e ISSN: 2395 0056
Volume: 09 Issue: 06 | Jun 2022 www.irjet.net p ISSN: 2395 0072
Atul Suryawanshi1, Shantanu Sapkal2, Aniket Patil3, Satyajeet Vhanbatte4 , Shatakshi Kokate5
1234Dept of Computer Science & Engineering, DYPCET, Kolhapur.
5Professor, Dept. of Computer Science & Engineering, DYPCET, Kolhapur. ***
Abstract In Worldwide markets, there was a need to segmentandanalyzethecustomersandproductdatathatwas being generatedoverthe period whichwas inampleamount. In CMO 2019 Survey, the 41% of marketing leaders said that their teams use artificial intelligence to improve their customer acquisition and segmentation efforts.
The idea behind this model is to improve the marketing strategies among the firms by using Data Severance Technology. The implemented parts are basically like customer segmentation and product segmentation using multiple algorithms such as RFM (Recency, Frequency, Monetary), k means, ABC and Pareto Analysis. The model demonstrates the benefits using these algorithms for analyzing customer purchasing and product selling data in trade sector with formation of meaningful clusters. In this paper,Thesystemproposedtwoclusteringmodelstosegment 642,234 customers data and 20,870 products data by considering their RFM values and Class A, Class B, Class C values. In earlier processes, functioning was not efficient to segment and analyze the data. Hence, The System developed this model to overcome traditional segmentation techniques andscale up the processing andanalyzing rawdata with the help of well structured algorithms and marketing strategies.
Key Words: Segmentation, Marketing Strategy, Elbow Method, k-means, RFM (Recency, Frequency, Monetary), Pareto, ABC analysis, Clustering, Machine Learning, etc.
In today's environment, where the world is viewed as a globalvillage,marketinghasbecomeacriticalcomponentof anycompany'ssuccess.Becausecompetitioniscutthroat,it isbecomingincreasinglydifficultforanycompetitortostay in the market for an extended period. Marketing's underlyingbeliefisthatifyoudon'tchange,you'lldie.Asa result,itisnecessarytoestablishanappropriatemarketing planovertime.Therightmarketingstrategyaidsbusinesses inachievingtheirmarketingobjectives.Marketingobjectives aidintheachievementofcompanyobjectives,whichattempt togainacompetitiveadvantageovercompetitors.[1]
Data Severance refers to using a variety of data analysis techniquesandalgorithmstodiscoverpreviouslyunknown, valid patterns and relationship in large dataset [2]. Data Severancetechniqueslikeclusteringandsegmentationcan beusedtofindmeaningfulpatternsforfuturepredictions. This model introduced Data Severance technique using
Machine Learning into two segments. First is Customer Segmentation and Second is Product Segmentation. In Customer Segmentation, the system uses RFM (Recency, Frequency,Monetary)andK meansclusteringalgorithmto mine data of customer into the meaningful clusters. Secondly, In Product Segmentation ABC Analysis implementedwithParetocharttoanalysetheproductdata forthefuturemarketingstrategies.
Companiesmustgainabetterunderstandingoftheirclients' data in all aspects. Customer company engagement has becomeincreasinglydependentondetectingsimilaritiesand variances among customers, forecasting their behaviours, andofferingbetteroptionsandpossibilitiestocustomers.In thiscase,segmentingcustomersbasedontheirdatabecame critical.
For many years, RFM (recency, frequency, and monetary) valueshavebeenusedtodeterminewhichconsumersare important to the organisation, which customers require promotionalefforts,andsoon.Organisationsandindividuals havewidelyemployeddata miningtoolsandstrategies to analyse their stored data. Clustering is a data mining task thathasbeenusedtogrouppeople,objects,andotherthings [3].Customers,asmarketersareaware,haveawiderangeof demandsanddesires.Companieshaveutilisedavarietyof segmentationcriteriaandapproachestobetteridentifyand understand client groups and supply them with more appropriate products and services to meet their various needsanddesires.
AClusteringalgorithmisamethodforgroupingaphysicalor abstract entityinto groups ofrelated things.A cluster isa collectionofdataobjectsthataresimilartooneanotherbut distinctfromthoseinotherclusters[4].Clusteranalysisis based on unsupervised learning, which is based on the similarityinclusteringdatasets.TheK meansalgorithmhas numerous advantages in the partition based clustering technique, including basic mathematical ideas, fast convergence,andeaseofimplementation[5].
ABC analysis is one method that the organisation should explore.ABChasasignificantimpactontheperformanceof retail businesses. Companies must ensure that productsrequiredbycustomersarecontinuallyavailable[6]. ABC analysis is a method of inventory classification that dividesitemsintothreegroups(A,B,andC),withAbeing themostvaluedandCbeingtheleastvaluable.Thegoalof
International Research Journal of Engineering and Technology (IRJET) e ISSN: 2395 0056
Volume: 09 Issue: 06 | Jun 2022 www.irjet.net p ISSN: 2395 0072
thisstrategyistofocusmanagers'attentiononthecritical few(A items)ratherthantheinsignificantmany(C items).
AccordingtotheABCapproach,acorporationshouldrank thingsonascaleofAtoC,basedonthefollowingrules:A itemsaregoodswiththehighestyearlyconsumptionvalue; typically, the top 70 80% of a company's annual consumption value accounts for only 10 20% of total inventory items. B items are interclassed items with a medium consumption value; they typically account for 30 percent of total inventory items and account for 15 25 percentofannualconsumptionvalue.C items,ontheother hand, are the things with the lowest consumption value; typically, the bottom 5% of annual consumption value accountsfor50%oftotalinventoryitems.
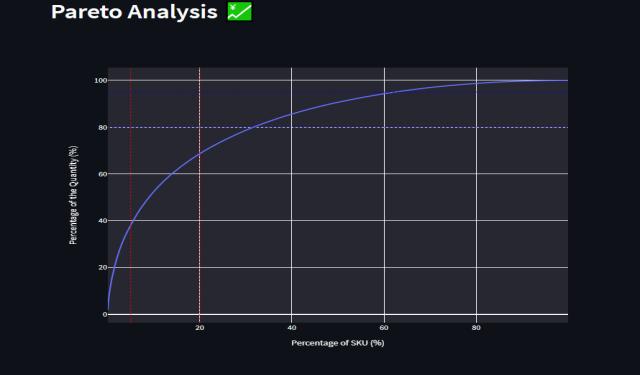
For a number of brands in the CPG (Consumer packaged goods)business,theParetoPrinciple,sometimesknownas the 80/20 rule, is used. Pareto analysis is a statistical techniqueforselectingthesmall number ofactivities that have the most important overall effect in decision making.[7]Itisbasedontheprincipleoffindingthetop20% ofreasonsthatmustbeaddressedinordertosolve80%of the problems. The Pareto Principle describes markets dominated by a limited number of best selling products, with a small group of buyers accounting for most of the purchasingvolume.
The goal is to determine what observable customer and productsegmentationalgorithmaretheneed basedmarket segmentationactionable.
For Customer Segmentation, data was taken from a retail store,whileforProductSegmentationthatdatawasused.In thiswork,customersegmentationalgorithmsandproduct segmentationanalyseswereusedtogetanaccurateresult.
Totaldataisloaded,andtotalpricesaredeterminedinsuch a way that Quantity is multiplied by price for monetary calculations in RFM analysis. After that, invoice dates for frequency areseparated andCustomerIDs forrecency are extracted from the datasets, and other columns such as frequency,recency,andmonetaryvaluearecreated.
Then,usingadifferentdataset,LogarithmicTransformation isusedtoobtainminimumvaluesforspeediercomputations. Followingthat,RFMProcessingstart.
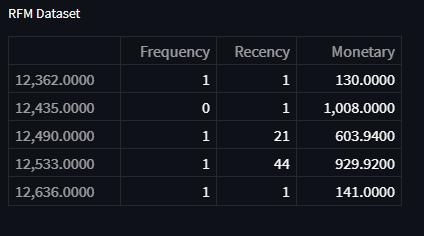
Figure 1: Tobegin,thedatasetisimportedandclassified accordingtoInvoice,Description,Quantity,Invoice,Date, Price,
CustomerID, Country, Customer City, Age, and Gender. So, whilesortingthisout,it'sbrokendownintothreecategories: recency,frequency,andmonetaryvalue.
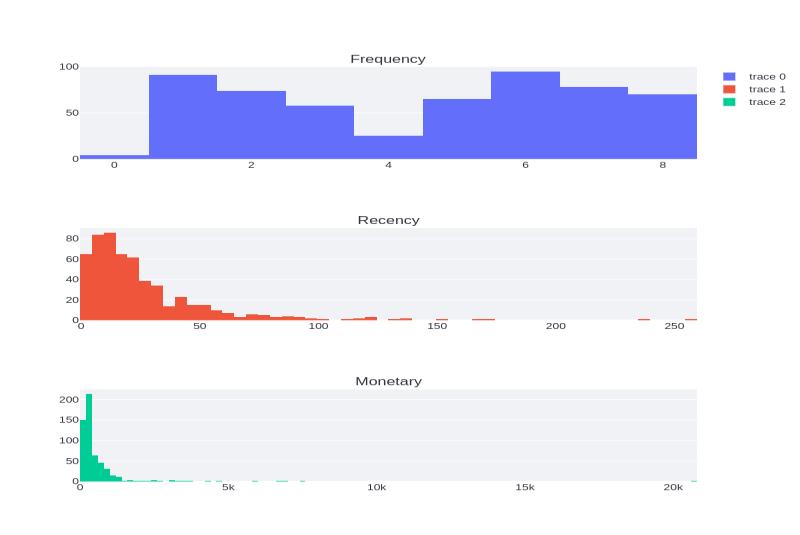
Figure - 2.1: DistributionoftheFeatures
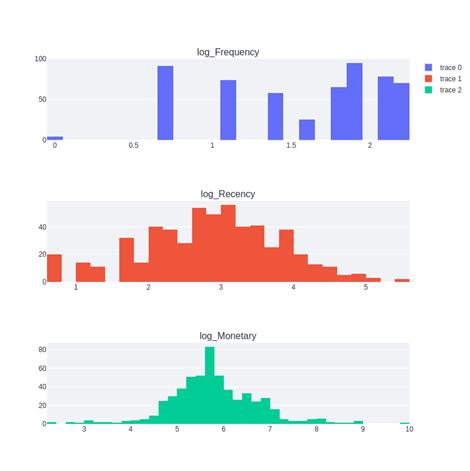
Figure 2.2: Distributionof Features(Logarithmic)
International Research Journal of Engineering and Technology (IRJET) e ISSN: 2395 0056
Volume: 09 Issue: 06 | Jun 2022 www.irjet.net p ISSN: 2395 0072
Scikit learnisamachinelearningpackagethatcanbeused via Python. It may be used to produce accurate forecasts using machine learning techniques. Using the code below, the K means clustering model was imported into Scikit learn.
A cluster is a collection of data points that have been groupedtogetherduetoparticularcommonalities.
Thenumberofcentroidsinthedatasetisreferredtoasthe goalnumberk.Acentroidisafictionaloractualplacethat representsthecluster'scenter
Byloweringthein clustersumofsquares,eachdatapointis assignedtooneoftheclusters.
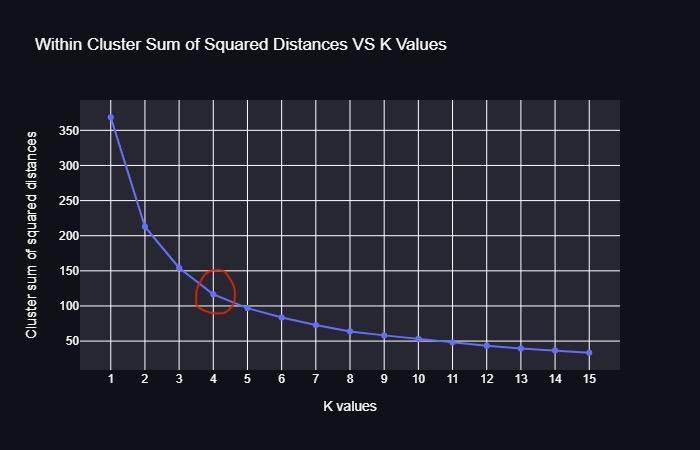
The number of clusters (K) are altered in the Elbow approachfrom1ton.TocalculateWCSSforeachvalueofK. (Within Cluster Sum of Square) In a cluster, WCSS is the sum of squared distances between each point and the centroid.TheplotappearslikeanElbowwhenplottingofthe WCSSwiththeKvalue.TheWCSSvaluewillbegintofallas thenumberofclustersgrows.WhenK=n,theWCSSvalueis the highest. When examined graph will shift rapidly at a point,forminganelbowshape.Thegraphbegins totravel practically parallel to the X axis at this point. The ideal K value,ortheoptimalnumberofclusters,correspondstothis point.
Step2:Assigneachdatapointtoaclusteratrandom.
Step3:Calculatethecoordinatesofthecluster'scentroid.
Step4:Calculatethedistancesbetweeneachdatapointand the centroids, then reassign each point to the cluster centroidwiththeshortestdistance.
Step5:Determineclustercentroidsoncemore.
Step6:Repeatsteps4and5untilreachedaglobaloptimum, when no more improvements are conceivable and data pointscannotbeswitchedfromoneclustertothenext.
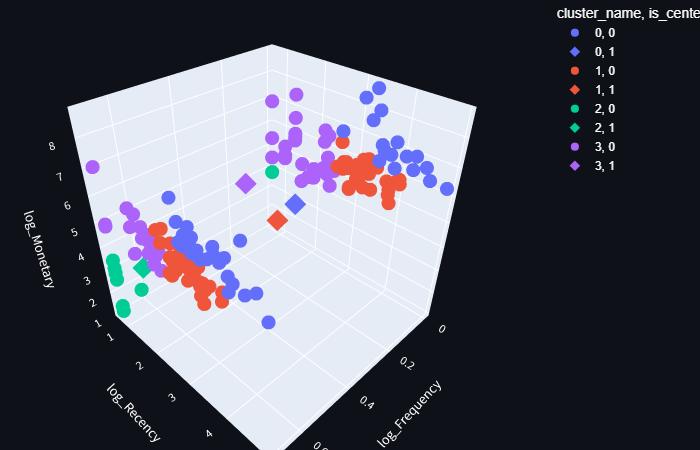
Figure 4: K MeansClustering(3DGraph).
As shown in Figure 4, Created a 3D graph of a Clusters utilizing K Means Algorithmic Data as well as the Python Librarymatplotlib.pyplot
TheKvalue,orideal numberofclusters, is x,which is the pointatwhichtheelbowshapeisformed.
Step1:UsingtheElbowapproach,calculateKandprovide thenumberofclustersK.
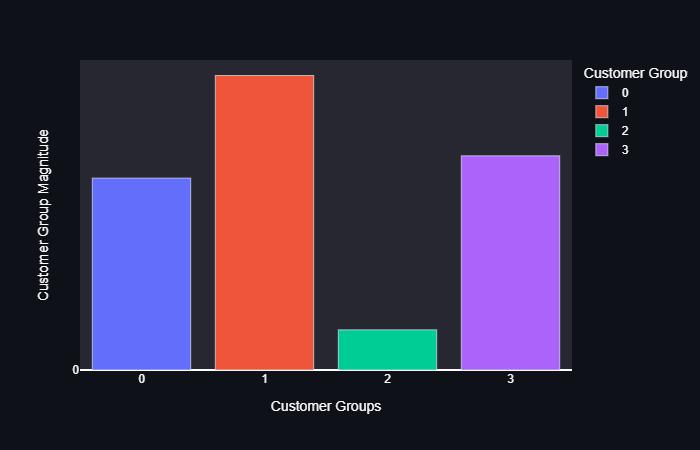
The conclusion from these figures that buyers are purchasing things in a reasonable manner. These clients mustberegulars.
The conclusion from these figures that people are buying fewerthings,buttheyarebuyingmorethannormal.
International Research Journal of Engineering and Technology (IRJET) e ISSN: 2395 0056
Volume: 09 Issue: 06 | Jun 2022 www.irjet.net p ISSN: 2395 0072
CLUSTER2
The conclusion from these figures that consumers are rookieswhohavejustrecentlybegunusingthestore,which explainswhytheirfrequencyandmonetaryvaluesarelow. Thesebeginnerclientsmightbequitevaluableifitcanentice themwithdiscountsandspecialoffers.
Theconclusionfromthesefiguresthattheclientsarerookies whoarebuyingthingsinahurry.Thesearetheclientswho aremostlikelytopatronizetheshop. Withtheprocessingoftheprecedingalgorithms,arrivedat theultimateresultofCustomerSegmentation,asillustrated inFigure5.
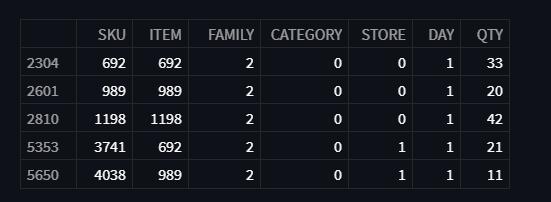
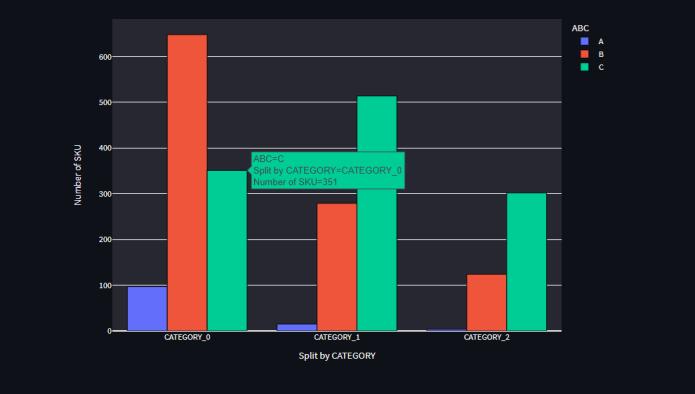
As illustrated in Figure 6, the Dataset is first put into the modelandthensegmentedintothefollowingparameters: SKU(StockKeepingUnit),Item,Family,Category,Store,Day, andQuantity.Followingthat,theABCanalysis,usingPareto asaguide,beginstheprocessofclassifyingthesequalities intothreegroups:ClassA,ClassB,andClassC.
4. Gathered data, marking the category each time, or compileddatathatwaspreviouslyavailable.
5. Addedthetotalsforeachofthecategories.
6. For the measurements used a scale that was appropriate. The maximum value will be the highest subtotal from step 5. On the figure's left side, tooka noteofthescale.
7. Each category's bar was created and labelled. The tallestwasplacedonthefarleft,followedbythenext tallest on the right, and so on. Small measurement categoriescanbeputtogetheras"other"iftherearea lotofthem.
8. Bydividingthesubtotalforeachcategorybythetotal forallcategories,thepercentageforeachcategorywas calculated. Created a right hand vertical axis with percentagelabels.Double checkedthatthetwoscales are in sync. On the right scale, for example, the left measurementforone halfshouldbepreciselyopposite 50percent.
9. By combining the subtotals for the first and second categories and placing a dot above the second bar to denotethetotal,Calculatedanddrewcumulativesums. Tosymbolizethenewtotal,Addedthesubtotalforthe thirdcategorytothatamountandplacedadotabove the third bar. The technique was continued for the remainingbars.Thedotsatthetopofthefirstbarwere connected.Thelastdotontherightscaleshouldbeat 100percent.
Figure 6: LoadedDatasetsegmentedintoabove parameters.
TheParetoPrinciplestatesthatineverysystem,themajority of the results originate from only 20% of the efforts or causes. ABC Analysis revealed the 20% of the goods that offeraround80%ofthevaluebasedonPareto's80/20Rule.
1. Compiled a list of the categories that were used to organizethings
2. Appropriate measurements were determined. The termsFrequency,Recency,andMonetaryareallused interchangeably.
3. DeterminedtheperiodcoveredbytheParetofigure:Is ittruethatthereisonlyoneworkcycle?Isittrulyafull day?Isittruethatit'sbeenaweek?
e ISSN: 2395 0056
Volume: 09 Issue: 06 | Jun 2022 www.irjet.net p ISSN: 2395 0072
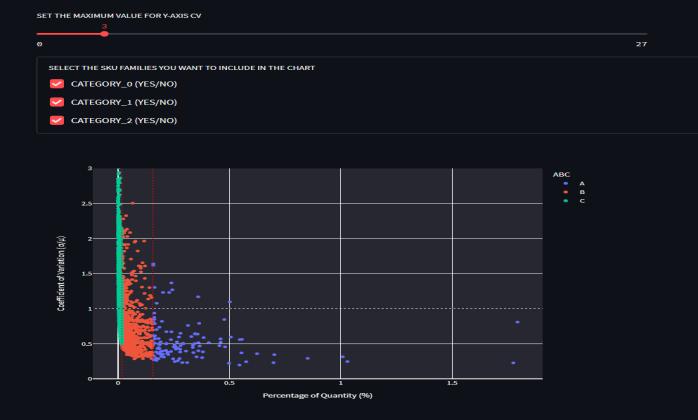
Demand Linearity, also known as Process Linearity, is a measure of the volatility or dispersion of a time series around the average, such as client orders. The standard deviation to mean ratio is known as the coefficient of variation (CV). Even when the means are different, CV is useful for assessing the degree of variance across distinct timeseries.Thebiggertherelativevarianceordispersion, thehighertheCv.
In Excel, Calculated the series' standard deviation (s, or) =STDEV.P(cellrange).
InExcel,Calculatedthemean(x,or)(oraverage)=AVERAGE (cellrange).
Thestandarddeviationtomeanratiowasthencomputed.
LowvariabilityisoftendefinedasaCVlessthan1.0,while highlystabledemandisdefinedasaCVlessthan0,asshown ingraph8
2.2.3.
Normalityreferstonormaldistribution,oftenknownasthe Gaussiandistributionorthebell shapedcurve,isatypeof statisticaldistribution.Themeanandstandarddeviationof the data define the normal distribution, which is a symmetricalcontinuousdistribution
The Shapiro Wilk test generates a W statistic that determinesifarandomsample,x1,x2,….,xn,isdrawnfrom a normal distribution.Small Wvalues indicatea deviation from normality, as well as percentage points for the W statisticacquiredbyMonteCarlosimulations.
ThefollowingformulaisusedtoobtaintheWstatistic:
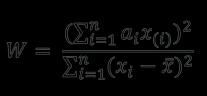
where the ai are constants formed from the means, variances,andcovariancesoftheorderstatisticsofasample ofsizenfromanormaldistribution,andthex(i)areordered samplevalues(x(1)beingthesmallest).
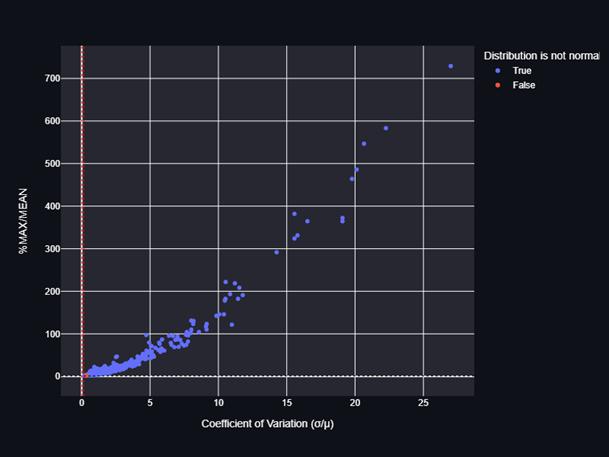
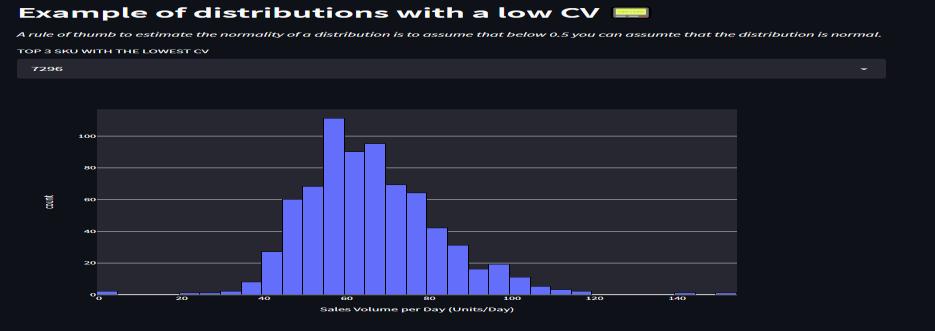
Plottedagraphofdailysalesvolumewithacounttogeta figure where the normality of the distribution is less than 0.5,indicatingthatthedistributionisnormal.
International Research Journal of Engineering and Technology (IRJET) e ISSN: 2395 0056
Whilerunningallthealgorithmsonadataset,concludedthat the product demand is stable or not stable, and that the product belongs to whatever class in terms of volatility, volume, and costing. We can determine which marketing strategies should be used in the future to increase the profitabilityofourfirmandproductsales.
Firmsmustunderstandtheirconsumerbasesandproduct salestogeneratemoremoney.Consequently,developedthis prototype to obtain exact and rapid results in order to strengthentheirmarketingtactics.
Algorithms usedlikek means,RFM analysis, ABCanalysis withParetoandAppliedtheShapiro Wilktestfornormality in this product. Obtained information on customers' acquisition,purchasingbehaviors,andthemoneytheyspend onaproductbyexecutingthisprojectmodel.
ProductsDemand,VolatilityandVolumearekeyparameters ofthisresearch.Knowingthisallowsustodeveloporadjust variousmarketingstrategieswhichbenefitsinproductsand customerssegmentationandfuturescopeinordertocreate moreincome
[1]. Sulekha Goyat. “The basis of market segmentation: a criticalreviewofliterature”inEuropeanJournalofBusiness andManagement,2011
[2].WangShunye,CuiYeqin,JinZuotaoandLiuXinyuan “K meansalgorithminthe optimalinitialcentroids based ondissimilarity”inJournalofChemicalandPharmaceutical Research,2013
[3]. Onur DOG N, Ejder Y IN and Zeki tıl BULUT. “CUSTOMERSEGMENT TIONBYUSINGRFMMODEL ND CLUSTERING METHODS: A CASE STUDY IN RETAIL INDUSTRY” in International Journal of Contemporary EconomicsandAdministrativeSciences,2018
[4].Sun,J.;Liu,J.;Zhao,L.“Clusteringalgorithmresearch.”In JournalofSoftware2008[CrossRef]
[5]. Li, X.; Yu, L.; Hang, L.; Tang, X. “The parallel implementation and application of an improved k means algorithm.” in The Journal of Electronic Science and Technology(JEST),2017
[6].IMDPAsana,MLRadhitya,KKWidiartha*,PPSantika andIK GWiguna“Inventorycontrolusing BCandmin maxanalysisonretailmanagementinformationsystem”in InternationalConferenceonInnovationinResearch,2022
[7]. Daniel M. McCarthy and Russell S. Winer “The Pareto rule in marketing revisited: is it 80/ 20 or 70/20?” in Springer,2019
Atul Suryawanshi: Receiving his bachelor’sdegreeincomputerscience andEngineeringfromDYPatilCollege of Engineering & Technology, Kolhapur, India. It is affiliated to Shivaji University, Kolhapur. His research interests are in Artificial Intelligence,clusteringtechniquesand marketingstrategies.
Shantanu Sapkal: Receiving his bachelor’sdegreeincomputerscience andEngineeringfromDYPatilCollege of Engineering & Technology, Kolhapur, India. It is affiliated to Shivaji University, Kolhapur. His research interests are in Machine Learning,algorithms,andfuzzysets


Aniket Patil: Receivinghisbachelor’s degree in computer science and EngineeringfromDYPatilCollegeof Engineering&Technology,Kolhapur, India. It is affiliated to Shivaji University, Kolhapur. His research interestsareinDatamining,clustering techniquesandmarketingstrategies.


Satyajeet Vhanbatte: Receiving his bachelor’sdegreeincomputerscience andEngineeringfromDYPatilCollege of Engineering & Technology, Kolhapur, India. It is affiliated to Shivaji University, Kolhapur. His research interests are in sales analysis, fuzzy sets, and marketing techniques.
Mrs. Shatakshi Kokate: Receivedher bachelor’s and master’s degree in computer science and engineering fromShivajiUniversity,Kolhapur She is a PhD candidate in Rashtrasant Tukdoji Maharaj Nagpur University and faculty member in the DepartmentoffComputerScienceand Engineering, D Y Patil College of Engineering and Technology, Kolhapur. Her research interests are in cloud computing, blockchain, IoT andcomputernetworks.
Volume: 09 Issue: 06 | Jun 2022 www.irjet.net p ISSN: 2395 0072 © 2022, IRJET | Impact Factor value: 7.529 | ISO 9001:2008 Certified Journal |