International Research Journal of Engineering and Technology (IRJET) e-ISSN:2395-0056

Volume: 09 Issue: 06 | June 2022 www.irjet.net p-ISSN:2395-0072

International Research Journal of Engineering and Technology (IRJET) e-ISSN:2395-0056
Volume: 09 Issue: 06 | June 2022 www.irjet.net p-ISSN:2395-0072
1Ramapada Sasmal, 2Dr Soma Bhattacharya⁕
1Research scholar, Department of Geography, Vivekananda College for Women, University of Calcutta and Assistant Professor, Arambagh Girls’ College, University of Burdwan, West Bengal, India. Phone: +91 6294897700,
1Principal, Vivekananda College for Women, University of Calcutta, West Bengal, India.Phone: +91 9874220701, ***
Abstract: The tourism and tea plantation is the backbone of economy of the Chal River basin. But, the neo tectonic activities causes landslide and gully erosion, which are the main obstacle of the said economic activities of this basin area. The Main Central Thrust (MCT), Ramgarh Thrust (RT), Main Boundary Thrust (MBT), Main Frontal Thrust (MFT), and Ghish Travers Zone (GTZ) are the major tectonic signature in this basin. The neo tectonic activities of this thrust contacts is not homogeneous throughout the basin area. The identification of the neo tectonic variation of those thrust contacts is the main aim of this article. To identify this variation the measurement and analysis of the morphometry of relief, basin area and drainage networks and the identification and measurement of sedimentology are the main objective of this study. In this purpose SRTM DEM data of the USGS are analyzed with the help of GIS software and the tectonic terrace, area of headword erosion of the streams and the physical properties of the sedimentary facies are examined in the field. Analysis found a prominent break in slope near RT, highly elongated nature of the 2nd and 3rd order sub basin, circular sub basin in the north of MCT, presence of headword erosion near MBT, alteration of coarse and fine grain sedimentary facies in the south of RT, scale like foliation of phyllaite near RT, presence of boulder facies in the flood plain area etc. All the observation advocates for relatively inactive or negligibly active nature of MCT and MFT, active nature of RT and GTZ, and gradual reactivation of MBT in the study area.
Keywords: Morphometry,Sub basin,Neo tectonic,Thrustcontact,Facies,Sinuosity
Neo tectonicis a problem in the Chel River basin. Because, neo tectonic deformation causes landslide and gullyerosion,which makesanobstacleinthe plantation of tea and growth of the tourism industry. The tea is cultivatedherebothinthemountainsurfaceandlowfun area. But, the neo tectonic activities causing gully erosion accelerate soil erosion, which hampers the tea plantation mainly in mountain terrain. However, the LavaRoadstretchesthroughthecentralaxisofthisbasin in a north south direction. The landslide along this road atalowerattitudinalareahamperstheflowoftouristsin this area. Alternatively, neo tectonics reshape the sub basins, which cause flood and resultant hampering of crop cultivation in the lower basin area. So, the Chel basin needs to the identification of the variation of tectonic impact on its different parts for the remedial measureoftheaforesaidproblems.
Eminent scholars worked out on the tectonics, geology and drainage system of the Himalayas. Latitudinal division of the Himalayas has been done basedongeologyandgeotectonic(Heim,A.andGansser, A.,1939;Yin,A., 2006; Valdiya,K.S.2002).Thestudy of
regional tectonic setting in the Darjiling Sikkim Tibet (DaSiT)Himalayanwedgehasbeenconducted (Mitra,G. et al., 2010; Mukul, M. et al. 2014). Some micro level studiesonMCT(Yin,A.2006;Srivastava,V.etal.,2017), RT (Pearson, O. N. and DeCelles, P. G., 2005; Mukul, M., 2010;Mitra,G.etal.2010;MatinandMukul,2010),MBT (Nakata,T.,1989;Mohapatra,S.R.etal.,2012;Srivastava, V.,2017)andMFT(Geddes,1960;Mohapatra,S.R.etal., 2012; Srivastava, P. and Mitra, G., 1994; DeCelles, P. G., Gehrels,G.E., Quade, J.and Ojha,T. P., 1998.) have been doneinthisregion.Mostgeomorphologistspayattention to the middle and western Himalayas to study the drainage system. Few geomorphologists studied major rivers in the eastern Himalayas (Basu and Sarkar,1990; Bhattacharya, S.; 2004; Chakraborty and Ghosh, 2010; Chakraborty et al., 2013; Chakraborty and Mukhopadhyay, 2014; Fergusson, 1863; Guha et al., 2007;MorganandMcIntire,1959).
However, the river Chel is flowing through a tectonic lineament (Dasgupta et al., 2000) Only Matin, A., and Mukul, M. (2010) deeply study the micro level tectonics along the course of the river Chel in the mountain area. He did not study tectonics to the lower reaches of the sedimentary surface. Still, now the river
© 2022, IRJET | Impact Factor value: 7.529 | ISO 9001:2008 Certified Journal | Page2609
International Research Journal of Engineering and Technology (IRJET) e ISSN:2395 0056
Volume: 09 Issue: 06 | June 2022 www.irjet.net p ISSN:2395 0072
Chel and its basin area are outside the focus of study. Few geographers maid their study in this region (Patel, P.P., 2012; Mandi, S. and Soren, K., 2016; Lama, S. and Maiti,R.,2019a;Lama,S.andMaiti,R.,2019b;Dhalia,Md K. et al., 2019) Most of their work is related to morphometry and sedimentology of Chel River. They rarely discoursed on the effects of neotectonics on Chel morphometry and sedimentology. Mandal, S., Sarkar, S. (2016) draws a correlation between neo tectonics, morphometry,andsedimentologyoftheChetbasin.But, the tectonic variation of this basin area has not been identified. Tectonic variation causes different geomorphic problems of land use. The main aim of this study is to identify the tectonic variation in different parts of the study area. To satisfy this aim, the measurement and analysis of relief, basin and drainage morphometry and the primary observation and analysis of tectonic terraces and physical properties of the sedimentary facies of this area are considered the objectivesofthisstudy.
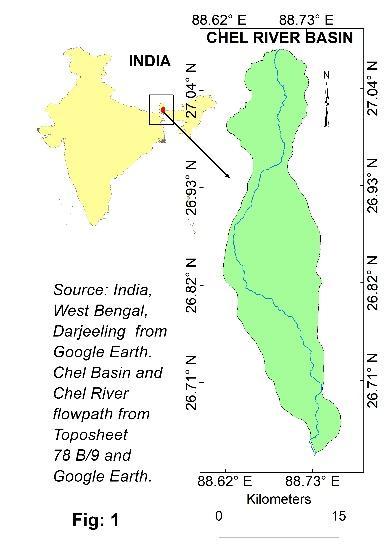
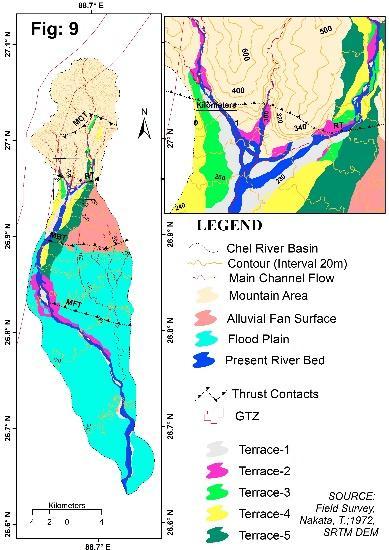
about66.7kmfromDarjeelingHimalayasinthenorthto TistaRiverinthesouthandhas388.65sq.kmbasinarea approximately and bounded by 27° 5'5.67"N to 26°37'42.95"Nand88°37'12.13"Eto88°45'59.06"E(Fig: 1).The river basincomprisesboththe mountain area of Kalimpong district and foothills plain land of Jalpaiguri district. During the rainy season, the river deposits profuse sediments to the foothills and forms the foothill plain. The mountainous terrain is the source of sediments. Different primary processes, ie. Rock gravity processes, sediment gravity processes, fluid gravity processes,yieldsediments.Withmonsoon,neo tectonics control the process of sediment erosion and deposition. Differenttectonicthrusts,ie.MCT(MainCentralThrust), RT (Ramgarh Thrust), MBT (Main Boundary Thrust), MFT (Main Frontal Thrust) are the chief inscription of tectonics. The Chel basin comprises a different type of geomorphic surface, ie. mountains, alluvial fan, river terrace and flood plain (Fig:9). Neo tectonics are responsible for the segmentation of geomorphic surfaces.Theriverterrace,incisionofriver,meandering, escarpment, reverse graded facies profile, a repeat of coarse and fine texture in the facies sediments, are the imprintsoftectonicsonChelbasin.
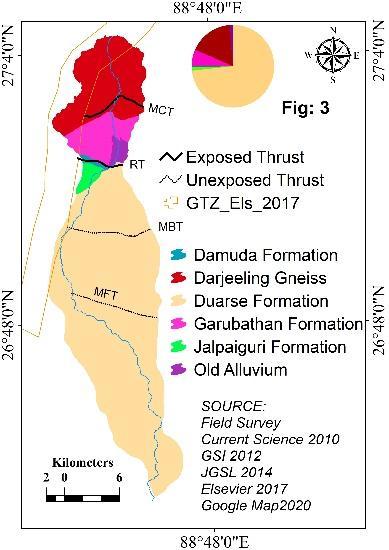
2.1. Tectonic Setting: The eastern Himalaya is combination of Trans Himalaya (TH) and Darjeeling Sikkim Himalaya (DSH). MCT is the northern limit of DSH and split into MCT 1 and MCT 2 (Fig: 2) due to duplexformationinDSH(Mitra,G.etal.,2010;Mukul,M. etal.2014).SouthofMCT,theMBTandMFTareformed (Yin, A. 2006). In Chel basin, the RT is formed between MCT2 and MBT (Mitra, G. et al. 2010; Mukul, M. et al. 2014) TheGhishTransverseFault(GTF)islicatedinthe westofbasinmargin(Fig:2).Fourlineamentssuchasthe Tistalineament,Gangtoklineament,Goalparalineament, and Kanchenjunga lineament (Fig:2) traverse the DSH duplex(Mukul,M.etal.2014) InthenorthofChelbasin, the earthquake epicentres are clustered in LHD (Lower Himalayan Duplex) of Sikkim Himalaya between MCT and MBT (Mukul, M. et al.; 2014; Fig:2). In the south of LHD, the MBT (Fig:2) tectonically is less effective than MCT. The tectonically inactive MBT presently is getting active by folding of younger footwall along South KalijhoraThrust(SKT)(Mukul,M.etal.2014).
Fig: 1-Locationmap;
TheriverChelisasouth flowingperennialriver of the mountain of eastern Himalayas. The monsoon climateisresponsibleforitsperennial condition.Itruns
Mukul, M.; et all. (2014) identify Garubathan recess in the Darjeeling Himalaya (Fig: 2) This recess wasfoldedbytheGTFinthestudyarea(Mukul,M.;etal. 2014) Inthisrecess,theMCT 1is identifiedas MT(Yin, A. 2006; Srivastava, V. et al., 2017). The RT (Pearson, O. N., and DeCelles, P. G., 2005) is recognized regionally or locally in a different name i.e. North Kalijhora Thrust (NKT) (Mitra, G. et al. 2010), Garubathan thrust (GT), MatialliFault,Thalijhora Jitifault. RT(MatinandMukul, 2010)isalsocomparabletoMBT(Nakata,T.,1989)inthe
International Research Journal of Engineering and Technology (IRJET) e ISSN:2395 0056
Volume: 09 Issue: 06 | June 2022 www.irjet.net p ISSN:2395 0072
study area. Approximately 10 km south of Matialli Fault the Chalsa scarp (Mohapatra, S. R. et al. 2012) is the regional identification of MBT (Srivastava, V., 2017) and attribute to the MFT (Nakata, T., 1989). To the southern edge of Garubathan recess, the MFT/HFT locally is recognized as Baradighi Fault (Mohapatra, S. R. et al., 2012)
Duarsformation(Matialymember)(Fig:3).BoththeMFT thrust sheet (the hanging wall) and the footwall show a litho geological structure of younger Quaternary deposits of Duars formation of the Matialy member group. All these lithotypes of geological formations are sequenced in two different types of sheets on the east and west sides of Chel River (Table:1). In the east, the Damuda Formation and Jalpaiguri Formation are absent andinthewesttheOldPleistoceneQuarternaryBoulder Bed is absent. South of MCT the Reyang Formation and Buxa Formation are un exposed and are covered under theGarubathanformation.
Fig: 2 Regionaltectonicsetting;
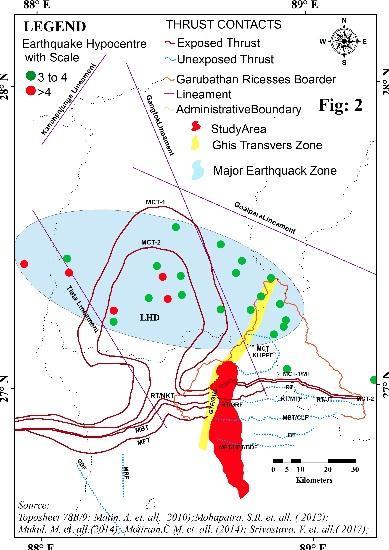
2.2. Geological Setting: Thestratigraphy ofthe Darjeeling SikkimHimalaya(Ray,S.,1947;Ghosh,A.M. N.1956;Acharyya,S.K.,1971;Ray,S.K.,1976;Acharyya, S. K. and Ray, K. K., 1977; Raina, V. K. 1976; Gangopadhyay, P. K. and Ray, S., 1980; Mukul, M., 2000; Bhattacharyya, K. and Mitra, G., 2009, Mitra, G. et al., 2010) also complex. The geology of the Chel Basin is structured by different tectonic thrust contacts such as MCT 1,MCT 2,RT,MBT,andMFT(Fig:2).Thegeological formations consist of only the lithotype of rocks. The MCT 1 thrust sheet contains Precambrian Proterozoic DarjillingGneissandtheMCT 2thrustsheetcontainsthe Paro Group of rock. The RT comprises different formationsi.e.,PrecambrianDalinggroupofGarubathan formation,PaleozoicUpperPermianGondwanagroupof Damuda Formation, Pleistocene Formation of an old quaternary boulder bed, the MBT thrust sheet is composed of Quaternary deposits of Jalpaiguri Formation, and the younger Quaternary deposits of
Fig: 3 GeologyoftheChelbasin;
Darjeeling Gneiss is composed of biotite muscovitegneissandmigmatitcquartz biotitegneissand forms a bedding plane at an angle of about 29° toward the north (Mohapatra, S. R. et al., 2012). Sometimes the bedding plains are impossible to identify. A strong gneissic foliation is found here. For this reason, the gneisses are pronto erosion. The foliation dip direction variesfromNEtoNW.The Paro Group of Rocks contains Ligntse Gneiss, Augen gneiss, Prophyritic granite gneiss. LikeMCT 1theserocksarealsotectonicallyfoliatedand thefoliationsaremostlyparalleltotheDalingformation of the Ramgarh thrust sheet. Garubathan Formation of the Deling group of rocks of the lower LHS (Mukul, M., 2000) isbest exposedaroundDalingFrontinDarjeeling Himalaya (Ray, S. K., 1976). It consists of phyllite, mylonitised phyllite, deformed phyllite, quartz chlorite biotiteschist,gneiss(Mohapatra,S.R.etal.,2012)
International Research Journal of Engineering and Technology (IRJET) e ISSN:2395 0056
Volume: 09 Issue: 06 | June 2022 www.irjet.net p ISSN:2395 0072
Table:1 (GeologicalSuccessionofGarubathanSurface) Geologic Time Stratigraph ic Unit
Rock Formation Geomorphi c Units Divisio n Eo n Era Period Epoch Westof Chelriver Eastof Chelriver
Precambrian Proterozoic
Postcambrian Phanerozoic
Darjeeling Gneiss Two micamigmatitic gneiss Greater Himalaya MCT-1 ParoGroup LigntseGneiss,Augen gneiss,Prophyritic granitegneiss MCT 2 Dalinggroup
Garubathan Formation Lesser Himalaya Un exposed ReyangFormation Un exposed BuxaFormation
Cenozoic (Alpine) Quarternar y Pleistocene Indo Gangetic Alluvial deposits Absent Old Boulder Bed
Himalayan foreland basin RT Paleozoi c Upper Permian Cisuralian Guadalupia n
Gondwana group
Jalpaiguri Formatio n
Damuda Formatio n Absent Lesser Himalaya Cenozoic (Alpine) Quarternar y Pleistocene Indo Gangetic Alluvial deposits
Duars Formation Himalayan foreland basin MBT DuarsFormation MFT DuarsFormation
Source: After Matin, A., and Mukul, M., 2010; Mohapatra, S. R. et. al., 2012, Field Survey
The Phyllites are sometimes become intercalated with Quartzite bands (Matin, A. and Mukul, M., 2010). The Daling Phyllite thrust over Pleistocene boulder gravel beds in the east of Chel river and thrust over Damuda formation in the west of Chel river (Fig:3). Damuda formation of the Gondwana group is consisting medium to coarse grain pebbly sandstone. Alternative layers of sandstoneandshalearefoundhere.Thecoalstreaksand lensoid carbonaceous shale are the remarkable characteristics of this part. The Pleistocene Formation of the old Quaternary Matali Member Group comprises a quaternary bolder bed is overlaying the Darjeeling gneiss and Phyllite layer. In some pleases the phyllite layer has been exposed to the surface. Jalpaiguri formation of Pleistocene age consists of sand, pebble, cobble and boulder beds. It is a semi consolidated Quaternary alluvial deposit on the west bank of Chel river. The alternative layer of gritty sand and boulder beds are a common occurrence here. Their sandy beds are mostly horizontal, which indicates the fluvial depositional environment rather than the tectonic
environment. Duars Formation of younger Quaternary Matali Member have a thrust contact with Old Boulder Bed of Quarternary Pleistocene Formation on the east bank of Chel River along Dudh Khola sections and has a thrust contact with Jalpaiguri Formation on the west bank of Chel Rive (Mohapatra, S. R. et al., 2012). It is composed of unconsolidated pebbles, cobbles, and bouldersin a brown colouredhighlyoxidizedsandysoil withtheweatheredhorizonandcappedbyredsoil.
The Siwalik section is absent in this recess becausetherecesshasledtoanewtransversestructure of GTZ at a high angle. The Ghish River presently flows through this transverse zone at the mountain front. The mountain front in the western part of this transverse fault is characterised by the Quaternary Siwalik deposit, whereas in the eastern part of a transverse fault the mountain front is defined by a thrust of Proterozoic DalingFormationofrock on Gondwana rocks.Thereare blind imbrications in the south of mountain fronts that form E W trending fault scarp. From north to south,
International Research Journal of Engineering and Technology (IRJET) e ISSN:2395 0056
Volume: 09 Issue: 06 | June 2022 www.irjet.net p ISSN:2395 0072
these scarps are arranged as MCT 1, MCT 2, RT, MBT, BT,andMFT(Fig:2).
TothesouthofMBT (Nakata,T.,1989) orRT(Matinand Mukul, 2010) the Siwalik belt is partly missing between the Chel and Pana Rivers where the Himalayan front
retreatsseveralkilometresnorthfollowingN Sdirected fault lines along the rivers Chel (Starkel, L., Sarkar, S., Soja, R. and Prokop, P., 2008; Mukul, M. et al., 2008; Mukul, M., 2010). Here the Siwalik belt is replaced by quarternary bolder and recent alluvium deposits.
Table: 2 (MorphometricTechniques)
Technique Description Source
AbsoluteRelief
Heightfrommeansealevel
Pareta,2011
RelativeRelief Heightfromlocalbaselevel Hamnowd 1954 and Thaver1955
DissectionIndex
AverageSlope
RelativeRelief/AbsoluteRelief DeSmet(1951)
tanθ = (C×I)/Wc. When: C = Average No of Contour crossing per unit area, I = Contour interval,Wc=636.6(Wentworth’sConstant)
RuggednessIndex Ruggedness Index = (Mean Relief Minimum Relief)/(MaximumRelief MinimumRelief).
Wentworth(1930)
Strahler(1964)
Area (sq.km)(Ab) SRTMDEM
Perimeter(km)(Pb) SRTMDEM Length(km)(Lb) SRTMDEM Width(km)(Wb) SRTMDEM
BasinShapeFactor(BSF) Lb/Wb Morisawa,1958
BasinEccentricity(Eb) (Lcm2 Wcm2)0.5/Wcm; Lcm=straight length of sub basin from the centre to mouth, Wcm=Width of sub basin at the centre of mass andperpendicularofLcm
ElongationRatio(Re) The ratio of a diameter (2r) of a circle of the same area of a basin to the maximum length (Lb)ofthatbasin
Black,1972
Schumm’s,1956
Lemniscate’svalue(K) Lb/4Ab)/ Chorley,1957
FormFactor(Rf) Ab/Lb Horton,1932
Basin Area & Basin Perimeter Co Relation
CircularityRatio(Rc) Ab/Ac; Ac= circle that bears the same perimeterofthebasin Miller,1953; Strahler,1964
Relativeperimeter(Pr) Actual basin area (Ab)/the actual basin perimeter Schumm,1956
CompactnessCo efficient(Cc) Pb/√2πAb; Basinarea=Abandbasinperimeter =Pb Horton,1932
Gravelius’sshapeindex(Kg) Pb/√(2&πAb); Basin area=Ab and Basin perimeter=Pb Musy,2001
Linear Aspects of the Stream Network
StreamOrder(U) Strahler,1952
StreamNumber(Nu) Totalcountoforderu Horton,1945
StreamLength(Lu) Totallengthoforderu Strahler,1964
MeanStreamLength(Lū) Nu/Lu Strahler,1964
StreamLengthRatio(RLu) Lun/(Lun 1) Horton,1945
Mean Stream Length Ratio (RLū) Lūn/Lūn 1 Horton,1945; Dingman,2009
BifurcationRatio(Rb) Nun/Nun+1 Schumm,1956, Dingman,2009
International Research Journal of Engineering and Technology (IRJET) e ISSN:2395 0056
Volume: 09 Issue: 06 | June 2022 www.irjet.net p ISSN:2395 0072
RhoCo efficient(Rc) RLū/Rb Horton,1945
Areal Aspects of the Stream Network
DrainageTexture(Dt) ∑Nu/Pb Horton,1945
TextureRatio(Rt) ∑N1/Pb Schumm,1956
StreamFrequency(Fs) Totalnumberofstreamsperunitarea(sqkm) Horton,1932,1945
DrainageDensity(Dd) Lengthofdrainageperunitarea(sqkm) Horton,1932
InfiltrationNumber(If) Fs*Dd Smith,1950; Faniran,1968
DrainageIntensity(Di) Fs/Dd Faniran,1968
WanderingRatio(Rw) Lu/Lb Surkan,1967
FitnessRatio(Rf) Lu/Pb Melton,1957
Actual Channel Length (km) (Cl)
SRTMDEM
Aerial Channel Length (km) (Acl) SRTMDEM
ActualValleyLength(km)(Vl) SRTMDEM
ArialValleyLength(km)(Avl) SRTMDEM SinuosityIndex(Si) Cl/Vl Miller,1968
ChannelIndex(Ci) Cl/Acl Miller,1968
ValleyIndex(Vi) Vl/Avl Miller,1968
StandardSinuosityIndex(Ssi) Ci/Vi Mueller,1968 Hydraulic Sinuosity Index (Hsi) (Ci Vi)/(Ci 1)*100 Mueller,1968
Topographic Sinuosity Index (Tsi) (Vi 1)/Ci 1)*100 Mueller,1968
The variation of geology, relief, morphometry and sedimentology is the result of neotectonic variation of the Chel basin. So the neotectonic variation of this basin is identified based on relief, morphometry and physical characteristics of sediment. The primary concept of geology and neotectonic of the study area is studied from different types of literature. In the field, various dimensions of geology, neotectonics and morphometry of terrain and drainage are identified, measured and perceived with the help of GPS (Garmin 550), compass, clinometer. To perceive the neotectonic intensityonlythegeomorphiccharacteristicsoftheriver terrace and physical properties like texture, the structureofsedimentaryfaciesareprimarilyobservedin thefield. Thisstudyis performedmainlybasedon relief and drainage morphometry, which is extracted and analyzedfromSRTM DEMdata andtopo sheet78B/9 of the survey of India with the help of GIS Software (Arc GIS, Map info and Quantum GIS) and Microsoft excel. Google Earth image is used to delineate the study area. Differentparameterslikeheight,areaandlength (Table: 2) are considered to measure the morphometry of the basin.
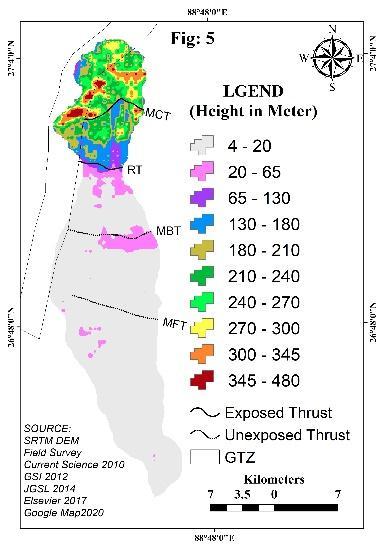
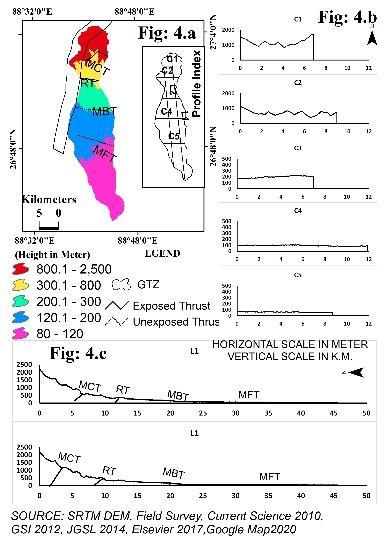
According to Smith, G.H. (1935), “relief is a concept intended to describe the vertical extent of landscapefeature,withoutreferencetoabsolutealtitude or slopes,” The long profiles L1 and L2 (Fig: 4c) show a prominentbreakinslopeateachthrustcontacti.e.,MCT, RT, MBT, and MFT. Based on break in slope the Chel basin is sub divided into five zones i.e. the mountain, upper fan, middle fan, lower fan and flood plain area (Fig: 3), which ranges between 800.1m to 2500m, 300.1mto800m,200.1mto300m,120.1mto200m,80m to120m(Fig:4a)andareidentifiedastectoniczoneone (I), two (II), three (III), four (IV) and five (V), respectively. The respective class widths of these relief zones are about 1700m, 500m, 100m, 80m, and 40m. Themeanandmeandeviationoftheclassesofthenorth surfaceofRTis1100mand600mrespectively.Whereas, they become 73.33 m and 22.22m respectively in the southernpartofRT.
Thereisaremarkableheightdifferencebetween theupperfanandmiddlefan,whichareseparatedbythe RT. The upper fan is about 300m 400m higher than the middle fan surface The upper fan is known as the Garubathan surface and the remaining southern surface
International Research Journal of Engineering and Technology (IRJET) e ISSN:2395 0056
Volume: 09 Issue: 06 | June 2022 www.irjet.net p ISSN:2395 0072
isknownastheRangamatisurface.ThecrossprofilesC1 toC5(Fig:4b)presentahighlyundulatingsurfaceinthe northofRTand a verylevelledandroughsurface inthe south of RT In the mountain area, the MCT is restricted by GTZ to its western edge (Fig: 2). Here the northern margin of the second zone crosses the MCT due to headward erosion of the river. But the MCT reduce headward erosion near GTZ. In the foothill plain, the MFTdiagonallycrossesthemarginofthefourthandfifth relief zone in the northwest to southeast direction. The fourth relief zone of the Chel basin has been tilted up to its western side and as a result, its southern edge extends southward beyond MFT. Like the fourth relief zone, the third zone also extends southward beyond MBT. But here the southern margin of this third zone is almostparallelwiththisthrustcontact.Thecrossprofile C3 shows an eastward elevated surface and the field observation also reveals the headward erosion at this placeofthethirdzone
The relative relief represents an index of the stage of development (Partsch, 1911) and the ratio between relative and absolute relief reveals the “dynamicpotential”ofthearea (DovNir,1957) Boththe stage of development and “dynamic potential” is importanttounderstandtheneotectonicvariationofthe area. The relative relief of the area ranges between 480 mto65mand65mto4minthenorthernandsouthern part of RT respectively (Fig: 5) Remarkably the highest value of relative relief zone of 345m to 480m is found nearGTZratherthanMCT NearRTandMBT,a patchof thesecond lowestrelativereliefzoneof20mto65mis observed.
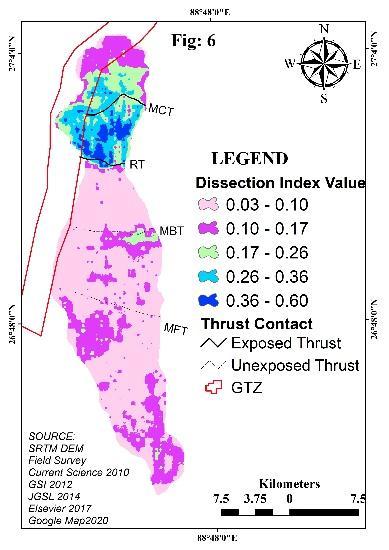
De Smet (1951) first used dissection index to explain the erosional condition of a surface, which depictsthedimensionoferosion(Dubey,1986),stageof development of a landscape (Singh & Dubey, 1994), basin dynamics and the stage of stream development (Nir 1957, Mukhopadhyay 1973, Barman, 1986). The dissectionindexvalueisrangedbetween0and1 (Davis,
1905) that stands for absence and maximum erosion, respectively (Raietal.,2017a & 2017b;Raietal.,2018). A high erosive nature of the centripetal tributaries of Chel River highly segmented the RT, which records the highest dissection index value (0.26 0.60) of the basin for its tectonic instability However, the MCT sheet is showingamoderatetoverylowdissectionindexof0.03 to 0.26. All the surfaces in the south of RT dominate a verylowvalue(0.03 0.10)ofdissectionindex.Butsome pockets (Fig: 6) of this surface near MBT and MFT are dominated by moderate to a low value (0.10 0.26) of dissectionindex.
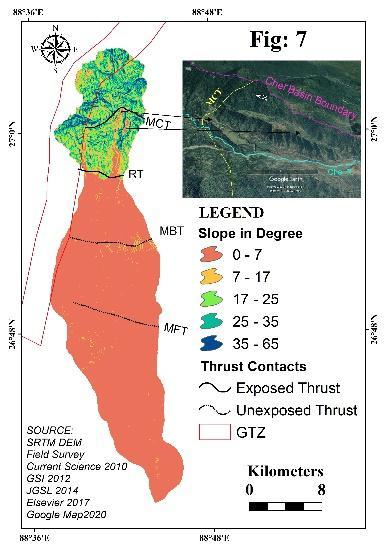
Active neotectonics control slope processes (Jaboyedoff, et al., 2011). Five respective zones of slope (Fig: 7) are observed In the south of RT, the alluvial surface is showing the slope of 1° 7°. However, at the middle eastern part of this alluvial surface along with MBT, a patch of the area shows steep slopes which are aligned in a north south direction and ranged between 7° 17°.NearMCT,twolittleandelongatedpatchesofthis slopezoneareorientedinanorth southdirectiononRT sheet (Fig:7) in the eastern bank of Chel river, where moderate (17° 25°) to high (25° 35°) steepness is the generalcharacteristicsofthisarea.Thefieldobservation identifies this surface is a river terrace. MCT sheet showingthemaximumsteepnessof25° 65°.
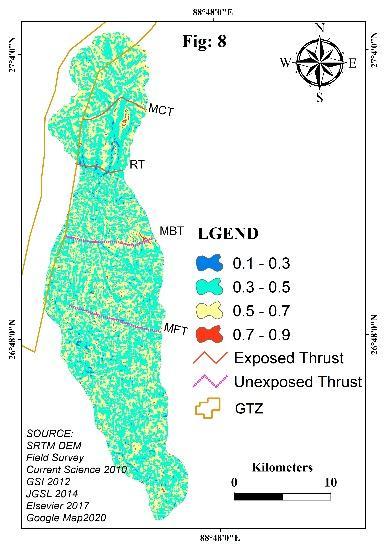
Strahler (1964) calculated the ruggedness index that is closely related to different morphometric characteristics i.e., slope, dissection index, and drainage texture and drainage density of geomorphic surface(Hook 1955, Mukhopadhyay 1973, 1977, 1978a, 1978band1979c) Ahighvalueofruggednessindexnot only depends upon slope steepness but also depends uponthelengthofthesteepslope. However,theslopeis the function of neotectonic instability (Jaboyedoff, et al., 2011). Ruggedness Index is uniform (Fig: 8) throughout the basin area and ranges between 0.3 0.7. But a little patch of low value ranging between 0.7 0.9 is observed intheeasternpartofMBT.
Fig: 4 Reliefmap; Fig: 5 Relativereliefmap; Fig: 6 Dissectionindexmap; Fig: 7 Slopemap; Fig: 8 Ruggednessindex map; Fig: 9 Geomorphicsurfaceandriverterraceofthestudyarea; Fig: 10 Flowdirectionmap; Fig: 11 Orderwisesub basinsofthestudyarea;Fig:12 Streamorderofthestudyarea.
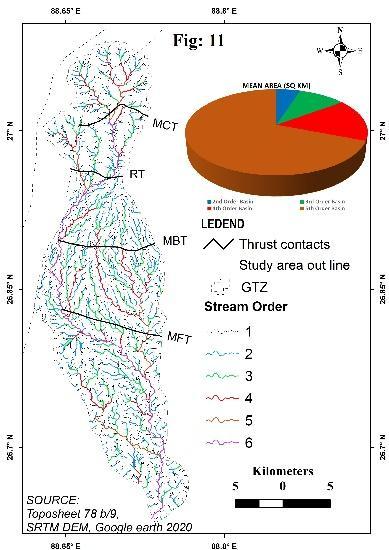
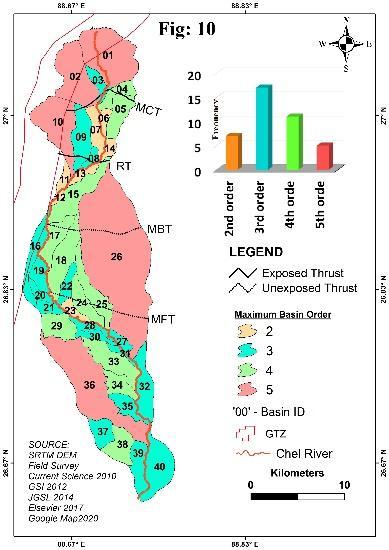
Basedon reliefanddrainage,theChel basinhas been divided into forty sub basin (Fig: 10), which represents a sub system within a major system of the stream network. All the sub basins except No 26 are accommodated within thrust contacts in the study area Fourtypesofsub basini.e., 2nd,3rd,4th and5th orderare identified in the study area (Fig: 10) The order wise frequencyofthesub basinis7,17,11and5respectively.
In the tectonic zone I, II, III, IV and V the respectivefrequenciesofthe5th orderbasinare2,1,0,0, 1;4th orderbasinsare0,2,1,4,4,3rd orderbasinare1,2, 0, 3, 11 and the 2nd order basin are 0, 3, 3, 0, 1. The 4th , 3rd and2nd orderbasinscoverabout8.56sq.km,5.29sq. km and 2.68 sq. km mean area, respectively. The 5th ordersub basincoversabout20.80sq.kmmeanareain themountainsurfaceand85.19sq.kmmeanareainthe fansurface.Remarkablethat,inthe
Table: 3 (AspectsofDrainageBasin)
Area (sq.km) (Ab) 47.19 15.73 48.04 6.86 18.9 3 4.73 46.65 7.77 130.14 7.66 Perimeter(km) (Pb) 52.51 17.5 91.34 13.05 51.3 12.82 109.7 18.29 253.47 14.91
International Research Journal of Engineering and Technology (IRJET) e ISSN:2395 0056
Volume: 09 Issue: 06 | June 2022 www.irjet.net p ISSN:2395 0072
4
Length(km) (Lb) 19.04 6.35 37.45 5.35 21.9 1 5.48 47.92 7.99 96.66 5.69
Width(km) (Wb) 12.21 4.07 14.39 2.06 5.55 1.39 11.31 1.89 36.54 2.15
Lengthfromcentre tomouth(km) (Lcm) 9.42 3.14 22.08 3.15 10.7 4 2.69 23.1 3.85 50.06 2.94
Widthfromcentre andperpendicularto length(km) (Wcm) 4.3 1.43 5.72 0.82 2.11 0.53 3.9 0.65 16.37 0.96
BasinShapeFactor (BSF) 6.47 2.16 19.18 2.74 17.2 6 4.31 27.14 4.52 52.18 3.07
BasinEccentricity Eb(τ) 7.57 2.52 28.18 4.03 19.1 1 4.78 35.19 5.86 67.54 3.97
Diameterofthe circlethatbearsthe sameareaofthe basin(m) (2r) 12656 4218. 7 19096 2728 8813 2203 18524 3087 48406 2847. 4
ElongationRatio (Re) 1.93 0.64 3.64 0.52 1.61 0.40 2.5 0.42 9.26 0.54 Lemniscate’svalue (K) 2.91 0.97 8.54 1.22 8.12 2.03 13 2.17 23.09 1.36 FormFactor (Rf) 1.04 0.35 1.5 0.21 0.52 0.13 0.86 0.14 4.43 0.26
Areaofthecircle thatbearsthesame perimeterofthe basin(sq.km) (Ac) 77.92 25.97 111.1 0 15.87 64.8 0 16.20 173.7 6 28.96 397.91 23.41
CircularityRatio (Rc) 1.65 0.55 3.07 0.44 1.22 0.31 1.91 0.32 6.76 0.4 Relativeperimeter (pr) 2432. 1 810.7 3153 450.4 1197 299.3 2529. 4 421.6 7461.5 438.9 1
Compactness Co efficient (Cc) 5.89 1.96 15.07 2.15 10.3 8 2.6 15.75 2.62 39.62 2.33 Gravelius’sshape index (Kg) 8.33 2.78 21.32 3.05 14.6 8 3.67 22.27 3.71 56.03 3.3
0.00 Heighest value, 0.00 Lowest value
southofRT,mostofthe3rd and4th ordersub basinsare arranged in the western and eastern bank of the river Chel, which are highly elongated. Alternatively, in the mountainsurfaceinthenorthofMCT,the5thordersub basins (No 1, 2) are circular and between MCT and RT sixsmall(6.86sq.kmmeanarea)sub basins(No 5,6,7, 8, 9 and 14) with their maximum order of 2 to 4 are developed. In this region, only one 5th order sub basin (No:10)islocatedoverGTZ.
The Ab, Pb, Lb, Wb, Lcm, Wcm (Table:3)arethe basic linear properties of the sub basins. Ab, Wb and Wcm show their maximum mean values in the north of MCT, whereas the maximum mean values of Pb, Lb and Lcm arerecordedbetween MBTandMFT.Except for Lb, all other minimum values are recorded in the RT MBT zone and the zone of MCT RT records the minimum Lb
value.Neotectonicisafactoofco relationbetweenbasin properties. To understand the co relation between Length, width & Area the BSF, Eb, Re, K and Rf and between Area & Perimeter the Rc, Pr, Cc and Kg of sub basinsarecalculatedinthedifferenttectoniczoneofthe study area (Table: 3). Neotectonics controlled all these properties that depict the shape and slope conditions of theChelbasin
Elongated sub basins are tectonically active (Lari, A. A. et al.; 2016). Cease of tectonic upliftment gradually forms the sub basin in a circular shape (Burbank, D.W. and Anderson, R.S. (2001) The range of Re values from 0 to 1 is grouped into <0.7, 0.7 0.8, 0.8 0.9 and >0.9, which refers to elongated, less elongated, oval and circular basin shapes, respectively (Strahler, 1964). This value is related to relief and slope (Molin et
International Research Journal of Engineering and Technology (IRJET) e ISSN:2395 0056
Volume: 09 Issue: 06 | June 2022 www.irjet.net p ISSN:2395 0072
al.2004).Thevalueof1isassociatedwithlowreliefand the value from 0.6 to 0.8 is observed in the high relief zone (Strahler, 1964). Inthe north of MCT, in mountain area, sub basin 1, 2 and 10 are showing 0.83, 0.68 and 0.55 Re values, which are oval and elongated shape respectively (Table:3) and between MCT and RT the range of Re value from 2.14 to 4.9 present the highly elongated sub basins. In the south of RT, instead of low relief(80mto300m)andlowslope(0°to7°),themean Re values between 0.2 and 0.5 represent the elongated sub basin.Fieldsurveyrevealsthatthesesub basinsare developed on the tectonic terraces that are aligned in a north south direction implies the impact of GTZ. The value of K, which depicts slope conditions (Chorely, 1957),isdirectly proportional to theelongatedshapeof a basin. The range of Rf value becomes 0 to 1, which indicates an elongated (Rf=0) and circular (Rf=1) basin shape (Rai, P. K. et al.; 2019) Lower the BSF value indicates higher circularity and stable tectonic conditions The BSF values >4, 4 3 and <3 refers to tectonically active, semi active and inactive conditions (Hamdouni,R.etal.,2007) Tectoniczoneoneshowsthe maximum mean value of Re and Rf, and the minimum
mean value of BSF, Eb and K. The RT MBT zone records the minimum mean value of Re and Rf. Zone MBT MFT recordsmaximummean BSF, Eb and K value(Table:3).
The Rc value varies from 0 to 1 and is directly related to the basin circularity (Miller, 1953) In the studyarea,thisvalueisrecordedbetween0.17and0.73. Out of forty sub basins twenty two (above 50%) sub basin records Rc value from 0.1 to 0.39, ten sub basins record the value between 0.40 and 0.50, six sub basins record the value between 0.50 and 0.58 and only two basins record the value above 0.70 (Table: 3). All these phenomena support the elongated nature of most of the sub basin.Overall,above70%sub basin(No 32)appear as highly elongated (Rc <0.50). The mean value of Pr graduallyincreasesfromMCTtoMFTandafterMFT,the value again increases in the south (Table:3). Cc is an indicator of slope (Rai et al., 2017a & 2017b; Rai et al., 2018), which gradually increases from north to south with the decreasing of slope. Like the circularity ratio, the Kg value alsoannouncesthe elongated nature ofthe sub basins. The increasing value also mentions the increasingnatureofelongationofthesub basins.
Rb
1.20 1.00 0.80 0.60 0.40 0.20 0.00
R Lu Neotectonic Zone
RLu 2/1
R Lū
Fig:13.a 0.00 1.00 2.00 3.00 4.00 5.00
North of MCT MCT- RT RT-MBT MBT-MFT South of MFT
RLu 3/2
RLu 4/3 RLu 5/4 Mean Linear (Mean)
Fig:13.c 0.00 0.05 0.10 0.15 0.20 0.25 0.30 0.35
North of MCT MCT- RT RT-MBT MBT-MFT South of MFT
Neotectonic Zone
Rb 1/2
Rb 2/3
North of MCT MCT- RT RT-MBT MBT-MFT South of MFT
Neotectonic Zone
RLū 2/1 RLū 3/2 RLū 4/3 RLū 5/4 Mean Linear (Mean)
Fig:13.d
Fig:13.b 0.00 1.00 2.00 3.00 4.00 5.00 6.00


Rc Neotectonic Zone
North of MCT MCT- RT RT-MBT MBT-MFT South of MFT
Rc 1_2


Rc 2_3

Rb 3/4
Rb 4/5 Mean Linear (Mean)

Rc 3_4 Rc 4_5 Mean Linear (Mean)
Fig: 13.a: DistributionofRbinthedifferenttectoniczone, Fig: 13.a: DistributionofRcinthedifferenttectoniczone.


Fig:13.a: DistributionofRluinthedifferenttectoniczone, Fig: 13.b: DistributionofRLūinthedifferenttectoniczone, the tectonic variation of the surface under study. The main river Chel attains the highest order (U) of 6 near MCT(Fig:11)

Stream networks, which transport eroded materialofbasinsurfacefromupslopetodownslope,are linear properties of a drainage basin. U, Nu and Lu are thebasiccomponents,whichdirectlyorindirectlydepict

Table: 4 (AspectsofStreamNetwork) NorthofMCT MCT RT RT MBT MBT MFT SouthofMFT StreamProperties Sum Mean Sum Mean Sum Mean Sum Mean Sum Mean Linear Aspects Or de
1 Frequency(Nu1) 312 104 321 46 104 26 273 46 855 50 Lengthinkm(Lu1) 86.8 28.93 83.75 11.96 36 9 79.83 13.3 237.45 13.97 MeanLengthinkm(Lū1) 0.28 0.28 0.26 0.26 0.35 0.35 0.29 0.29 0.28 0.28 Or de r 2 Frequency(Nu2) 72 24 91 13 25 6 52 9 198 12 Lengthinkm(Lu2) 32.27 10.76 34.13 4.88 19.59 4.81 38.12 6.35 106.45 6.26 MeanLengthinkm(Lū2) 0.45 0.45 0.38 0.38 0.78 0.78 0.73 0.73 0.54 0.54 Or de r 3 Frequency(Nu3) 20 7 9 1.10 5 1 11 2 43 3 Lengthinkm(Lu3) 10.84 3.61 16.38 2.34 7.33 1.83 27.64 4.61 52.08 3.06
International Research Journal of Engineering and Technology (IRJET) e ISSN:2395 0056
Volume: 09 Issue: 06 | June 2022 www.irjet.net p ISSN:2395 0072
MeanLengthinkm(Lū3) 0.54 0.54 1.82 1.82 1.47 1.47 2.51 2.51 1.21 1.21
Order 4 Frequency(Nu4) 6 2 4 1 1 0 3 1 7 0 Lengthinkm(Lu4) 14.94 4.98 5.51 0.79 5.72 1.43 10.57 1.76 14.8 0.87
MeanLengthinkm(Lū4) 2.49 2.49 1.38 1.38 5.72 5.72 3.52 3.52 2.11 2.11
Order 5 Frequency(Nu5) 2 1 1 0 0 0 0 0 1 0 Lengthinkm(Lu5) 5.04 1.68 5.87 0.84 0 0 0 0 10.13 0.6
MeanLengthinkm(Lū5) 2.52 2.52 5.87 5.87 10.13 10.13
TOTAL Frequency(NuT) 412 137 426 61 135 34 339 57 1104 65 Lengthinkm(LuT) 149.9 49.97 145.64 20.81 68.64 17.16 156.16 26.03 420.92 24.76
MeanLengthinkm(LūT) 0.36 0.36 0.34 0.34 0.51 0.51 0.46 0.46 0.38 0.38
DrainageTexture(Dt) (Number/km) 6.96 4.09 1.98 3.01 3.66 TextureRatio(Rt)(Number/km) 5.29 3.05 1.53 2.42 2.82 StreamFrequency(Fs) (Number/sqkm) 8.07 9.34 6.08 7.1 8.17
DrainageDensity(Dd)(km/sq km) 2.88 3.00 3.25 3.30 3.17 InfiltrationNumber(If) 60.36 37.82 13.72 21.56 30.74
DrainageIntensity(Di) 0.003 0.003 0.002 0.002 0.003 WenderingRatio(Rw) 7.32 3.33 2.44 3.29 3.96 FitnessRatio(Rf) 2.52 1.36 1.03 1.4 1.41 0.00 Heighest value, 0.00 Lowest value
A stable environment provides the inverse relation of Nu and Lu with relief and U, and the direct relation of Lū with U (Horton, 1945) Climate or neotectonics distort these co relations. In the geomorphicsurfaceunderstudy,therecordedminimum value of Nu and Lu of all order (U) in the RT MBT zone (Table:4)thatpointoutthedistortionofthisnormalco relation.Thestretchingofthe26th sub basinovertheun exposed thrust contacts of MBT and MFT (Fig: 10) argued for longtime climatic stability. This climatic stability advocate for neotectonic instability that causes such distortion of stream network in this area. In this neotectonic zone, the presence of the highest value of Lū1 with the lowest value of Nu1 and Lu1 (Table: 4) signifies the development of long 1st order streams (Strahler, 1964) that accelerates the intensity of permeabilityandinfiltration (Chitra et al.,2011) A field study reveals that a coarse texture (unsorted boulder deposits with colluvium), which is the outcome of RT neotectonics, is responsible for this type of stream network TheRTupliftmentrestrictedthepropagationof the upper fan surface and resultant the deposition of coarse gravel in this area. The absence of the 5th order stream in the low relief zone (between RT and MFT) (Table:4)highlighttheunstablenessofthisarea.
The RLu is an indicator of the stage of development of any geomorphic surface (Pareta, K and Pareta, U., 2011). Gradual decreasing of RLū value from oneordertothenextordersignifiesthelateyouthstage of geomorphic development (Singh and Singh, 1997) In
a geomorphic surface, the tilted steep sloped area records higher RLu and RLū values. A remarkably lower value of RLu and RLū of RT MBT zone than its southern low relief zone (after MBT) (Fig:13.a & 13.b) argued for rejuvenationofthisarea.The Rb isinverselyrelatedto U (Strahler, 1964) in a stable tectonic environment This co relationdoesnotmatchbetweenMCTandMBTinthe study area (Fig: 13.c) Geology and lithology (Fig: 3) is responsible for this anomaly (Strahler, 1964; Chow, 1964; Verstappen, 1983; Rai et al., 2014; Singh et al., 2013). The recorded lowest Rb value between RT and MBT (Fig: 13.c) is the lesser effect of structural control (Strahler,1964;Verstappen, 1983) onthisarea than the MCT RTzone.TheareainthenorthofMCTandsouthof MBTshowsthatthe Rc isdirectlyrelatedto the U ofthe area, which is normal (Fig: 13.d). But the area between MCT and MBT is showing an inverse correlation (Fig: 13.d)
Dt is the expression of spacing of stream channels (Singh, 1980), which vary in Rt under differential lithology, infiltration capacity and relief aspectofthesurface(Raietal.,2017a&2017b;Raietal., 2018) Higher Fs refers early stage of land development orrejuvenationofanerosionalsurface(Singh,1980). Dd defines rupturing of topography in a neotectonic environment(Ritter,D.F.,etal.,1995).The If, Di, Rw and Rf help to perceive the variation of infiltration, the intensity ofsurface runoff, shifting nature of the stream, andtopographicfitness(Raietal.,2017a&2017b;Raiet al., 2018), respectively, of the Chel basin under variable
International Research Journal of Engineering and Technology (IRJET) e ISSN:2395 0056
Volume: 09 Issue: 06 | June 2022 www.irjet.net p ISSN:2395 0072
litho structural control. In the study area, the concentration of the highest value of all these areal componentsofthestreamnetwork(Table:4)designates the variation of active litho structural control over surfacehydrologyinthistectoniczone.
There is a prominent signature of neo tectonics along the main flow path of the river Chel. The river terrace, incised channel and meandering are the imprints of tectonics impacts. A field study reveals that near MCT four river terraces and near RT five river terraces (Fig: 9) are identified in the field. The upper terrace (No 5) is composed of a clast supported gravely boulder bed. The clast size gradually decreases to its
lowerterraces.Thelowerterracesgraduallybecomerich inamatrix.InthesouthofRT,theupperterracesstretch across MBT.All theterraces losetheirheightandmarge withfloodplainattheirsouthernedge.
Length of Cl, Acl, Vl and Avl are the primary properties that determine channel sinuosity The lower value of the sinuosity index is inversely related to tectonic stability (Jabbari, N., et al., 2012) To determine the variation of tectonic impact the main channel flow path has been divided into several segments based on the Muller (1968) concept and different indexes (Table: 5) are calculated. Sinuosity indexes of this river are recorded maximum either in the north of MCT or in the southofMFT.
Table: 5 (AspectsofChelRiverChannel)
Description
ActualChannelLength(km) (Cl)
TectonicZone North of MCT MCT RT RT MBT MBT - MFT South of MFT
8.70 9.06 9.10 8.62 31.25
AerialChannelLength(km) (Acl) 6.83 7.55 8.09 7.15 24.30
Components
ActualValleyLength(km) (Vl) 8.76 9.77 8.82 8.67 27.73
ArialValleyLength(km) (Avl) 6.72 7.62 7.91 7.14 23.39
Co relations
SinuosityIndex(Si)
0.98 0.94 1.01 0.99 1.09
0.99 0.93 1.03 0.99 1.13 ChannelIndex(Ci) 1.27 1.20 1.12 1.20 1.29 ValleyIndex(Vi) 1.30 1.28 1.12 1.22 1.19 StandardSinuosityIndex (Ssi)
HydraulicSinuosityIndex (Hsi) 11.08 41.08 7.71 5.19 35.23
TopographicSinuosityIndex (Tsi) 111.08 141.08 92.29 105.19 64.77
0.00 Highest value, 0.00 Lowest value
In the Himalayan region, a common phenomenon is that the northern thrust sheets are laying over the southern thrust sheet. But near MCT the Garubathan formation has been thrust over Darjeeling Gneiss from the south (Fig: 14.g) Near the Garubathan market at RT, the underlying scale like foliated phyllite rock of Garubathan formation has been warp upward and its old quaternary deposit thrust over phyllite rock from the north (Fig:14.e) Frequent repetition of the clast supportedlayerandthematrix supportedlayersis a general character in the south of RT. The clast supported boulders are deposited over matrix
supported sand deposits near RT (Fig: 14.h) and MBT (Fig: 14.i). The facies near RT records two boulder beds where near MBT it shows only one boulder bed. The distal part of the alluvial fan stores the fine sediments. Beyond the fan surface, in flood plain area the boulder facies (Fig: 14.f) is also observed Based on the ‘B’ axis orientationofboulderclaststhefandiagramshavebeen constructed, that depict the duration of different directions of streamflow (Fig:14.b, 14.c & 14.d). The river Chel changes its flow direction from south east to south westnearRT(Fig:14.b),fromsouth easttosouth near MBT (Fig: 14.c) and from south west to the south (Fig:14.d)inthefloodplainarea.

TheimpactofMCT,RT,MBT,MFTandGTZover reliefanddrainagemorphometryisnotuniformallover the Chel basin. The parallel situation of the thrust contacts with the relief zone (Fig: 4.a) indicates a balancing nature of them within the basin area. But the variation of mean and mean deviation of the relief classesbetweenbothsidesoftheRTsignifiesadominant role of the RT to develop this Chal basin than the other thrust contacts of the area. The presence of a break in slope,thevariationoflithologyandreliefbetweenupper and middle fan area argues for the up thrusting of RT and formation of northward slanting Garubathan surface, which is not normal. Because the regional slope of the basin is southward. However, the headward erosion near MCT indicates its activeness, but the low intensity of the headward erosion to its western edge advocatesforthehighereffectofGTZonreliefthanMCT in this part of the mountain area. This part of the mountain area is the footwall of GTZ, which decreases relief of the surface and resultant low intensity of headwarderosion.ThediagonallocationofMFTwiththe southern margin of relief zone IV proves that the GTZ dominates over the MFT in the western margin of the lower basin area to control relief conditions. Like mountainarea,thispartofthestudyareaisafootwallof the GTZ decrease surface height, which causes the extension of the relief zone IV through deposition and
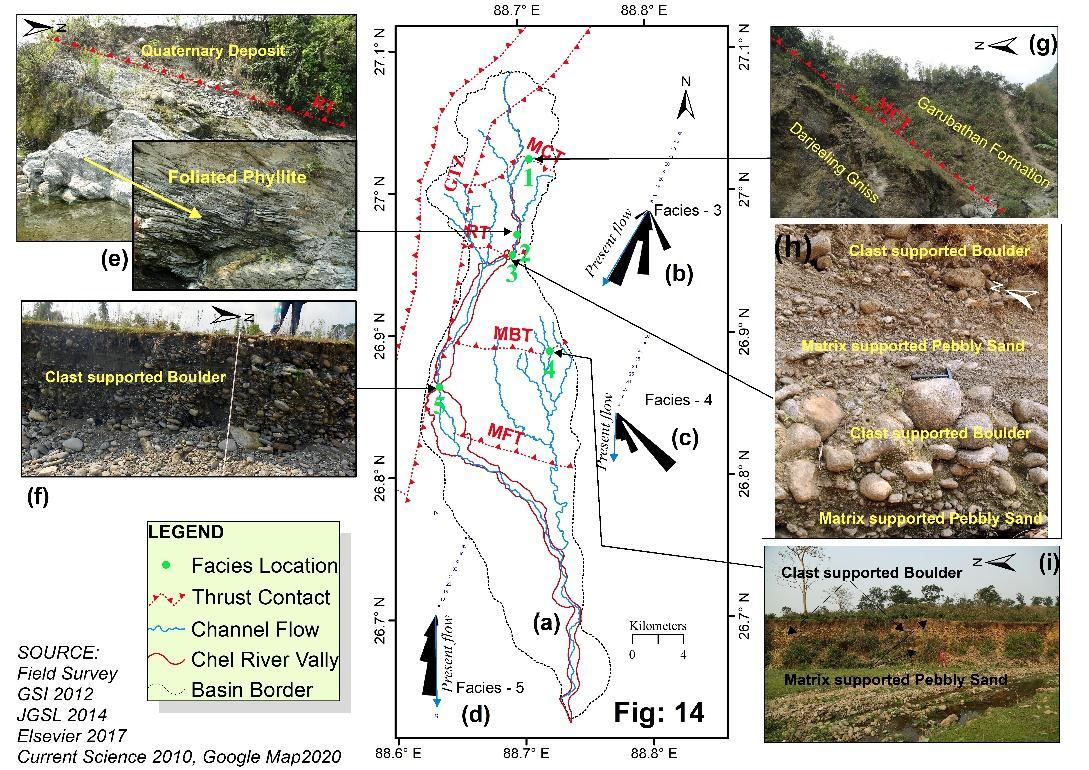
Fig 14.a: Location of facies in the different tectonic zone of the study area; Fig 14.b: Fan diagram of the facies No 3 that showing shifting of stream flow direction from southeast to south west; Fig 14.c: Fan diagram of the facies No 4 that showing shifting of stream flow direction from southeast to south; Fig 14.d: Fan diagram of the facies No 5 that showing shifting of stream flow direction from southwest to south; Fig 14.e: RT thrust contact; Fig 14.f: Clast supported boulder deposits; Fig 14.g: MCTthrustcontact; Fig 14.h: Alteration of boulder and sand facies near RT due to neotectonic effects; Fig-14.i: Alteration of boulder and sand facies near MBT duetoneotectoniceffects
cross the MFT. Alternatively, the presence of headward erosion in the eastern side of the third relief zone advocatesfortiltingup(Fig:4.b.c4)oftheareaduetothe reactivationofMBT.
A great difference between relative relief of the mountain surface from its southern alluvial plain refers to the high controlling nature of RT over relative relief. Presence of the highest relative relief zone near GTZ in themountainareaadvocatesfordominationofGTZover MCT. The distribution of dissection index values implies that the RT sheet is erosive than the other part of the mountain area, which means that, presently this sheet supplies major sediments to the lower basin area. The presence of a patch of relative relief (20m 65m), slope (7° 17°),ruggednessindex(0.7 0.9)anddissectionindex (0.10 0.26) zone near MBT refers to its reactivating nature.
Materials that are produced in headward erosion,aredepositedinthedistallobeofthealluvialfan of the Chel basin. Thus, MBT plays a significant role in the alluvial fan expansion in the study area. The river terraces near MCT refer to its neotectonic activities. Thrustalup warpingofRTsheet(Fig:3)nearGrubathan market reduce slope (1° 7° ) and resultant widening of Chal valley. The absence or negligible break in slope at MFT and MBT advocates less tectonic control of these thruststhanotherthrustcontacts(MCT,RT)ofthestudy area.
International Research Journal of Engineering and Technology (IRJET) e ISSN:2395 0056
Volume: 09 Issue: 06 | June 2022 www.irjet.net p ISSN:2395 0072
The heterogenic impact of tectonic movements segregates the basin surface into forty sub basins. But, stretching of sub basin 4, 24 and 26 across MCT, MFT, and MBT, respectively, direct the domination of geomorphicprocessesovertectoniccontrolinthosesub basin areas. The development of a higher order basin becomes possible in a relatively stable tectonic environment (Horton,1945). The maximum no of 3rd ordersub basinreferstoa highdegreeofsegregationof theChelbasininahighlyunstabletectonicenvironment (Horton,1945). InthesouthofRT,ahighlycompressive nature of GTZ arrange the highly elongated 3rd and 4th order basin in both sides of the Chel river bank and its negligible effect causes the development of a vast and extensive5th ordersub basin(No:26)intheeasternpart of the fan area. Alternatively, in the north of RT, the negligible effect of GTZ and MCT develops a relatively circular 5th order basin. But, between MCT and RT, the development of small sub basins refers to RT neo tectonics.
The distribution of the maximum values of Ab, Pb, Lb, Wb, Lcm and Wcm (Table: 3) also support the relativelyhigherneo tectonicactivenessofzoneIIIthan zone I (Table: 3). The circular basin shape is developed relatively in a stable tectonic condition than the elongated shape. Basin shape has a direct impact on the pic discharge of a stream. The highest pic discharge withinashortperiodisgreaterincircularshapethanthe elongated shape (Morisawa, 1958; Wisler, C.O. and Brater, B.F. 1959; Gray, D. M. 1970; Bedient, P. B. et al. 1992) Thus,tectonicsindirectlycontrolbasinprocesses likepicdischarge,surfacerunoff,erosion,whichcontrols thebasinmorphometry.
Distribution of BSF, Eb and Rf value refers to high tectonic pressure of GTZ that forms elongated sub basins in zone IV and its relatively stable tectonic condition forms a circular sub basin in the zone I. Distribution of K value refers to the tectonic stability of theChelbasintoitsnorthernandsouthernmargin.Inan unstable tectonic environment, the steep slope and high relieftendthebasintowardhigh Re valueandvice versa (Jaboyedoff,etal.,2011).Inthestudyareapresenceof a circularsub basin(Re isnearto1)inthemountainarea andelongatedbasin(Re is<0.6)inthealluvialandflood plain area refers to the inactiveness of the MCT and active neo tectonics of the GTZ. The same area may contain different lengths of perimeter due to the variationofgeometricshape,whichistheimprintofthe neo tectonics of that area. The values of Rc and Kg indicate that the highly elongated sub basins of the region is experiencing high tectonic movement. The valueof Pr and Cc announcethatthetectonicpressureof
this region gradually increases from north to south and decreasesinthesouthofMFT.
The development of a drainage network is the combined effect of climate, geology and neo tectonics. The entire study area falls in the monsoon climate Tectonicthrustsprovidegeologicalhomogeneitytotheir north and south margins in the study area (Fig: 3). The variation of drainage networks in different parts of the same thrust zone advocates for higher domination of neotectonicthangeologyandclimateoverdrainage. The tectonic controls the drainage morphometry directly by controlling basin morphometry and indirectly by controlling the distribution of geological formations, relief and slope. The highest order of stream implies tectonic stability for a long time and vice versa (Horton,1945).Sothedevelopmentof5thordercircular sub basin (1, 2 &10) refers to the tectonic stability of MCT. A low area of the highly elongated 3rd and 4th ordersub basinsindicatesthehighcompressiveforceof theGTZ. The distributionof 2ndordersub basins refers totheRTneotectonics.Co relationsofthetectoniczone, Nu, Lu and Lū indicate the tectonic instability produced by GTZ. The distribution of RLu, RLū, Rb, Rc in the Chel basin is showing the tectonic instability between MCT and MBT. The concentration of the highest mean values of Dt, Rt, If, Rw, and Rf refers to the tectonic stability of the MCT, and the concentration of their minimum mean valueintheRT MBTtectoniczonereferstothepresence ofneo tectonicactivityinthisarea.
Frequent changes in the flow direction reveal thechangingnatureofthedirectionofneotectonicforce neat the thrust contacts. A sedimentological study depictsthatthechangeofflowdirectionfromsouth east to the south west (Fig:14.b), from south east to south (Fig:14.c) and from south west to the south (Fig:14.d) are the neotectonic effect of RT, MBT and GTZ, respectively. The highest frequency of the river terraces near RT refers to its more neo tectonic activeness than MCT. The lithological texture and internal organization of the upper terrace prove its development in the first phase in a neo tectonic environment. The consequential development of river terraces is attributed to the series effect of tectonic movement in the study area. On the south of RT, the development of river terraces across MBT and MFT refers to the impact of GTZ from the westernmarginoftheChel basin.Thesinuosityindexof the Chel flow path indicates the negligible or absence of MFTneo tectonics.
International Research Journal of Engineering and Technology (IRJET) e ISSN:2395 0056
Volume: 09 Issue: 06 | June 2022 www.irjet.net p ISSN:2395 0072
The structurally uncommon thrusting of Garubathan formation over Darjeeling Gneiss (Fig:14.g) indicates the higher compressive nature of TR neo tectonic than MCT. Near Garubathan market the highly scale like foliated phyllaite of Garubathan formation reveals the gradual increasing pressure of neo tectonics fromnorthtosouththatadvocatesforthedominationof RT neotectonics over MCT neo tectonics. The rounded foothill boulders are either glacial or fluvial origin and the angular boulders are of tectonic origin (Basu, S.R., Sarkar, S., 1990). However, frequent effects of neo tectonics cause the repetition of angular boulder layers inthesouthofRT.Thehighfrequencyofangularboulder facies near RT, reveals its activeness during the formation of the middle fan area. The angular boulder depositswithfinesedimentsinthefloodplainareaimply the tectonic instability of the catchment area that suppliestheboulders,whicharetransportedunderhigh streamcompetencyduringtherainyseason
The overall observation depicts the tectonic variation in the Chel basin. Analysis shows that the RT andGTZdominateovertheMCT,MBTandMFTtoattain this morphometry of this basin. The prominent break in slope, presence of highly foliated phyllaite and a great relief difference between upper and middle fan areas arguedforactiveRTneo tectonics.Thehighlyelongated nature of the small sub basin advocatesfor active neo tectonicpressureoftheGTZfromthewesternmarginof the area. The presence of relatively large and higher ordercircularsub basinsshowtheinactivenatureofthe MCTandMBTinthemountainandfanarea,respectively. The sinuosity index indicates the inactive neo tectonics of the MFT in the flood plain area. But, the presence of headword erosion sought for the reactivating nature of theMBTinthestudyarea.
1) Acharyya, S.K., (1971). Structure and stratigraphy of the Darjeeling Frontal zone, eastern Himalaya. In: Recent geological studies in the Himalaya, Geological Survey of India Miscellaneous Publication24(1),71 90.
2) Acharyya, S.K., Ray, K.K., (1977). Geology of the Darjeeling Sikkim Himalaya. Guide to Excursion No.3,FourthInternationalGondwanaSymposium (Calcutta).GeologicalSurveyofIndia,1 25.
3) Basu, S.R., Sarkar, S., (1990). Development of alluvial fans in the foothills of the Darjeeling Himalayas and their geomorphological and
pedological characteristics. In: Rachocki, A.H., Church,M.(Eds.),Alluvial Fans:AFieldApproach. Wiley.
4) Beasom, S. L., E. P. Wiggers, and R. J. Giordono. (1983). A technique for assessing land surface ruggedness. Journal of Wildlife Management 47:1163 1166.
5) Bedient, P. B. and Huber, W. C. (1992). Hydrology andFloodplainAnalysis(SecondEdition).Addison WesleyPublishingCompany,NewYork.
6) Bhattacharya, S., (2004). Evolution and CharacteristicsofAlluvial FansattheFootHillsof theDarjeelingHimalayas,PhDThesis,Department of Geography, University of Calcutta, Kolkata, 17 20, Accessed Library, Department of Geography, VivekanandaCollegeforWomen,Kolkata.
7) Bhattacharyya, K., and Mitra, G., (2009). A new kinematic evolutionary model for the growth of a duplex an example from the Rangit duplex, Sikkim Himalaya, India. Gondwana Res., 16, 697 715. F: Earth Surf., 2011, 116, F03012; DOI: 10.1029/2010JF001841
8) Black, P. E. (1972). Hydrograph response to geometric model watershed characteristics and precipitation variables. Journal of Hydrology, 17, 309 329.
9) Burbank,D.W.andAnderson,R.S.(2001)Tectonic Geomorphology. Blackwell Scientific, Oxford, 274 p.
10) Chakraborty, Goswami C., Mukhopadhyay, D., Poddar,B.C.,(2013).Geomorphologyinrelationto tectonics:acasestudyfromtheeasternHimalayan foothillsofWestBengal.QuaternaryInternational, 298,80e92.
11) Chakraborty, S., Mukhopadhyay, S., (2014). A comparative study on the nature of channel confluence dynamics in the lower Jaldhaka River system, West Bengal, India. International Journal of Geology, Earth & Environmental Sciences, 4(2), 87e97.
12) Chakraborty, T., Ghosh, P., (2010). The geomorphology and sedimentology of the Tista megafan, Darjeeling Himalaya: implications for megafan building processes. Geomorphology, 115, 252e266.
13) Chandra, C.B. (2014): The Kaldiya River basin in Assam, Department of Geography, Gauhati
International Research Journal of Engineering and Technology (IRJET) e ISSN:2395 0056
University; Access: Shodhganga: a reservoir of Indian theses @ INFLIBNET, http://hdl.handle.net/10603/73413
14) Chitra,C.,Alaguraja,P.,Ganeshkumari,K.,Yuvaraj, D., Manivel, M. (2011). Watershed characteristics ofKundahsub basinusingremotesensingandGIS techniques.IntJGeomaticsGeosci2:311 335.
15) Chorley, R. J., (1957). Illustrating the laws of morphometry, Geological Magazine, vol. 94, pp. 140 150.
16) Chow Ven T (1964). Handbook of applied hydrology.McGrawHillInc,NewYork.
17) Dasgupta, S., Pande, P., Ganguly, D., Iqbal, Z., Sanyal, K., Venkatraman, N.V., Dasgupta, S., Sural, B.,Harendranath,L.,Mazumdar,K.,Sanyal,S.,Roy, A., Das, L.K., Misra, P.S., Gupta, H., (2000). Sikkim Himalaya and Punea Basin, Plate SEISAT13. In: Nurula, P.L., Acharyya, S.K., Banerjee, J. (Eds.), SeismotectonicAtlasofIndia.GeologicalSurveyof India,Kolkata.
18) DeSmet(1951):Referredby Pal,S.S.(2091) inPhDthesis,Title: Landform and soil of a portion of Ajoy_Damodar interfluve West Bengal India, Chapter VII; Department of Geography, TheUniversityofBurdwan,Access:Shodhganga: a reservoir of Indian theses @ INFLIBNET, http://hdl.handle.net/10603/68815
19) DeCelles,P.G.,Gehrels,G.E.,Quade,J.andOjha,T. P., (1998). Eocene early Miocene foreland basin development and the history of Himalayan thrusting, western and central Nepal. Tectonics, 17,741 765
20) Dhalia, Md K., Ayazb, S., Sahanac, M., Guha, S., (2019); Response of sediment flux, bridge scouring on river bed morphology and geomorphic resilience in middle lower part of riverChel,EasternHimalayanfoothillszone,India; EcologicalEngineering,ELSEVIERB.V.;pp.1 11
21) Dingman S. Lawrence, (2009) Fluvial Hydraulics, OxfordUniversityPress,USA,
22) Doornkamp, J. C. and King, C. A. M., (1971). Numerical analysis in geomorphology an introduction,EdwardArnold(Publishers)Ltd.,GB. pp.3 73
23) DovNir, (1957): The ratio of relative relief and absolutealtitudesofMt.Carmel:AContributionto
the problem of relief analysis and relief classification.GeogRev.47:564 569
24) Elliot F.E. (1953): “A Technique of Presenting Slope and Relative Relief in One Map,” Surveying andMapping,Vol.13,Washington,pp.473 478.
25) Faniran, A. (1968): The Index of Drainage Intensity A Provisional New Drainage Factor. AustralianJournalofScience.31;328 330.
26) Fergusson, J., (1863). Recent changes in the Delta of the Ganges. Journal of the Geological Society of London,19,321e354.
27) Gangopadhyay, P.K., Ray, S., (1980). Tectonic framework of the Rangit window around Namchi, SouthSikkim.HimalayanGeology10,338 353.
28) Gansser, A., (1983). Geology of the Bhutan Himalaya,BirkhauserVerlag,Basel,p.181.
29) Geddes,A.,(1960).Thealluvialmorphologyofthe Indo Gangeticplain:itsmappingandgeographical significance. Institute of British Geographers TransactionsandPapers,28,253e276.
30) Ghosh,A.M.N.,(1956).Recentadvancesingeology and structures of the Eastern Himalaya. Proceedings 43rd Indian Science Congress 2, 85 99.
31) Glock,W.S.(1932):“AvailableReliefasa Factorof Control in the Profile of a Landform”, Journal of Geography,Vol.49,p.74.
32) Gravelius, H., (1914): Grundrifi der gesamten Gewcisserkunde. B and I: Flufikunde (Compendium of Hydrology, Vol. I. Rivers, in German).Goschen,Berlin,Germany.
33) Gray, D. M. (1970). Handbook on the Principles of Hydrology.NationalResearchCouncilofCanada.
34) Guha,D.,Bardhan,S.,Basir,S.R.,De,A.K.,Sarkar,A., (2007). Imprints of Himalayan thrust tectonics on theQuaternarypiedmontsedimentsoftheNeorae JaldhakaValley,DarjeelingeSikkimSub Himalayas, India. Journal of Asian Earth Sciences, 30, 464e473.
35) Hamdouni,R.,Irigaray,C.,Fernandez,T.,Chacón,J. and Keller, E.A. (2007) Assessment of Relative Active Tectonics, Southwest Border of Sierra Nevada (Southern Spain). Geomorphology, 96, 150 173.
http://dx.doi.org/10.1016/j.geomorph.2007.08.0 04
Volume: 09 Issue: 06 | June 2022 www.irjet.net p ISSN:2395 0072 © 2022, IRJET | Impact Factor value: 7.529 | ISO 9001:2008 Certified Journal | Page2625
International Research Journal of Engineering and Technology (IRJET) e ISSN:2395 0056
Volume: 09 Issue: 06 | June 2022 www.irjet.net p ISSN:2395 0072
36) Heim, A. and Gansser, A., (1939) Central Himalayas, Geological observations of the Swiss Expedition of 1936, Memory of society Helveticae ScienceNat73,1,1 245
37) Horton, R. E. (1945). Erosional development of streams and their drainage basin: hydrological approach to quantitative morphology, Bulletin, GeologicalSocietyofAmerica,vol.56,pp.275 370. http://dx.doi.org/10.1130/0016 7606(1945)56[275:EDOSAT]2.0.CO;2
38) Horton, R.E. (1932). Drainage Basin Characteristics. Transactions, American Geophysical Union, 13, 350 361. http://dx.doi.org/10.1029/TR013i001p00350
39) Jabbari, N., Servati, M.R. and Hosein Zadeh, M.M. (2012) The Study of Active Morphotectonic in Hesarak Basin (Northwest of Tehran) by Using Morphometric Indexes. Quantitative GeomorphologicalResearches,2,17 34.
40) Jaboyedoff, M., Giovanni B. Crosta & Stead, D. (2011): Slope Tectonics. Geological Society, London, Special Publications, 351, 1 10. DOI: 10.1144/SP351.1
41) Jagadeesh,J(1983):Landformsandsettlementsin Varada river basin, Department of Geography, Karnatak University; Access: Shodhganga: a reservoir of Indian theses @ INFLIBNET; http://hdl.handle.net/10603/108210
42) Kaberi,D.(2010):Terraincharacteristicsandtheir impact on land use of the Torsa Raidak interfluve WestBengal,DepartmentofGeography,University of Calcutta; Access: Shodhganga: a reservoir of Indian theses @ INFLIBNET; http://hdl.handle.net/10603/156040
43) Lama, S. and Maiti, R., (2019a): Morphometric Analysis of Chel River Basin, West Bengal, India, using Geographic Information System; Earth ScienceIndia;V.12(I),pp.1 23.
44) Lama, S. and Maiti, R., (2019b): Morphometric Analysis of Chel River Basin, West Bengal, India, using Geographic Information System; Earth ScienceIndia;V.12(I),July2019,pp.1 23.
45) Lari, A. A.; Ansari, M. and Ansari, S. (2016). Analysis Neotectonic Activities in Khafr Basin, Journal of Geology, Scientific Research Publishing Inc. 6, 484 497. SciRes. http://www.scirp.org/journal/ojg http://dx.doi.org/10.4236/ojg.2016.66040
46) Lavé, J. and Avouac, J. P., (2001): Fluvial incision and tectonic uplift across the Hima layers of central Nepal. J. Geophys. Res. B: Solid Earth, 106(B11),26561 26591.
47) Mandal, S., Sarkar, S. (2016). Overprint of neotectonismalongthecourseofRiverChel,North Bengal, India. Journal of Palaeogeography, 5(3), 221 240.
48) Mandi, S. and Soren, K., (2016) Morphotectonic Analysis of The Chel River Basin, Northern West Bengal, India; IOSR Journal of Humanities and SocialScience(IOSR JHSS)Volume21,Issue6,Ver. 7PP01 06
49) Matin, A., and Mukul, M., (2010): Phase of deformation from cross cutting structural relationship in external thrust sheets: insight frontal small scale structures in the Ramgarh thrust, Darjeeling Himalaya, Wes Bengal; Current Science,Vol.99,No.10
50) Mazumder, S. C. (1984): Geomorphology of Tripura, Department of Geography, North Eastern HillUniversity;Access:Shodhganga:areservoirof Indian theses @ INFLIBNET, http://hdl.handle.net/10603/61202
51) Melton, M.A., (1957): An Analysis of the Relations amongtheElementsofClimate,SurfaceProperties and Geomorphology. Technical Report 11, DepartmentofGeology,Columbia University,New York.
52) Miller, V.C. (1953): A Quantitative Geomorphic Study of Drainage Basin Characteristics in the Clinch Mountain area, Virginia and Tennessee. ProjectNR389 042,TechnicalReport:3,Columbia University, Dept. of Geology, ONR, Geography Branch,NewYork.
53) Mitra,G.,Bhattacharyya,K.andMukul,M.,(2010): The Lesser Himalayan Duplex in Sikkim: Implications for variations in Himalayan shortening.J.Geol.Soc.India,75,276 288.
54) Mohapatra, S.R.; Nayak, S.K.; Mohanty, A., Jana, P.; (2012): Geological section measurement study between Chel and Murti River, Jalpaiguri District, West Bengal.; GSI, Eartthquack Geology Division, Easternregion.;Report2012
55) Molin P, Pazzaglia F J and Dramis F (2004) Geomorphic expression of active tectonics in a rapidly deforming forearc, Sila Massif, Calabria, SouthernItaly;Am.J.Sci.304559 589.
International Research Journal of Engineering and Technology (IRJET) e ISSN:2395 0056
Volume: 09 Issue: 06 | June 2022 www.irjet.net p ISSN:2395 0072
56) Morgan, J.P., McIntyre, W.G., (1959): Quaternary geology of the Bengal Basin, East Pakistan and India. Geological Society of America Bulletin, 70, 319e342.
57) Morisawa M E (1958): Measurement of drainage basinoutlineform,J.Geol,66(5):587 591.
58) Morisawa, M. I., (1962): Quantitative geomorphology of some watersheds in the AppalachianPlateau,Bulletin,GeologicalSocietyof America,vol.73,pp.1025 1046
59) Mukhopadhyay (1973,1977,1978a, 1978b and 1979c): Referred by Kaberi, D. (2010) in PhD thesis, Title: Terrain characteristics and their impact on land use of the Torsa Raidak interfluve West Bengal, Chapter VI; Department of Geography, University of Calcutta; Access: Shodhganga: a reservoir of Indian theses @ INFLIBNET; http://hdl.handle.net/10603/156040
60) Mukul, M. (2010): First order kinematics of wedge scale active Himalayan deformation: insights from Darjiling Sikkim Tibet (DaSiT) wedge. J. Asian Earth Sci. 39, 645 657. http://dx.doi.org/10.1016/j.jseaes.2010.04.029
61) Mukul, M., (2000): The geometry and kinematics of the Main Boundary Thrust and related neotectonics in the Darjiling Himalayan fold and thrust belt, West Bengal, India. Journal of StructuralGeology22(9),1261 1283.
62) Mukul, M., Jade, S., Ansari, K. and Matim, A., (2014): Seismotectonic impact of strike slip earthquakes in the Darjiling Sikkim Himalaya, CurrentScience,Vol.106,No.2
63) Mukul, M., Jade, S., Matin, A., (2008): Active Deformation in the Darjiling Sikkim Himalaya based on 2000 2004 Geodetic Global Positioning System Measurements. In Recent Advances in EarthScience:IndianStatisticalInstitutePlatinum Jubilee Volumes, P.Ghosh & S. Bandyopadhyay (eds.),WorldScientificPublisher,Singapore.1 28.
64) Musy, A., (2001): Watershed Characteristic, In International Journal of Civil & Environmental Engineering IJCEE IJENS Vol: 11 No: 06 http://citeseerx.ist.psu.edu/viewdoc/download?d oi=10.1.1.661.9793&rep=rep1&type=pdf 19.102020at6.07amandreferredbyVenkatesan, A. (2015) in PhD thesis, Title: Geoinformatics in fluvial geomorphological study of thoppaiyar sub basinTamilNaduIndia,Chapter VI;Departmentof
Geography, Periyar University; Access: Shodhganga: a reservoir of Indian theses @ INFLIBNET;http://hdl.handle.net/10603/51184
65) Nakata,T.,(1989):ActiveFaultsoftheHimalayaof India and Nepal. Geological Society of America, 232.SpecialPaper.243 264.
66) Nir, D., (1957): “The Ratio of Relative Relief and Absolute Altitudes of Mt. Camel” Geographical Review.Vol.47,p.565.
67) Nir, D., (1957): Landform analysis of Mt. Kameral, GeographicalReview,47,pp.564.
68) Pandey,S.(1968):“EvolutionofHillslopesAround Jodhpur”, National Geographical Journal of India, Vol.14,Part I,pp.32 40.
69) Pareta, K. (2011). Geo Environmental and Geo HydrologicalStudyofRajghatDam,Sagar(Madhya Pradesh) using Remote Sensing Techniques, International Journal of Scientific & Engineering Research,2(8)(ISSN2229 5518),pp1 8.
70) Partsch, J.S. (1911): Fine landeskunde fur das deiitcheVolkBreslay.MapFaeing,2:568
71) Patel, P.P., (2012): Proceedings of State Level SeminaronGeographicalMethodsintheAppraisal of Landscape, held at Dept. of Geography, Dum Dum Motijheel Mahavidyalaya, Kolkata, on 20th March2012,pp1 14
72) Pearson, O. N. and DeCelles, P. G., (2005): StructuralGeologyandregionaltectonicsettingof the Ramgarh thrust, Himalayan fold thrust belt of Nepal.Tectonics,24.TC4008
73) Prasad, N., (1979) Hydrographic network and drainage basin analysis: a case study of the Barakar basin, Geographical Review of India, vol. 41(4),pp.297 303.
74) Rai,P.K.,Chandel,R.C.,Mishra,V.N.andSingh,P. (2018). Hydrological Inferences through Morphometric Analysis of Lower Kosi River Basin ofIndiaforWaterResourceManagementbasedon Remote Sensing Data, Applied Water Science (Springer), 8 15, pp. 1 16.DOI: https://doi.org/10.1007/s13201 018 0660 7.
75) Rai,P.K.,Chandel,R.C.,Mishra,V.N.andSingh,P. (2018). Hydrological Inferences through Morphometric Analysis of Lower Kosi River Basin ofIndiaforWaterResourceManagementbasedon Remote Sensing Data, Applied Water Science
(Springer), 8 15, pp. 1 16.DOI: https://doi.org/10.1007/s13201 018 0660 7.
76) Rai, P. K., Chaubey, P. K., Mohan, K. & Singh, P. (2017b). Geoinformatics for assessing the inferences of quantitative drainage morphometry of the Narmada Basin in India, Applied Geomatics (Springer), Vol. 9 (3), 1 23. DOI:10.1007/s12518 017 0191 1
77) Rai,P.K.*,Singh,P.,Mishra,V.N.,Singh,A.,Sajan,B. and Shahi, A. P., (2019) Geospatial Approach For Quantitative Drainage Morphometric Analysis Of Varuna River Basin, India, Journal Of Landscape Ecology,Vol:12/No.2,DOI:10.2478/Jlecol 2019 0007
78) Rai,P.K.,Mishra,V.N.&Mohan,K.(2017a).AStudy of Morphometric Evaluation of the Son Basin, India Using Geospatial Approach, Remote Sensing Applications: Society and Environment, Vol. 7, 9 20.DOI:10.1016/j.rsase.2017.05.001.
79) Raina, V.K., (1976): “The Rangit Tectonic Window” stratigraphy, structure and tectonic interpretation and it's bearing on the regional stratigraphy. Proceedings of Himalayan Geology Seminar,NewDelhi,36 43.
80) Rais, S. & Javed, A. (2014). Drainage Characteristics of Manchi Basin, Karauli District, Eastern Rajasthan Using Remote Sensing and GIS Techniques. International Journal of Geomatics andGeoscience,Vol.5(1),pp.285 299.
81) Raisz E. and Henry, J. (1937): An Average Slope Map of Southern New England, Geographical Review,Vol.27,NewYork,pp.467 472.
82) Ray,S.,(1947)Zonalmetamorphismintheeastern Himalayas and some aspects of local geology. Quarterly Journal of the Geological Mining and MetallurgicalSocietyofIndia19,117 139.
83) Reitz, M. D., D. J. Jerolmack, and J. B. Swenson (2010), Flooding and flow path selection on alluvial fans and deltas, Geophys. Res. Lett., 37, L06401,doi:10.1029/2009GL041985.
84) Ritter, D.F., Kochel, R.C. and Miller, J.R. (1995) Process Geomorphology WBC/Mc Graw Hill, Boston,545p.
85) Rosendahl, J., M. Vekic slash, and J. Kelley (1993), Persistentselforganizationofsandpiles,Phys.Rev. E, 47(2), 1401 1404, doi:10.1103/ PhysRevE.47.1401.
International Research Journal of Engineering and Technology (IRJET) e ISSN:2395 0056 Volume: 09 Issue: 06 | June 2022 www.irjet.net p ISSN:2395 0072 © 2022, IRJET | Impact Factor value: 7.529 | ISO 9001:2008 Certified Journal | Page2628
86) Sambrook Smith, G., and R. Ferguson (1995), The gravel sand transition along river channels, J. Sediment.Res.,65(2),423 430.
87) Savenije, H. (2003), The width of a bankful channel;Lacey’sformulaexplained,J.Hydrol.,276, 176 183,doi:10.1016/S0022 1694(03)00069 6.
88) Schideggar. A.E., (1970): Theoretical Geomorphology. 2nd edn. Berlin Heidelberg New York:Springer.
89) Schumm, S., M. P. Mosley, and W. E. Weaver (1987), Experimental Fluvial Geomorphology, JohnWiley,NewYork.
90) Schumm, S.A. (1956) Evolution of Drainage Systems and Slopes in Badlands at Perth Amboy, NewJersey.GeologicalSocietyofAmericaBulletin, 67, 597 646. http://dx.doi.org/10.1130/0016 7606(1956)67[597:EODSAS]2.0.CO;2
91) Sharma, H.S. (1981): Perspective in Geomorphology, Concept Publishing Company, Vol.IV,NewDelhi,p 81.
92) Sheets, B., T. Hickson, and C. Paola (2002), Assembling the stratigraphic record: Depositional patterns and time scales in an experimental alluvial basin, Basin Res., 14, 287 301, doi:10.1046/j.1365 2117.2002.00185.x.
93) Singh and Singh, (1997) in Kuldeep Pareta1, Upasana Pareta2 (2011): Quantitative MorphometricAnalysisofaWatershedofYamuna Basin, India using ASTER (DEM) Data and GIS, International Journal Of Geomatics And Geosciences,Volume2,No1,248 269
94) Singh, K. N. (1980). Quantitative analysis of landformsandsettlementdistributioninsouthern uplandsofeasternUttarPradesh(India).
95) Singh, P., Thakur, J. & Singh U. C. (2013). Morphometric analysis of Morar River Basin, Madhya Pradesh, India, using remote sensing and GIStechniques.EnvironEarthSci68:1967 1977
96) Singh, S., & Dubey, A. (1994). Geo environmental planningofwatershedsinIndia.Allahabad:Chugh Publications.
97) Slingerland, R., and N. Smith (2004), River avulsions and their deposits, Annu. Rev. Earth Planet. Sci., 32, 257 285, DOI: 10.1146/annurev. earth.32.101802.120201.
International Research Journal of Engineering and Technology (IRJET) e ISSN:2395 0056
Volume: 09 Issue: 06 | June 2022 www.irjet.net p ISSN:2395 0072
98) Slmith, G.H. (1935): The relative relief of Ohio. GeographicalReview,25:272 84
99) Smith, G. H. (1935): The relative relief of Ohio, GeographicalReview,Vol.25,pp.272 84
100) Smith,K.G.(1950)StandardsforGradingTextures of Erosional Topography. American Journal of Science, 248, 655 668. http://dx.doi.org/10.2475/ajs.248.9.655
101) Smith, N. D., T. A. Cross, J. P. Dufficy, and S. R. Clough (1989), Anatomy of an avulsion, Sedimentology, 36, 1 23, doi:10.1111/j.1365 3091.1989.tb00817.x.
102) Srivastava, P. and Mitra, G., (1994): Thrust geometries and deep structure of the outer and lesser Himalaya, Kumaon and Garhwal (India): implications for evolution of the Himalayan fold and thrustbelt.Tectonics,13,89 109.
103) Srivastava,V.,ManasMukul,M.,Mukul,M.*,(2017) QuaternarydeformationintheGarubathanrecess: Insightsonthestructuralandlandscapeevolution in the frontal Darjiling Himalaya. Elsevier Ltd and QuaternaryInternationalNo.462;pp.138 161.
104) Starkel, L., Sarkar, S., Soja, R. and Prokop, P., (2008): Present Day Evolution of the Sikkimese Bhutanese Himalayan Piedmont, Geographical Studies: No. 219; Instytut Geografii i Przestrzennego Zagospodarowania PAN im. Stanisława Leszczyckiego, Warszawa; PL ISSN 0373 6547; ISBN 978 83 61590 09 5 https://www.researchgate.net/publication/26119 6285_Present day_evolution_of_the_Sikkimese Bhutanese_Himalayan_Piedmont/link/0c9605339 3bc36e14c000000/download ; Access on 19.10.2020at3.15a.m
105) Strahler, A.H., (1964): Quantitative Geomorphology of Drainage Basins and Channel Networks in Handbook of Applied Hydrology, McGraw Hill Book Company, Newyork, Section 4, pp39 76.
106) Strahler, A.N. (1952a) Dynamic Basis of Geomorphology. Geological Society of America Bulletin, 63, 923 938. http://dx.doi.org/10.1130/0016 7606(1952)63[923:DBOG]2.0.CO;2
107) Strahler, A.N. (1952b) Hypsometric (Area Altitude) Analysis of Erosional Topography. Geological Society of America Bulletin, 63, 1117
1142. http://dx.doi.org/10.1130/0016 7606(1952)63[1117:HAAOET]2.0.CO;2
108) Strahler,A.N.(1956)“QuantitativeSlopeAnalysis”. Bulletin of the Geological Society of America, Vol. 67,NewYork,pp.571 596.
109) Strahler,A.N.,(1958)Dimensionalanalysisapplied to fluvially eroded landforms: Geol. Soc. Am. Bull., v.69,p.279 300.
110) Surkan, (1967): referred by Yadav, B. (2019) in PhD thesis, Title: Fluvial Geomorphology of Basna Drain and Mansaita River with Special Reference to Settlement and Agriculture A Case Study of Phaphamau Environs, Chapter III; Department of Geography, University of Allahabad; Access: Shodhganga: a reservoir of Indian theses @ INFLIBNET;http://hdl.handle.net/10603/270181
111) Trewartha, G.T. (1957): New Population Maps of Uganda,Kenya,Nyasaland,AndGoldCoast;Annals of the Association of American Geographers; Volume47, Issue1, Pages 42 58. https://doi.org/10.1111/j.1467 8306.1957.tb01522.x
112) Valdiya,K. S.,(2002): Emergenceand evolutionof Himalaya: reconstructing history in the light of recent studies, Progress in Physical Geography 26,3pp.360 399
113) Verstappen, H. (1983). The Applied Geomorphology. International Institute for Aerial Survey and Earth Science (I.T.C), Enschede, The Netherlands.Amsterdam,Oxford,NewYork.
114) Wentworth, C.K. (1930): “A Simplified Method of Determining the Average Slope of Land Surfaces”, AmericanJournalofScience,Series5,Vol.20,New Haven,Conn.
115) Wisler, C.O. and Brater, B.F. (1959): Hydrology; John Wiley& SonsInc,Ed:1st;New York;ISBN 13: 978 0471956341
116) Yin, A., (2006): Cenozoic tectonic evolution of the Himalayan orogen as constrained by along strike variation of structural geometry, exhumation history, and foreland sedimentation. Earth Sci. Rev.,76,1 131.