International Research Journal of Engineering and Technology (IRJET) e-ISSN: 2395-0056

Volume: 09 Issue: 12 | Dec 2022 www.irjet.net p-ISSN: 2395-0072

International Research Journal of Engineering and Technology (IRJET) e-ISSN: 2395-0056
Volume: 09 Issue: 12 | Dec 2022 www.irjet.net p-ISSN: 2395-0072
Shailendra Chaudekar1
1PG Diploma, Big Data Analytics, CDAC Kolkata, India ***
Abstract - The data analysis in this research is done with Python. The programming language is being explored. This article quickly describes the fundamental processes of data analysis, such as cleaning, transforming, and modelling data, with an emphasis on exploratory data analysis. Data analysis of an existing dataset and discovery of insights Using several Python libraries and methods, some graphical analysis of data from the dataset will be demonstrated. Here, A dataset titled "World Happiness Report 2022" is used to examine and extract data in both numerical and visual formats.
Key Words: Python, Data Analytics, Data Science, Data Visualization, Python Libraries, Numpy, Pandas, Graphical ExploratoryDataAnalytics
Python is a high-level, general-purpose programming language that has recently gained popularity. It enables programmers to write code in fewer lines, which is not achievable with other languages. Python programming is notable for its support of many programming paradigms Python includes a broad, extendable standard library. Python'sprimarycharacteristicsincludesimpleandeasyto learn, freeware and open source, and high-level programminglanguage.Platformindependence,portability, dynamically typed, procedure and object-oriented, Extensible,Embedded,andExtensiveLibrary.
WehopetoprovideaquickoverviewofPythonintheareas of data science, IoT, and machine learning in this article. Pythoniswell-knownforhavingaplethoraoflibrariesthat aidwithdataanalysisandscientificcomputing.Forexample, wemaycreateaPythonprogrammetoassistdataanalystsin analysingmassivevolumesofdataforscientificcomputing. This paper requires a basic understanding of statistics as well as some experience with any C-style language. A workingunderstandingofPythonisadvantageousbutnot required.
Data science is a multidisciplinary field that extracts knowledge and insights from organised and unstructured data using scientific techniques, procedures, tools, and systems. Data analytics, data mining, and big data are all connected to data science. It comprehends the data phenomena.Itincorporatestechniquesandtheoriesfroma variety of domains, including mathematics, statistics, computerscience,andinformationscience.Statisticsisone
of the most essential disciplines for providing tools and methods for finding structure in and providing greater insight into data, as well as for analysing and quantifying uncertainty.Pythonhasanumberofpreconfiguredmodules forworkingondatasciencetasks.
Data Science is a booming field of study that combines statistics, computer science, and a variety of applied scientific fields. As is customary in such transdisciplinary settings,fieldsofstudy,DataScienceeducation,mentorship, andresearchtakesideasandinspirationfroma varietyof other domains, including the mathematical sciences, computerscience,andnumerousbusinessandapplication domains.
ThisfieldpresentsanoverviewtoDataScience,including awiderangeofessentialissuesandapproachesforworking with huge data. Data collection, integration, management, modelling,analysis,visualisation,prediction,andinformed decision-makingareamongthetopicstobecovered,asare data security and data privacy. This integrates databases, datawarehousing,statistics,datamining,datavisualisation, high-performancecomputing,cloudcomputing,andbusiness intelligence into the basic disciplines of data science. Professionalabilitiessuchascommunication,presentation, anddatastorytellingwillbecultivated.Throughhands-on projectsandcasestudiesinarangeofbusiness,engineering, socialsciences,andbiologicalsciencesareas,studentswill getapracticalgraspofdatascience
The analysis of varied data basically entails cleaning the data, translating it into comprehensible form, and then modelling data to extract some relevant information for commercialororganisationalusage.Itismostlyemployedin commercialdecisions.Thereareseverallibrariesaccessible for conducting the analysis. NumPy, Pandas, Seaborn, Matplotlib,Sklearn,andmoreareexamples.
NUMPY: NumPyisthefoundationalPythonlibrary forscientificcomputing.ItisaPythonlibrarythat includes a multidimensional array object, various derived objects (such as masked arrays and matrices),andavarietyofroutinesforperforming fastarrayoperationssuchasmathematical,logical, shapemanipulation,sorting,selecting,I/O,discrete Fourier transforms, basic linear algebra, basic
International Research Journal of Engineering and Technology (IRJET) e-ISSN: 2395-0056
Volume: 09 Issue: 12 | Dec 2022 www.irjet.net p-ISSN: 2395-0072
statisticaloperations,randomsimulation,andmuch more.
PANDAS : Pandas is a data manipulation and analysis software package created for the Python computerlanguage.Itprovidesdatastructuresand functions for manipulating numerical tables and time series in particular. It is free software distributedundertheBSDthree-clauselicence.The nameistakenfromtheword"paneldata,"whichis an econometrics term for data sets that comprise observations for the same persons over several periods.Itsnameisanallusiontotheterm"Python data analysis." Wes McKinney began developing what would become pandas while working as a researcheratAQRCapitalfrom2007to2010.
MatPlotlib : Matplotlib is a Python package that allows you to create static, animated, and interactivevisualisations.Matplotlibmakessimple thingssimpleanddifficultthingspossible. 1. Produceplotssuitableforpublishing. 2. Create interactive figures that can be zoomed,panned,andupdated. 3. Changethevisualstyleandlayout. 4. Exporttoavarietyoffileformats. 5. IncorporateJupyterLabandGraphicalUser Interfaces. Sklearn:TheSklearnLibraryismostlyusedfordata modellingandprovideseffective,user-friendlytools for any type of predictive data analysis. This library'sprincipalusecasesmaybedividedintosix groups,whichareasfollows:
variables (such as height, weight, age, and pay) can be identifiedandobtained.Itmakesnodifferencewhetherthe dataisnumericalorcategorical.
Depending on the demands of the study, data is acquired fromarangeofsources,includingrelationaldatabases,cloud databases,andothersources.Datasourcescanalsoinclude field sensors such as traffic cameras, satellites, and monitoringsystems.
Data must be processed or structured before it can be analysed.Thesemayinclude,forexample,organisingdata into rows and columns in a tabular format (known as structured data) for further analysis, generally using a spreadsheetorstatisticalsoftware.
Data cleaning is the process of cleansing data after it has beenprocessedandarranged.Itsearchesforandeliminates data inconsistencies, duplication, and mistakes. Record matching,identifyingdatainaccuracy,datasorting,outlier datadetection,textualdataspellchecking,anddataquality maintenanceareallpartofthedatacleaningprocess.Asa result,itpreventsunexpectedconsequencesandaidsusin supplyinghigh-qualitydata,whichiscriticalforasuccessful outcome.
Afterthedatasetshavebeencleanedandcheckedforerrors, they may be examined. A range of approaches, such as exploratory data analysis understanding the messages contained within the gathered data and descriptive statistics finding the average, median, and so on can be used. Data visualisation is a technique in which data is displayedgraphicallyinordertogetmoreinsightsintothe informationcontainedwithinthedata.
Mathematicalformulaeormodelscanbeappliedtodatato detect links between variables, such as correlation or causation.
Themostcrucial unitin everystudyisdata.Data mustbe given as inputs to the analysis based on the needs of the analysis.Theword"experimentalunit"referstothesortof organisationemployedtocollectdata(forexample,aperson or community of individuals). Specific demographic
A data product is a computer application that takes data inputsandgeneratesoutputsthatarethenfedbackintothe environment.Itmightbebuiltonamodeloranalgorithm.
ThisreviewwillexploredataanalysisinPython.Themost fundamentalconcepts,suchaswhyPythonisusedfordata analysis, will be grasped. Furthermore, how anyone may begin using Python will be demonstrated. The essential
2022, IRJET | Impact Factor value: 7.529 | ISO 9001:2008 Certified Journal | Page462
International Research Journal of Engineering and Technology (IRJET) e-ISSN: 2395-0056
Volume: 09 Issue: 12 | Dec 2022 www.irjet.net p-ISSN: 2395-0072
libraries,platforms,anddatasetsfordoingtheanalysiswill be introduced. The use of several Python functions for numericalanalysisisexplained,aswellasvariouswaysfor generatinggraphsorcharts.
Packagesused:1.Numpy 2.Pandas3.Seaborn4.Matplotlib
Platformused: Anaconda(JupyterNotebook
Datasetused: WorldHappinessrecord2022
Fig -1:Aviewofthedataset(WorldHappinessrecord2022)
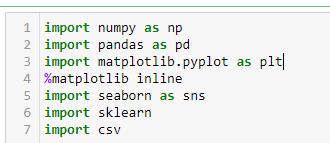
A. Importlibraries:
Librariesthatwillbeutilisedintheanalysisprocess shouldbeimportedfirst.Herearetheimportcodes forthelibraries
import numpy as np import pandas as pd import matplotlib.pyplot as plt
%matplotlib inline import seaborn as sns import sklearn import csv
Fig -2:Importinglibraries
Thedataset(WorldHappinessReport2022)isimportedinto theJupyternotebookinthiscase. data = pd.read_csv("Path\World Happiness Report 2022.csv") data
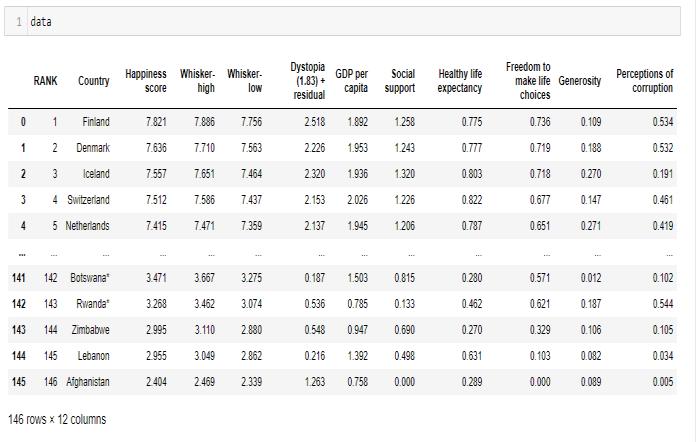
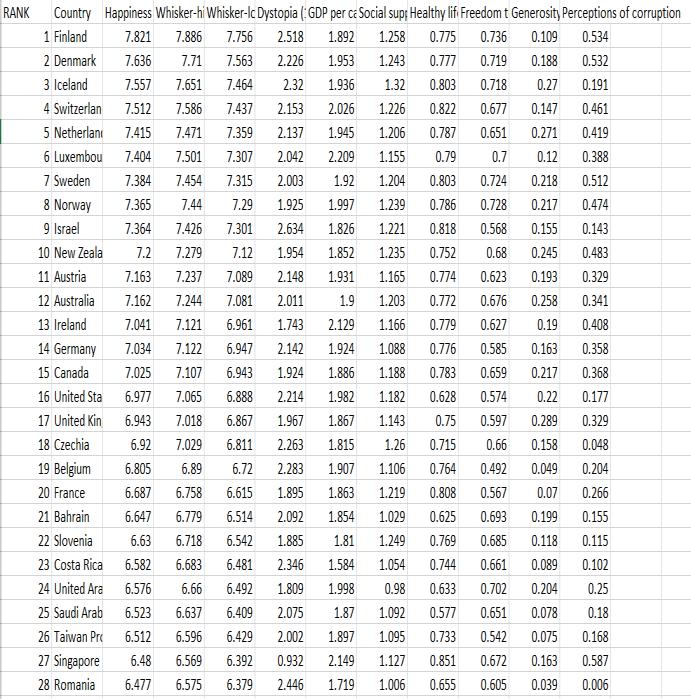
Fig -3: Importingdataset
Datacleaninginvolvestheremovalofunnecessarydata ornullvalues.So,initially,wemustexaminethedatasetto see whether it includes any null values or empty cells. # isnull() returnstrueinentrieswithnovalueoraNAvalue. Andsum()isusedinconjunctionwith isnull() togetthetotal numberofnullvaluesineachcolumn.
data.isnull().sum()
2022, IRJET | Impact Factor value: 7.529 | ISO 9001:2008 Certified Journal
International Research Journal of Engineering and Technology (IRJET) e-ISSN: 2395-0056
Volume: 09 Issue: 12 | Dec 2022 www.irjet.net p-ISSN: 2395-0072
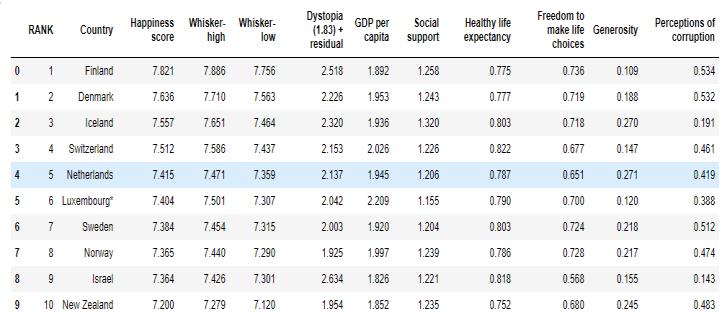
We can extract specific rows or records from the dataset based on our analytical needs. Here's an example of extractingthefirstandendrowsofadataset.
#head() returnsthedataatthetopofthedataset.Thehead's defaultvalueis5.().Thetoptenrowsofthedatasetareused inthiscase.
headdata = data.head(10) headdata
Fig. 6. Last10rowsofthedataset
Exploratorydataanalysisisaprocessofanalysing data sets in order to summarise their major properties,whichisfrequentlydonewithstatistical graphicsandotherdatavisualisationapproaches.A statisticalmodelmayormaynotbeutilised,butthe primarygoalofEDAistoexplorewhatthedatacan tellusbeyondtheformalmodellingorhypothesis testingwork.JohnTukeychampionedexploratory data analysis to encourage statisticians to investigatethedataandmaybecreatehypotheses that could lead to future data gathering and experiments.
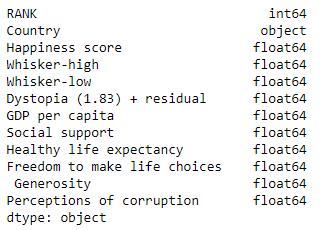
InPython,datatypereferstothetypeofdata-int,object,and float are the main datatypes. Using dtypes, print the data typesofallcolumnsinthedataset data.dtypes
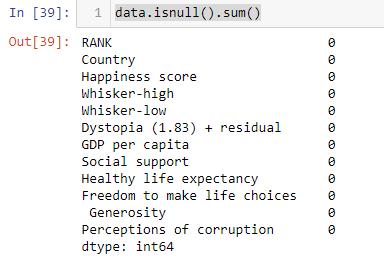
Fig. 5. Top10rowsofthedataset
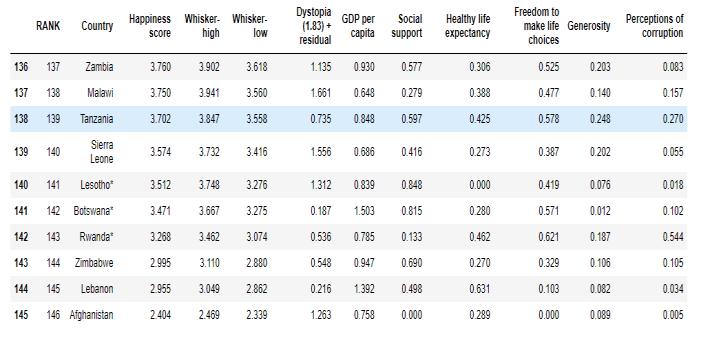
#tail() is used to retrieve the dataset's final rows. The tail() default value is 5.
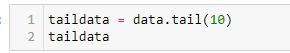
taildata=data.tail(10)
Taildata
Fig. 7. Datatypesofthewholecolumnsinthedataset
International Research Journal of Engineering and Technology (IRJET) e-ISSN: 2395-0056
Volume: 09 Issue: 12 | Dec 2022 www.irjet.net p-ISSN: 2395-0072
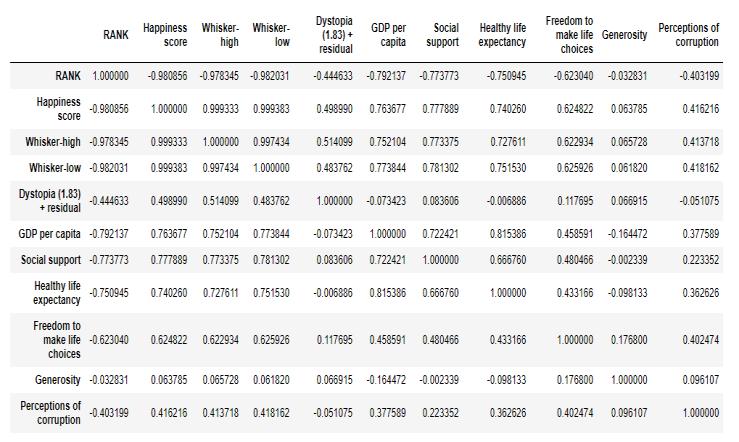
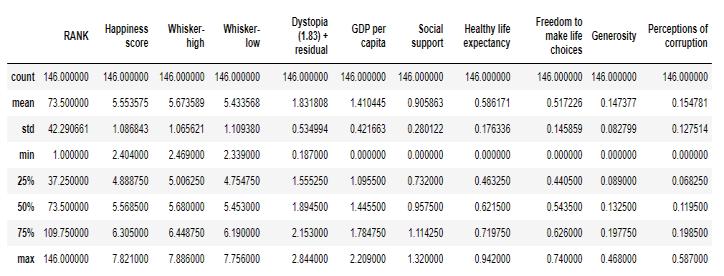
DescribingtheDataset:
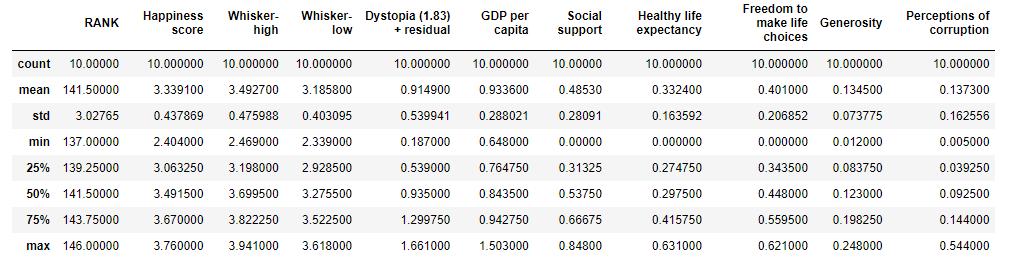
Describingdatafromadatasetentailsobtainingasummary ofthesupplieddataframe,suchasmean,count,min,max, and so on. It is possible to accomplish this using the describe()functiondata.describe()
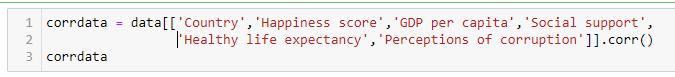
Fig. 8. Summaryofthewholedataset taildata.describe()
Fig. 10. Correlationofthewholedataset data[['Country’,‘Happiness score’,‘GDP per capita', 'Social support’, ‘Healthy life expectancy’, ‘Perceptions of corruption']].corr()
corrdata
Fig. 9. Summaryofsomeselectedentries(10lastrows)
Correlations:
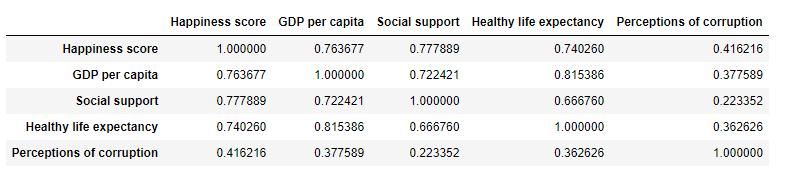
Correlationdemonstratestherelationshipbetweenanytwo variablesinadataset.Correlationmeasuresthestrengthofa linear relationship between two variables. Using corr()to printthecorrelationofmultiplecharacteristics data.corr()
Fig. 11. Correlationofsomeattributesinthedataset
Graphical exploratory data analysis is fundamentally the graphical version of nongraphicalexploratorydataanalysis.EDAevaluates datasetstosummarisetheirstatisticalproperties byfocusingonthesamefourmajorelements,such as measures of central tendency, measures of spread, distribution shape, and the presence of outliers.WealsoclassifiedGEDAintothreetypes: univariate, bivariate, and multivariate. In the comingparagraphsandGEDAfeatures[5,]wewill gooverthesesignificanttypesinfurtherdepth.To begin, a subset of the data frame is selected for analysisorvisualisation.
International Research Journal of Engineering and Technology (IRJET) e-ISSN: 2395-0056
Volume: 09 Issue: 12 | Dec 2022 www.irjet.net p-ISSN: 2395-0072
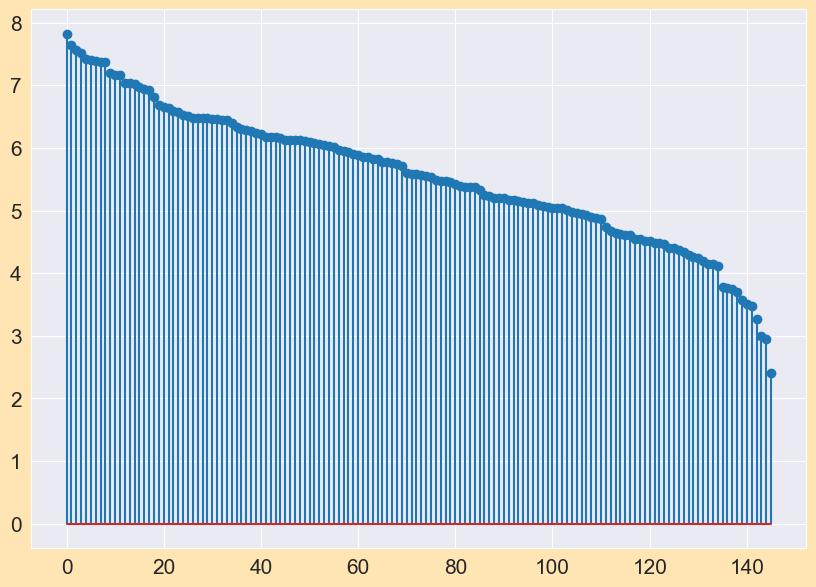
Astemplotestablishesamarkerateachx-pointanddraws verticallinesfromthebaselinetothey-axis.Thex-positions arenotrequired.Theformatscanbesuppliedaskeywordor positionalparameters.Matplotlib.pyplot.stemcanbeusedto createastemplotinPython()
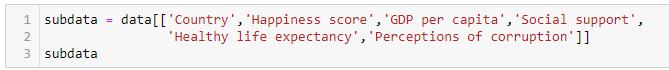
Fig. 12. Asubsetofthedataframe
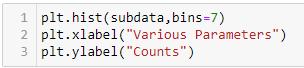
Ahistogram isa data representation thatresemblesa bar graphandgroupsvariousoutcomesintocolumnsalongthe x-axis.They-axiscanbeusedtodepictnumericalcountsor percentagesofoccurrencesineachcolumntodemonstrate data distributions. Matplotlib.pyplot.hist() can be used to createahistograminPython.
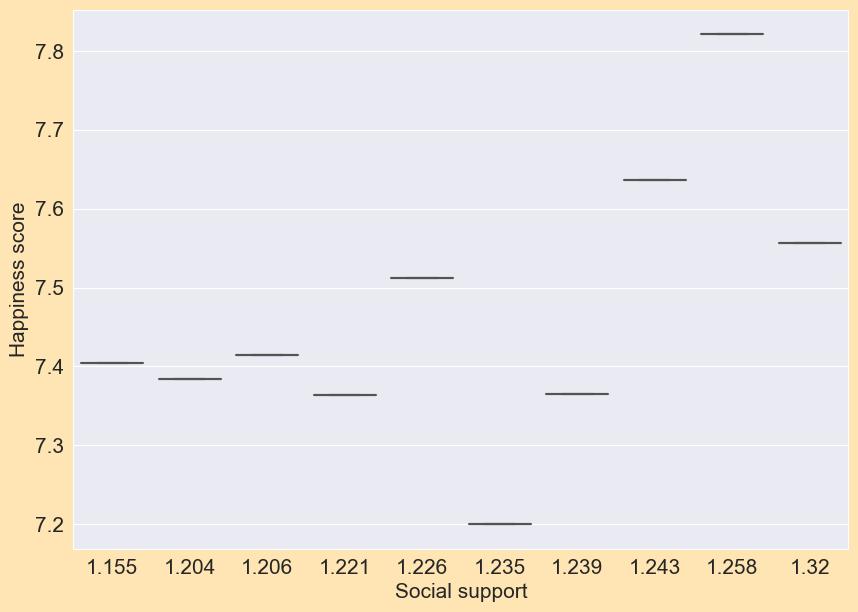
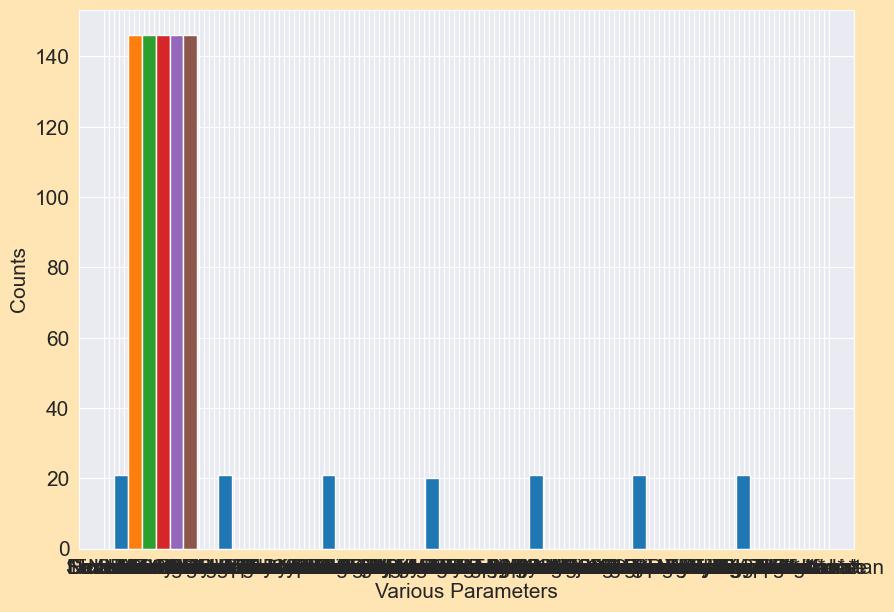
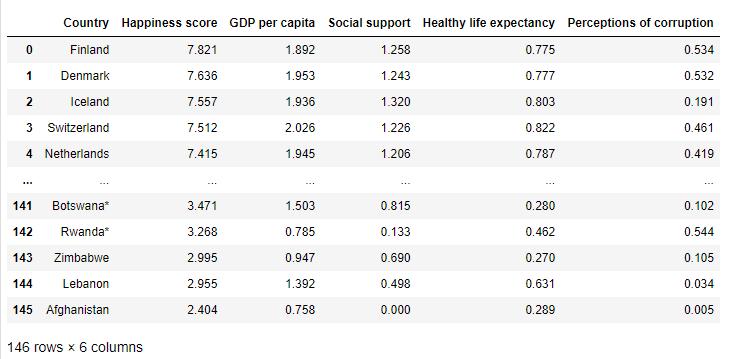
Chart. 2. Stemplot
A box plot is a visual depiction and comparison of data groupings. The box plot illustrates the level, spread, and symmetryofadatadistributionbyemployingthemedian, approximatequartiles,outliers,andthesmallestandlargest datapoints(extremevalues).
Chart. 1. Histogram
Chart. 3. Boxplot
International Research Journal of Engineering and Technology (IRJET) e-ISSN: 2395-0056
Volume: 09 Issue: 12 | Dec 2022 www.irjet.net p-ISSN: 2395-0072
Inascatterplot,dotsrepresentthevaluesoftwoseparate numerical variables. The positions of each dot on the horizontal and vertical axes represent the values for each data point. Scatter plots are used to show how variables relatetooneanother.Thescatterplotof"Happinessscore" vs“GDPperCapita”isshownbelow-
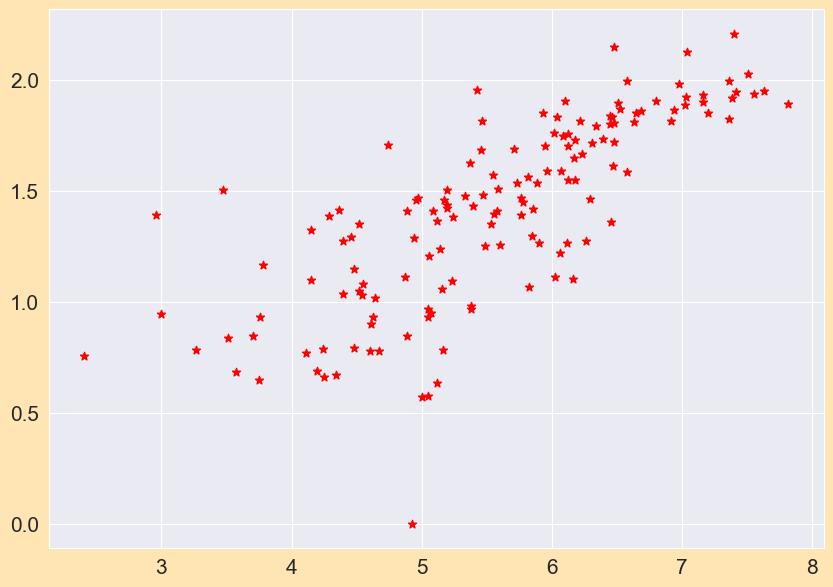
1. Scatterplot: Chart 4 ScatterPlot
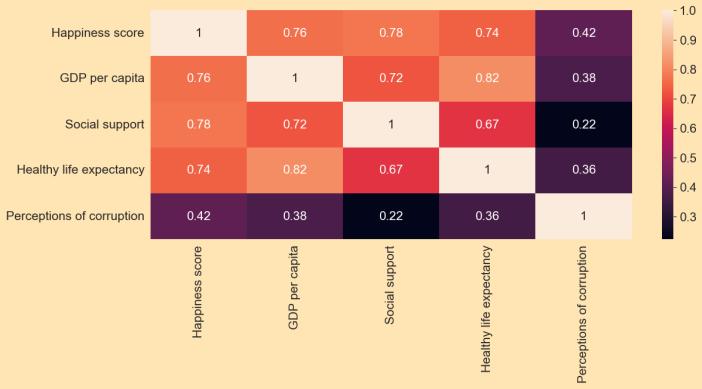
•HeatMaps:
Aheatmapisagraphicalrepresentationofdatathatemploys colour coding to indicate different values. It is a twodimensionaltableofcolourtones.Thisgraphingapproachis widelyusedinbiologytodisplaygeneexpressionandother multivariatedata.
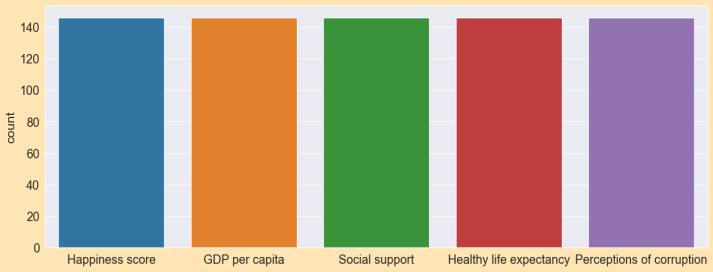
ASeaborncountplotisagraphicaldepictionofthenumber ofoccurrencesorfrequencyforeachcategoryofdata,shown by bars. The countplot() functionis used to generate bars that represent the number of observations in each categoricalcategory.Thesub-datadataframeisshownusing theCountplot.
Chart. 6. Countplot
The many processes of data analysis, including data collection, cleaning, and analysis, are addressed briefly in this work. The primary focus of this course is exploratory dataanalysis.Pythonprogramminglanguageisutilisedfor implementation.Jupyternotebookisusedforin-depthstudy. Various Python libraries and packages are discussed. Numerousfindingsaregatheredusingvariousanalyticaland visualization approaches. The dataset "World Happiness Record2022"isusedtoextractimportantinformationsuch asthedifferenceinhappinessscoresofdifferentcountries, the dependence of one attribute in building up the score, howavariableaffectsanothervariable,andsoon.Various graphs have been plotted using various attributes in the dataset to draw conclusions in an easy way. The primary focus of this course is exploratory data analysis. Python programming language is utilised for implementation. Jupyternotebookisusedforin-depthstudy.VariousPython librariesandpackagesarediscussed.Numerousfindingsare gathered using various analytical and visualization approaches.Thedataset"WorldHappinessRecord2022"is usedtoextractimportantinformationsuchasthedifference inhappinessscoresofdifferentcountries,thedependenceof oneattributeinbuildingupthescore,howavariableaffects another variable, and so on. Various graphs have been plotted using various attributes in the dataset to draw conclusionsinaneasyway.
Chart. 5. Heatmap
International Research Journal of Engineering and Technology (IRJET) e-ISSN: 2395-0056
Volume: 09 Issue: 12 | Dec 2022 www.irjet.net p-ISSN: 2395-0072
[1] Wolfram, S.: Mathematica: A System for Doing MathematicsbyComputer.Addi-sonWesleyLongman PublishingCo.,Inc.,Boston(1991)
[2] Mauriciusa Munhoz de Medeiros, Norberto Hoppen, Antonio Carlosa Gastaud Maçada, Data science for business:benefits,challengesandopportunities,Bottom Line (ISSN: 0888045X) 33 (2020) 149–163, http://dx.doi.org/10.1108/BL-12- 20190132/FULL/XML.
[3] Viv Bewick, Liz Cheek, and Jonathan Ball. Statistics review7:Correlationandregression.Criticalcare,2003.
[4] DrOssamaEmbarak,Embarak,andKarkal.Dataanalysis andvisualizationusingpython.Springer,2018.
[5] Michel Jambu. Exploratory and multivariate data analysis.Elsevier,1991.
[6] Matthieu Komorowski, Dominic C Marshall, Justin D Salciccioli,andYvesCrutain.Exploratorydataanalysis. Secondaryanalysisofelectronichealthrecords,2016.
[7] https://stackoverflow.com
[8] https://github.com
[9] KDNuggetspollresulthttps://www.kdnuggets.com/
2022, IRJET | Impact Factor value: 7.529 | ISO 9001:2008 Certified Journal