International Research Journal of Engineering and Technology (IRJET) e-ISSN:2395-0056

Volume: 09 Issue: 12 | Dec 2022 www.irjet.net p-ISSN:2395-0072

International Research Journal of Engineering and Technology (IRJET) e-ISSN:2395-0056
Volume: 09 Issue: 12 | Dec 2022 www.irjet.net p-ISSN:2395-0072
Elizabeth
Piersall1, Peter Fuhr21 Research Scientist, Oak Ridge National Laboratory, Oak Ridge, TN 37831 USA 2 Distinguished Scientist, Oak Ridge National Laboratory, Oak Ridge, TN 37831 USA ***
Abstract –Numerous sensing techniques and instrumentation are used in determining the state of the electric grid. Coupled with such measurements are the methods and analysis tools used. The parameters of interest result in both periodic and aperiodic signals. An examination of appropriate analysis tools is presented.
Key Words: electricgrid,aperiodicsignals,analytics
1. INTRODUCTION
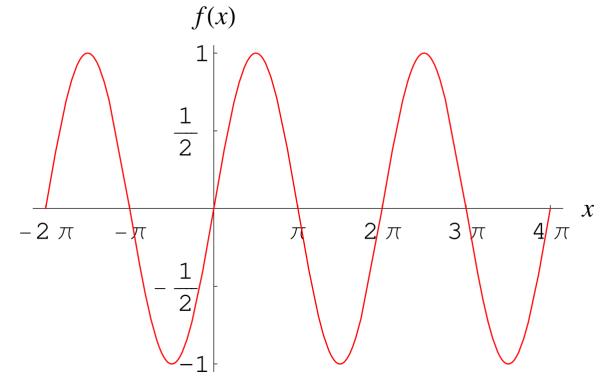
Aperiodicfunctionisdefinedasafunctionthatrepeatsitsvaluesatregularintervals. Thetypicalexampleofsuchafunctionis thatafunctionfissaidtobeperiodicif,forsomenonzeroconstantP,itisthecasethat f(x)=f(x+nP) forallvaluesofxinthedomain.wheren=1,2,... Theclassicexamplesofperiodicityaretrigonometricfunctionssuchasthesine wavedepictedinFigure1.
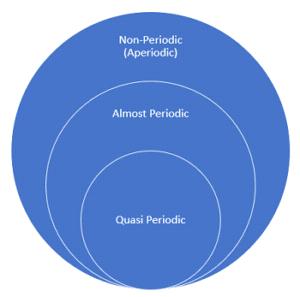
This specific definition of a periodic function sets the conditions to define an aperiodic function: An aperiodic (or non periodic function) is any function that isn’t periodic, and as such, any measured signal can be described in terms of being periodic or aperiodic. A variant on this definition is one provided by Adams [1]: Although an aperiodic function isn’t not periodic in nature, there is a very close relationship: mathematically, you can think of them as periodic functions with a period of infinity Notethatthereare(atleast) twosubclassesofaperiodicfunctions,thosebeing:(1) Almost-periodic functionwhich,although notperiodicthemselves,canberepresentedbyasumoftwoormoreperiodicfunctions;and(2) Quasiperiodic functionswhich are a combination of periodic functions of different frequencies that never completely match up. These classes of aperiodic functionsareillustratedinFigure2.
© 2022, IRJET | Impact Factor value: 7.529 | ISO 9001:2008 Certified Journal | Page1487
International Research Journal of Engineering and Technology (IRJET) e-ISSN:2395-0056
Volume: 09 Issue: 12 | Dec 2022 www.irjet.net p-ISSN:2395-0072
Figure2. Classesofaperiodicfunctions.
Electrical grid assets require monitoring to ensure that they are adequately performing their designed function and to properlymaintaintheassettoavoidunanticipatedfailurewhilein operation.Anumberofpractical,operationalbenefitscan bederivedfromincreasedmeasurementcapabilitiesincluding:
(1)Increasedreliabilityandresiliencethroughpreventionofcatastrophicfailuresofcriticalassets;
(2)Delayedbuild-outofnewtransmissionandothergridassetsthroughmoreeffectiveassetutilization;
(3)Morerapiddetectionandcorrectionofcriticalfaultconditions,and
(4) Implementation of condition-based maintenance programs as a substitute for run-to-failure or time-based maintenance.
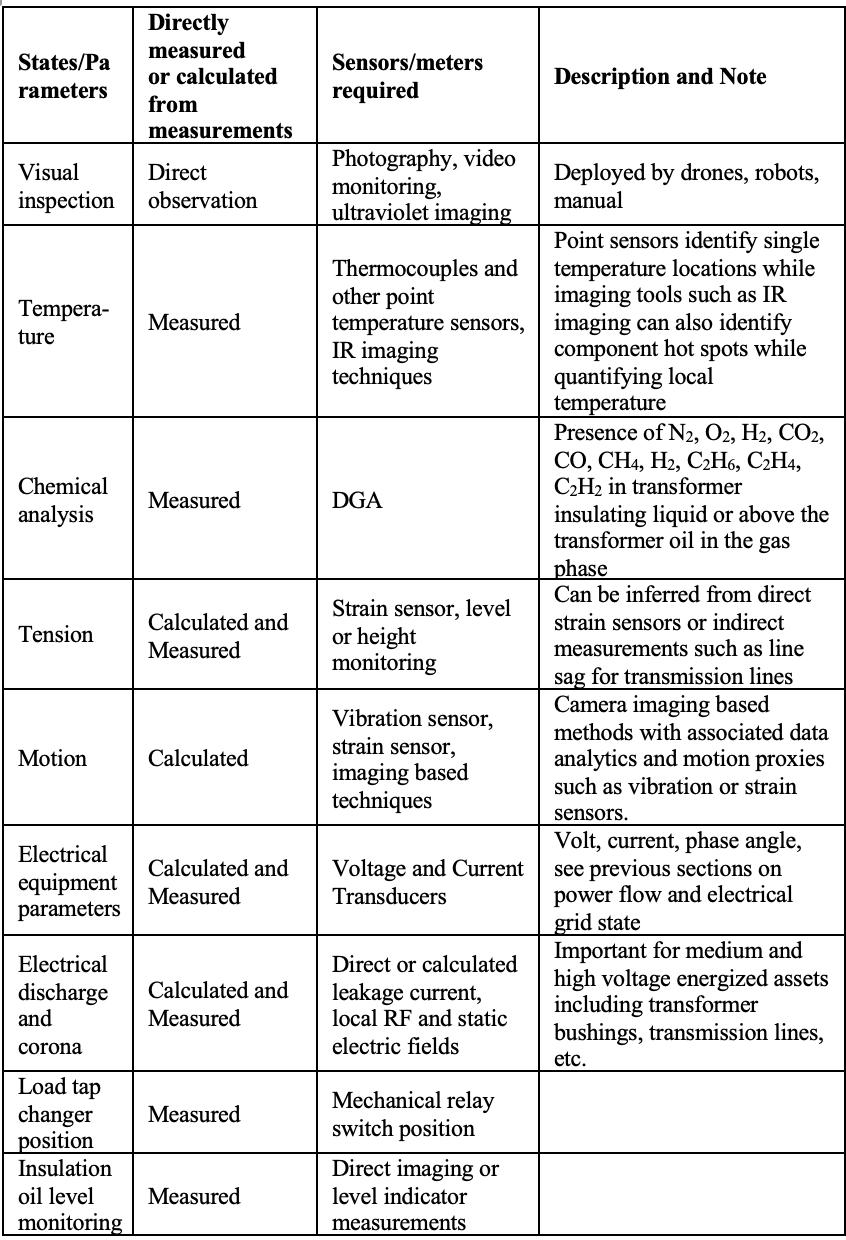
CapacityforMeasurementofAssets: Awiderangeofsensingandmeasurementtechnologiesarecurrentlyemployedforthe purpose of monitoring grid assets, Table 1. One prominent example is dissolved gas analysis (DGA) techniques, which are commonlyemployedfordiagnosingtheoperationalhealthandconditionofpowertransformers.
Transformerbushingsalsorepresentamajorsourceofcatastrophicfailureintransmissionsubstations,andmeasurementsof electrical parameters may be used to assess bushing health. Circuit breaker monitoring is another area in which existing technologysolutionscanbeidentifiedandcanincludegastemperature,pressure,andleakrateaswellasmechanicalsystems
Anumberofsensingandmeasurementtechnologyplatformsarecurrentlyunderdevelopmenttoaddressneedsintheareaof assetmonitoring.Forexample,theElectricPowerResearchInstitute(EPRI)hasdevelopedarobustsetofprogramsseekingto address sensing and measurement needs for transmission and substation applications. Examples of sensing technologies currentlyunderdevelopmentinclude:
(1) RF sensors to monitor a broad range of relevant parameters for conductors including disconnections, fault currents associated with lightning, geomagnetic induced currents, temperature and inclination, motion and vibration, and proximity andtamperingforsecurity;
(2) Optical diagnostic methods to monitor vibration and information about gas phase composition such as acetylene species surroundinghigh-temperaturebushings;
(3)Localhydrogenandotherchemicalcompositionsensorsforpowertransformers;and
(4)Unmannedaerialvehicleandroboticsystemsforinspectionofoverheadandundergroundtransmissionlines.
© 2022, IRJET | Impact Factor value: 7.529 | ISO 9001:2008 Certified Journal | Page1488
International Research Journal of Engineering and Technology (IRJET) e-ISSN:2395-0056
Volume: 09 Issue: 12 | Dec 2022 www.irjet.net p-ISSN:2395-0072
Table1.KeyStatesandParametersRelevantforElectricalTransmissionandDistributionSystemAssetMonitoringandFault Diagnosis.
A key challenge associated with new and emerging sensing and measurement technologies required for asset monitoring applications is the need for compatibility with electrically energized components. In the case of applications within the distributionsystem,costisalsoakeyfactorthatwilldrivenewtechnologydevelopmentfornewlowercostsensingsolutions.
For geographically dispersed grid assets ranging from components to transmission and distribution lines, deployment of unmannedaerialvehiclesinstrumentedwithon-boardsensing,imaging,ordiagnosticcapabilitiesorevenwithinterrogation anddata storageandmanagement capabilitiesforinterrogation oflocalizedsensors showsignificant potential forwidearea infrastructure monitoring. Similarly, application of satellite and wide area monitoring electromagnetic techniques, such as lidarandothers,isanticipatedtoseeincreasingdeploymentmovingintothefuture.
The monitoring requirements such sensor system may address can be grouped into two logical categories: “Functional Performance”and“HealthCondition”oftheassets.
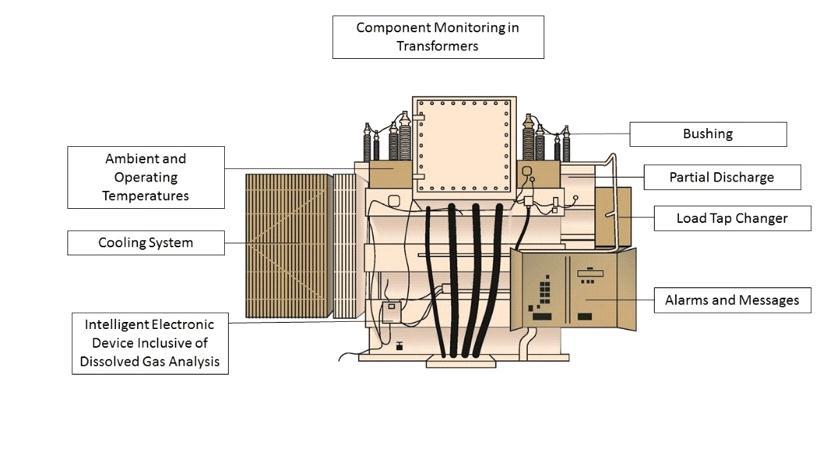
Functional Performance of Assets: As illustrated for a large electrical transformer, Figure 3, the parameters to be monitored for function performance are largely electrical properties such as voltage, current, phase angle, and frequency. These
© 2022, IRJET | Impact Factor value: 7.529 | ISO 9001:2008 Certified Journal | Page1489
International Research Journal of Engineering and Technology (IRJET) e-ISSN:2395-0056
Volume: 09 Issue: 12 | Dec 2022 www.irjet.net p-ISSN:2395-0072
parametersareusedtocalculateotherpowerparameterssuchasrealpower,reactivepower,harmonics,andpowerquality. Requirements for the accuracy,precision, and frequencyof measurements isdriven byhow theinformation will be used for operationandmaintenance ofthepowersystem. Insomecases,theusefulnessof themeasurementdependsonhow quickly the sensing and measurement data can be produced, integrated with other data, and converted to actionable knowledge. In other cases, the technical precision and accuracy of the measurement will be dominant. In all cases, particularly for distribution assets, the cost of the sensor will play a critical role in dictating the potential for widespread deployment and hencetheultimateimpact.
Such monitoring and analysis is costly and time-consuming because it requires manual sampling and laboratory analysis techniques,butthebenefitscanstilloutweighthecostsforlargepowertransformers,whichareinoperationfordecadesand representmajorsocial,economic,andopportunitycostsiftheymustbereplacedduetounanticipatedandoftencatastrophic failures.Inthecaseofparticularlycriticaltransformerassets,real-timediagnosticmethodshavebeendeveloped,suchas onlineDGA, but are far too expensive for widespread deployment. For lower voltage and power rated transformers such as distributiontransformers,evenconventionalDGAanalysistechniquesbecomecost-prohibitive.Assuch,lowercostandrobust sensing device solutions are of interest for real-time monitoring of the most important parameters associated with the dissolvedgases, includingspeciessuchasH2,CH4, acetylene, ethane, ethylene, N2, O2 CO, CO2,andothers.In additiontoDGA analysis, other sensors commonly employed for transmission transformers include bushings sensors, oil temperature and level,andtapelectricalgridinfrastructure.Inadditiontoelectricalparameters,physicalparameterssuchasposition(openor closed)ofswitches,reclosers,breakers,fuses,etc.,canalsobeconsideredrelatedtofunctionalperformanceofassets.
Health Condition of Assets: In some cases, the electrical parameters monitored for function performance can also provide usefulinformationaboutthehealthconditionoftheasset.However,electricalparametersareoften “laggingindicators”ofthe on-setofconditionsforwhichassetmaintenanceisrequired.Forthisreason,monitoringalternativetypesofparameterscan be morevaluable for providing an early indicator of conditions for which timely maintenancecan avoid impactson function performanceandextendtheoperationallifetimeofassets.Examplesofsuchmeasurementsincludechemical,mechanical,and thermal measurements and their changes with time, either abruptly or over extended time durations, which can reveal potentialhealthissuesofassetstoenablecondition-basedmaintenanceprograms.Prominentexamplesofparametersthatfall withinthiscategoryandtheirassociatedapplicationsincludethechemicalchangesthatoccurinthegasesaboveanddissolved withintheinsulatingoilforlargepowertransformersaswellasstrain,temperature,andsagmeasurementsonconductorsas theystretchandcontractwithchangesinweatherandelectricalloadingconditions.
Techniques,suchaslidarandothers,isanticipatedtoseeincreasingdeploymentmovingintothefuture.
International Research Journal of Engineering and Technology (IRJET) e-ISSN:2395-0056
Volume: 09 Issue: 12 | Dec 2022 www.irjet.net p-ISSN:2395-0072
An example of an envisioned smart grid communication network design [2] presented a view of the grid elements, componentsandapplications – along with information transfer requirements – ina sequence of diagrams, here asFigures 4 and5.
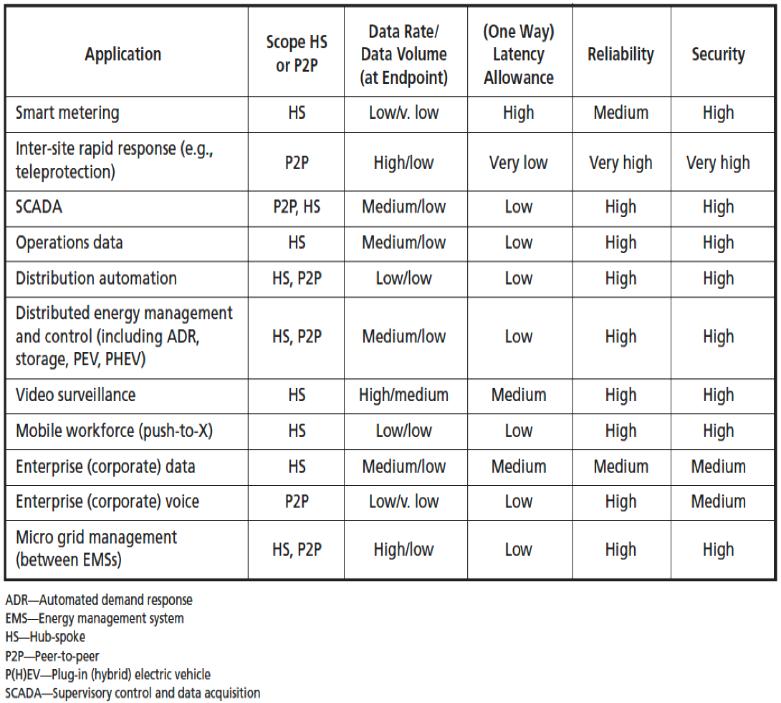
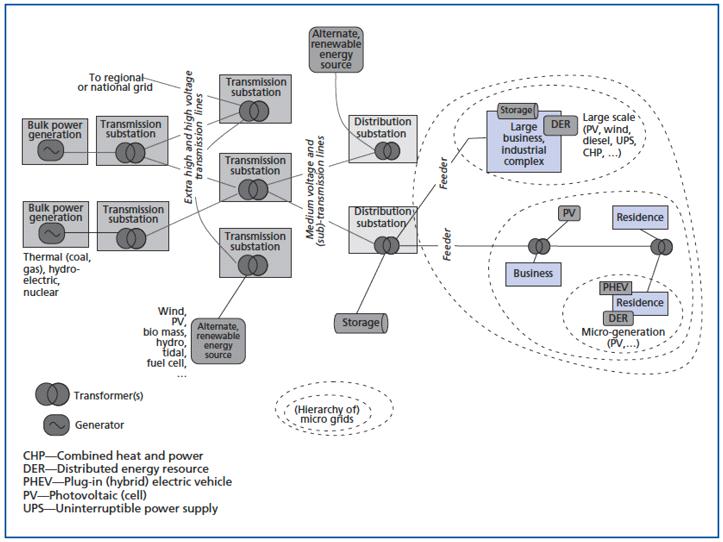
Figure4. Generation,transmissionanddistributionelementscomprisingthesmartgrid.
Figure5. Thecommunicationsrequirementsforthelogicalapplicationelementscomprisingthesmartgridarepresented alongwith“recommended”networktopologies.
Coupled with the network topology and communications requirements of Figure 5 are the companion latency requirements foravarietyofcentralsmartgridapplications,presentedasFigure6.
© 2022, IRJET | Impact Factor value: 7.529 | ISO 9001:2008 Certified Journal | Page1491
International Research Journal of Engineering and Technology (IRJET) e-ISSN:2395-0056
Volume: 09 Issue: 12 | Dec 2022 www.irjet.net p-ISSN:2395-0072
Figure6. Smartgridapplicationlatencyrequirements.
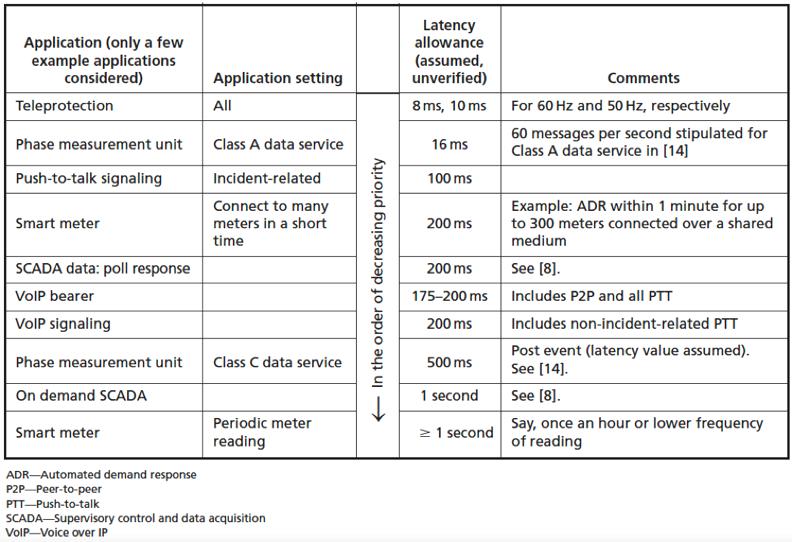
These tables provide targets for communications operation and performance that are valid for supporting sensor telemetry today(2022)–havingnotchangedsubstantiallyinthetenyearssincebeingdescribedin[3]. Suchacommunicationsystemis therebyabletotransportthemeasurementsfromthewidearrayofperiodicandaperiodicgridsignalsjustdescribed.
With respect to the electrical grid, the vast majority of transmission, generationanddistribution of energy is in the form ofa sinewaveoperatingat50or60Hz. Thevoltagelevelvariesdependingonutilityneedsrelyingontransformerstochangethe actuallevel. Analysisofthisoscillatoryperiodicsignal -sinewave-amplitude,frequencyandphasefollowstraditionalsignal transforms,mostnotablya Fourier Transform (andthevariantssuchas least-squares spectral analysis).
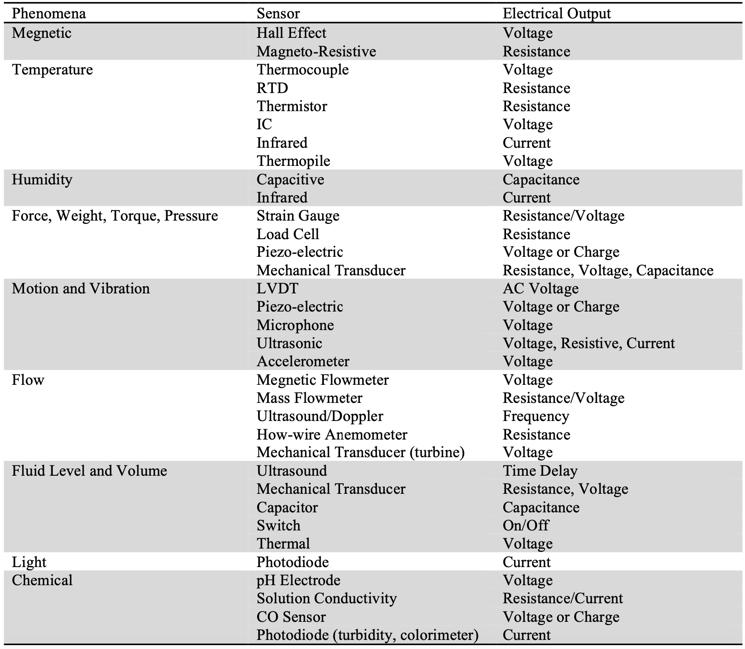
The applications and measurement "needs" outlined in the previously presented Tables and Figures are mostly involved in determiningthestatusandperformanceoftheutility'scomponentsandsystemsusedtogenerate,transmitanddistributethe electricity (aka, control). In essentially all electric utility measurements, the parameter of interest relies on some form of transductiontobeconvertedintoanelectricalsignal. AsynopsisofsuchparametersispresentedinTable2[4].
For this more broad scope of signals, the parameters of interest align more with aperiodic signals or perhaps the quasi- or almost- periodic signals. The transform analysis tools may still be applied to such signals – given certain functional requirementssuchasusingFourierintegralsratherthanFourierseries. Additionalclassictechniquesincluding wavelet analysis [5] and nonlinear dynamic analysis [6], used preferentially for acoustic characterization of aperiodic voices, may be applied to theanalysisofaperiodicelectricalgridmeasurements. Applying Time History Analysis [7] –atechniquethatisfrequentlyused intheanalysisofbuildings–maybeappropriateforaperiodicelectricalgridsignals.
International Research Journal of Engineering and Technology (IRJET) e-ISSN:2395-0056
Volume: 09 Issue: 12 | Dec 2022 www.irjet.net p-ISSN:2395-0072
Table2. Measurementparametersrelevanttoelectricutilityoperations[4].
With respect to AC electric grid voltage and related measurements, the analysis tools to be used are simple: the signal is periodic thereforethetransform-basedmathematicsareappropriate foruse. Similarly,foranalysisofthesignalsassociated withthesystemsandcomponents whichoperate the grid,thearrayof mathematical processes availableforaperiodicsignal analysisaretobeused. Itisworthwhiletorepeatthatafundamentaldifferencebetweenperiodicandaperiodicsignalsisthat anaperiodicsignalcannotberepresentedbyanysingularmathematicalequation. Withinthiscontext,anaperiodicsignalis a random signal which never repeats, which allows for a variety of other classical mathematical analysis techniques but eliminatesthepotential use ofthetypesofFourieranalysisthatisofuseforperiodicsignalsAsmaybeexpected,a complex system such as a system of assets within the electrical grid will require measurement of signals with a variety of structures, andnosignalanalysistechniqueswillbemostapplicableforeveryrequirement.
1.Adams,M."Continuous-TimeSignalsandSystems(Edition2.0)",Technology&Engineering,2020.
2. Bojkovic, Z. and Bakmaz, Bojan, "Smart Grid Communications Architecture: A Survey And Challenges," ACACOS'12: Proceedings of the 11th WSEAS international conference on Applied Computer and Applied Computational Science, April 2012.
3. Kenneth C. Budka, Jayant G. Deshpande, Tewfik L. Doumi, Mark Madden, and Tim Mew, “Communication Network ArchitectureandDesignPrinciplesforSmartGrids”,BellLabsTechnicalJournal15(2),205–228(2010)
© 2022, IRJET | Impact Factor value: 7.529 | ISO 9001:2008 Certified Journal | Page1493
International Research Journal of Engineering and Technology (IRJET) e-ISSN:2395-0056 Volume: 09 Issue: 12 | Dec 2022 www.irjet.net p-ISSN:2395-0072
4. "SensorCharacteristicsReferenceGuide",https://doi.org/10.2172/1095440,2013.
5. S.Mallat,"AWaveletTourofSignalProcessing,"2nded.SanDiego,CA:Academic,1999.
6. Jonathan Chambers1 And Trevor Kelly, "Nonlinear Dynamic Analysis – The Only Option For Irregular Structures", 13th WorldConferenceonEarthquakeEngineeringVancouver,B.C.,CanadaAugust1-6,2004PaperNo.1389.
7. "An Introduction To Linear And Non-Linear Time History Analysis", Canadian Society for Civil Engineering Vancouver Section,2008.https://www.caee.ca/files/Publications/Time-History-Analysis-Seminar.pdf
© 2022, IRJET | Impact Factor value: 7.529 | ISO 9001:2008 Certified Journal | Page1494