International Research Journal of Engineering and Technology (IRJET) e-ISSN:2395-0056

International Research Journal of Engineering and Technology (IRJET) e-ISSN:2395-0056
Bedi1, Adarsh Singh2, Avinab Sharma3 , Asst. Prof. Kajol Dahiya(guide)4
1Nalin Bedi, Dept. of Computer Science Engineering, Maharaja Agrasen Institute of Technology, Delhi, India
2Adarsh Singh, Dept. of Computer Science Engineering, Maharaja Agrasen Institute of Technology, Delhi, India
3Avinab Sharma, Dept. of Computer Science Engineering, Maharaja Agrasen Institute of Technology, Delhi, India 4Prof.Kajol Dahiya, Dept. of Computer Science Engineering, Maharaja Agrasen Institute of Technology, Delhi, India ***
Abstract - Many of the existing machine learning models for health care analysis are concentrating on one disease per analysis. Like one analysis if for diabetes analysis, one for cancer analysis, one for skin diseases like that. There is no common system where one analysis can perform more than one disease prediction. In this paper, weareproposingasystemwhich is usedto predict multiple diseases by using Flask API. This paper is used to predict Diabetes, Stroke, Breast Cancer, Fetal Health, Liver disease and Heart disease. Python pickling is used to save the model behaviour whenever required. The importance of this research paper analysis is while analysing the diseases all the parameters which causes the disease are included so that it becomes possible to detect the maximum effects which the disease will cause. For example for diabetes analysis in our system few parameters have been considered like age, sex, bmi, insulin, glucose, blood pressure, diabetes pedigree function and pregnancies. Final model’s file will be saved as python pickle file. Flask API is designed. When user accesses the user interface, the user has to send the parameters of the disease asked through forms created for each disease prediction. Flask API will invoke the corresponding model and returns the status of the patient.
Key Words: Flask API, machine learning, user interface,Picklefile,python
1.INTRODUCTION
Breast cancer, diabetes, heart disease, liver disease are for the most part driving reasons for death in the presentsociety.Heartdiseaseisageneraltermanditis also called cardiovascular disease, which means heart and blood vessel disease. Arrhythmias (issues with heart rhythm), coronary artery disease, and congenital heart defects are all diseases that fall under the category of heart illness (the defects of the heart you are born with). The cardiovascular disease normallyindicates heartattack,angina (heart pain), or stroke,alsoconditionsthataffectyourrhythmvalvesor musclesofyourheartalsoreferredtoasheartdiseases. Around 10 lakh patients of liver cirrhosis are newly diagnosedeveryyearinIndia.Liverdiseaseisthetenth most commoncauseofdeathinIndiaas pertheWorld HealthOrganization.Liverdiseasemayaffecteveryone
in 5 Indians. Liver Cirrhosis is the 14th leading cause of deathsintheworldandcouldbethe12thleadingcauseof deathsintheworldby2020.Thus,weareconcentratingon providing immediate and accurate disease predictions to the users about the symptoms they enter along with the disease predicted. In this system, we are going to analyze Diabetes,Heartdisease,Liverdisease,stroke,breastcancer and fetal disease analysis. To implement multiple disease prediction systems we are going to use machine learning algorithms.Pythonpicklingisusedto savethebehaviorof the model. This system analyses the diseases after taking as input all the possible parameters which cause the disease
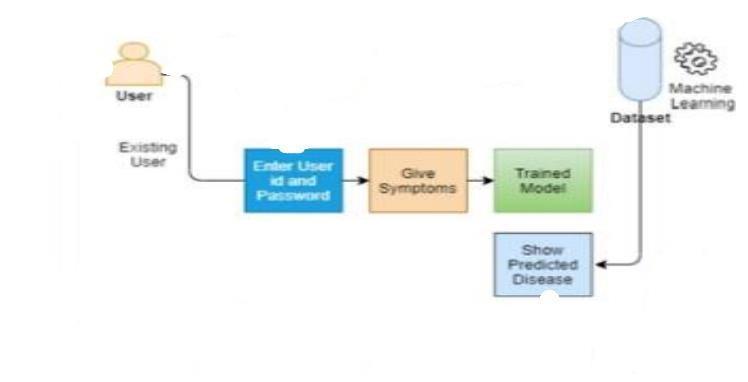
The existing systems in the health care industry are concerned withconsidering onlyonedisease prediction at a time. For example, one system is used to analyse diabetes, another is used to analyse breast cancer or stroke,andanothersystemisusedtopredictheartdisease. Maximum systems focus on one particular disease. Many models are deployed by organizations when they want to analyse their patient’s health reports. The approach used intheexistingsystemsareusefulforanalysingaparticular disease. Moreover, patients also spend a lot of money in consultingvariousdoctorsforvariousdiseasesdiagnosisin a single disease prediction system, which in turn is very expensive. In multiple diseases prediction system more than one disease can be analysed on a single website. The user doesn’t need to go to or browse different places in ordertopredictwhetherhe/sheisdisease-proneornot.In such a system, the user needs to select the name of the particular disease, enter its parameters and just click on submit. This would prove to be a cost effective solution. Thesuitablemachinelearningmodelwillbeinvokedandit wouldpredictwhether user is disease-prone or not anddisplayitonthescreenfortheuserontheinterface.
Manyofexistinganalysisinvolved 1331nalyzingparticular disease. One potential problem with a single disease prediction system is that it may not be able to accurately identify all potential diseases or conditions that a person may have. This is because different diseases can have similar symptoms, and a single prediction system may not
Volume: 09 Issue: 12 | Dec 2022 www.irjet.net p-ISSN:2395-0072 © 2022, IRJET | Impact Factor value: 7.529 | ISO 9001:2008 Certified Journal | Page1331
NalinInternational Research Journal
Engineering
Technology (IRJET) e-ISSN:2395-0056
Volume: 09 Issue: 12 | Dec 2022 www.irjet.net p-ISSN:2395-0072
be able to accurately distinguish between them. Additionally, a single disease prediction system may not be able to account for the complexity of an individual’s medical history or other factors that can affect their health. This could lead to inaccurate predictions and potentially harmful treatment plans. Another potential problem with a single disease predictionsystemisthatitmaynotbeabletoadaptto newdevelopmentsin medical research or changes in a person ’s health over time. This could lead to outdated orineffectivetreatmentrecommendations.
We have proposed a system that will flaunt a simple and elegant User Interface and also be time efficient . Our proposed system closes down the gap between doctors and patients which will help both classes of users to achieve their desirable outcomes. This system is used to predict diseases according to symptoms as well as the medical records of patients. This proposed system will take down several symptoms from the users and medical record readings evaluate after applying algorithms such as Decision Tree, Random Forest,NaïveBayes,LogisticRegressionandSVMwhich willhelpingettingaccurateprediction.Oursystemwill largedatasetswhichincludeslargediversityofmedical parameters to get more effective results and thus our system will improve and enhance the accuracy, diversityofpopulationtogetmoreeffectiveresultsand thus our system will improve and enhances the accuracy of the results. Along with the increased accuracy rate, we will proliferate the reliability of our system for this job and can gain the trust of patient in thissystem.Hencethissystem willcontributeineasier health management with better satisfaction to the users
1. G Naveen Kishore and few other authors proposed the work named Prediction Of Diabetes Using Machine Learning Classification Techniques proposed. In this work, various classification algorithms like SVM, Logistic Regression, Decision Tree, KNN, Random Forest are utilized on the 769 instances of the Pima dataset which contain features like Pregnancies, Blood pressure,bodymassindex,etc.Theyhavereportedthe highest accuracy as 74.4 %for the classification algorithm Random Forest and the lowest accuracy in thisworkisattainedbytheKNNreportedas71.3%.
2. In the work presented by M. Marimuthu, S. Deiva Rani,Gayatri.
R described the cardio diseases in a detailed manner andalsoappliedtheclassificationalgorithmslikeSVM, Decision Tree, Naïve Bayes, K-Nearest Neighbors on the Framingham dataset from Kaggle. The authors
compared various machine learning algorithms for the forecast of the risk of heart disease. The highest reported accuracyinthiswork is 83.60%forthe KNN classification algorithm.
3. Ch. Shravya, K.Pravallika, Shaik Subhani presented the work on Breast cancer prediction using Supervised machine learning techniques on the dataset and also analyzed the results with (PCA)principal component analysis and also used the dimensionality reduction and explainedinawell-manneredway.
•
The system has the ability to analyze the collected data to identify patterns and make predictions about a person's likelihood of developingcertaindiseases.
The user inputs the symptoms and other medical details/records for a particular disease and based on the trained model of the machine learning input the output will be displayed on theuserinterface.
The system has the ability to integrate with different machine learning frameworks and libraries to enable the use of state-of-the-art algorithmsandtechnique.
The system would be able to make predictions quickly and efficiently, with minimal delay or downtime.
The system should be user-friendly and easy to use, with clear instructions and intuitive interfaces for both medical professionals and patients.
The system would be scalable and able to handle large volumes of data without performancedegradation
2022, IRJET | Impact Factor value: 7.529 | ISO 9001:2008 Certified Journal | Page1332
International Research Journal of Engineering and Technology (IRJET) e-ISSN:2395-0056
Volume: 09 Issue: 12 | Dec 2022 www.irjet.net p-ISSN:2395-0072
Support vector machine (SVM) is a supervised learning algorithm for classification and regression tasks in machine learning. It is used to find the hyperplane in an N-dimensional space that maximally separates the classes.
TheworkingoftheSVMalgorithmisasfollows:
Step-1: SVMusesa kernel functiontotransformthedata into a higher-dimensional space where it can be separatedbyalinearboundary.
In the figure no 4.1 we have experimented on six diseases that is heart, diabetes, liver disease, stroke, fetalhealthandbreastcancer.Thefirststepistogather the dataset for heart disease, diabetes disease, liver disease, stroke, fetal health and breast cancer. We have extractedthePIMAIndianDiabetesdataset,Indianliver dataset, Stroke Prediction Dataset, Fetal Health ClassificationandBreastCancerWisconsin(Diagnostic) Data Set respectively. Once dataset is imported then visualization of each input data takes place. After visualization pre-processing of data takes place where checkingforoutliers,missingvalueswasdoneandthen datasetwassplitintotrainingandtesting.Nextisonthe training dataset we had applied knn, xgboost, Logistic Regression , Naive Bayes, Decision tree and random forest algorithm and applied knowledge on the classifiedalgorithmusingtestingdataset.Afterapplying knowledge we will choose the algorithm with the best accuracyforeachofthedisease.Thenwebuildapickle fileforallthediseaseandthenintegratedthepicklefile fortheoutputofthemodelonthewebpage
Step-2: Common kernel functions include the linear kernel, the polynomial kernel, and the radial basis function (RBF) kernel. The regularization parameter controls the complexity of the model and helps prevent over-fitting.
Step-3: Once the data is prepared and the hyperparameters are chosen, you can train the SVM model using the training set. This involves solving a quadratic optimization problem to find the hyper-plane with the largestmargin.
Random forests are a type of ensemble learning algorithm, which means that they combine the predictionsofmultipleindividualmodelstomakeamore accurate and stable prediction. In the case of random forests, the individual models are decision trees, which aretrainedonsubsetsofthetrainingdata.Theworkingof therandomforestisasfollows:
Step-1: Collectandpreprocessthetrainingdata.
Step-2: Select the number of decision trees to generate. Thisisahyper-parameteroftherandomforestalgorithm, and it determines the number of individual models that willbetrainedandusedtomakepredictions.
Step-3: Foreachdecisiontree:
• Generateabootstrapsampleofthetrainingdata. Thisinvolvesrandomlyselectingasubsetofthe training data, with replacement, to use as the trainingsetforthedecisiontree.
• Train a decision tree on the bootstrap sample. Thisinvolvesapplyingthedecisiontreelearning algorithm to the bootstrap sample to train a decisiontreemodel.
International Research Journal of Engineering and Technology (IRJET) e-ISSN:2395-0056
Step-4: To make a prediction using the random forest, feed the test data point to each of the trained decision trees, and use the majority vote of the individual decisiontreepredictionsasthefinalprediction.
Linear regression is a statistical technique that is used tomodeltherelationshipbetweenadependentvariable andoneormoreindependentvariables.Theworkingof LinearRegressionAlgorithmisasfollows:
Step-1: We need to choose an optimization algorithm such as gradient descent, and use it to find the coefficients that minimize the loss function. The loss functionmeasuresthedifferencebetweenthepredicted probabilityandthetruevalueofthedependentvariable.
Step-2: Thepredictedprobabilityiscalculatedusingthe sigmoid function, which maps the output of the linear regression model (a continuous value) to a probability between 0 and 1. The sigmoid function has an "S" shapedcurve,andtheoutputis1whentheinputisvery large, 0 when the input is very small, and 0.5 when the inputis0.
Step-3: Once the model is trained, you can use it to make predictions on new data. You can evaluate the performanceofthemodelusingevaluationmetricssuch asaccuracy,precision,recall,andF1score.
In the system breast cancer disease prediction model used Random Forest Classifier algorithm, diabetes predictionmodel usedRandomForestClassifier,stroke prediction model used Random Forest Classifier, liver prediction model used Random Forest Classifier, heart disease prediction model uses SVM algorithm and fetal disease prediction model uses the random forest algorithmasthesegavethebestaccuracyaccordingly.
ACCURACY FOR EACH DISEASE:
Table No 6.1: Diabetes Disease
ALGORITHM Accuracy
RandomForest 81.81% NaiveBayes 79.22%
Table No 6.2: Heart Disease
ALGORITHM Accuracy SVM 82.41%
Table No 6.3: LiverDisease
ALGORITHM Accuracy
RandomForest 74.35% GaussianNaiveBayes 68.37%
Table No 6.4: BreastCancer
ALGORITHM Accuracy
RandomForest 97.30% DecisionTree 90.35%
Table No 6.5: Fetal Health
ALGORITHM Accuracy
RandomForest 94.36% DecisionTree 91.72%
Table No 6.6: Stroke ALGORITHM Accuracy RandomForest 96.21% DecisionTree 96.16%
Volume: 09 Issue: 12 | Dec 2022 www.irjet.net p-ISSN:2395-0072 © 2022, IRJET | Impact Factor value: 7.529 | ISO 9001:2008 Certified Journal | Page1334
International Research Journal of Engineering and Technology (IRJET) e-ISSN:2395-0056
Volume: 09 Issue: 12 | Dec 2022 www.irjet.net p-ISSN:2395-0072
Fig No. 6.1 Diabetes Disease prediction UI
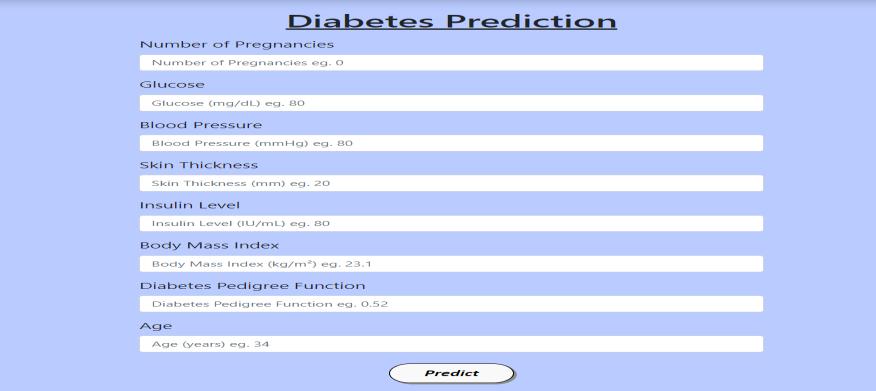
Fig No. 6.2: Fetal Health Disease prediction UI
Fig No. 6.2: Fetal Health Disease prediction UI
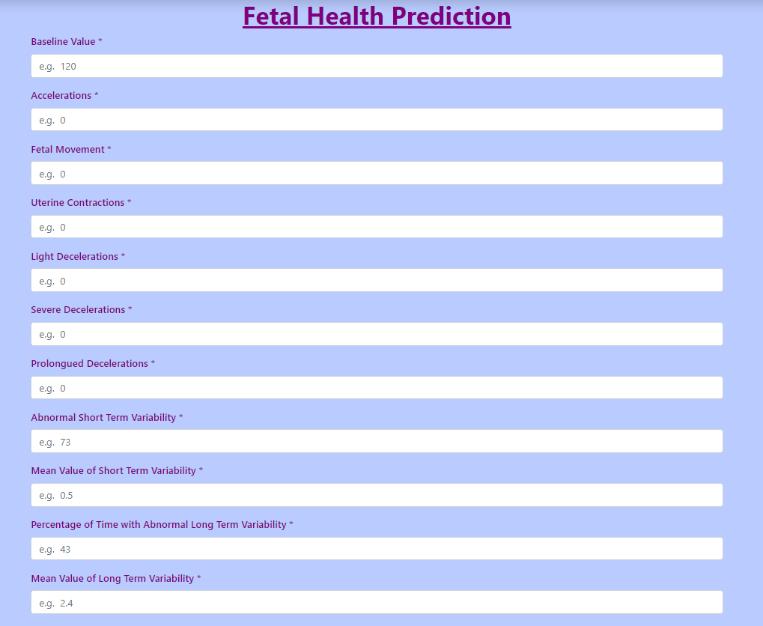
Fig No. 6.3: Heart Disease prediction UI
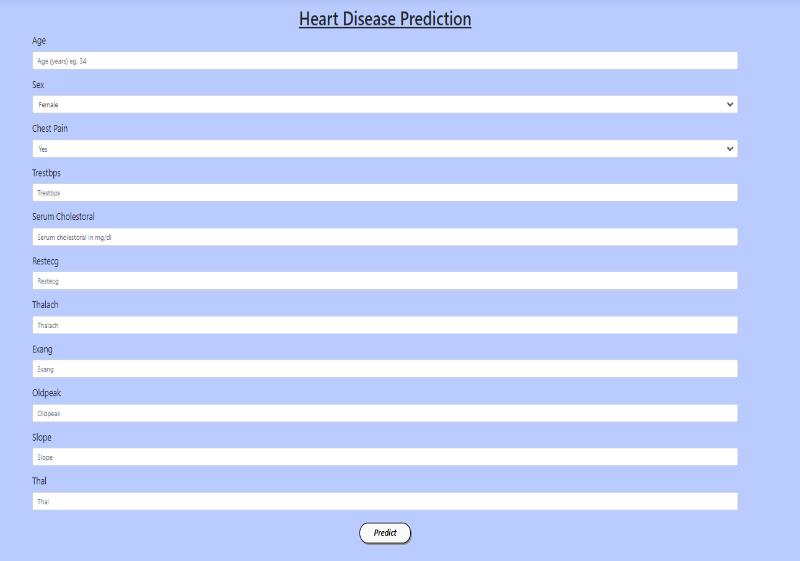
Fig No. 6.4: Stroke Prediction prediction UI
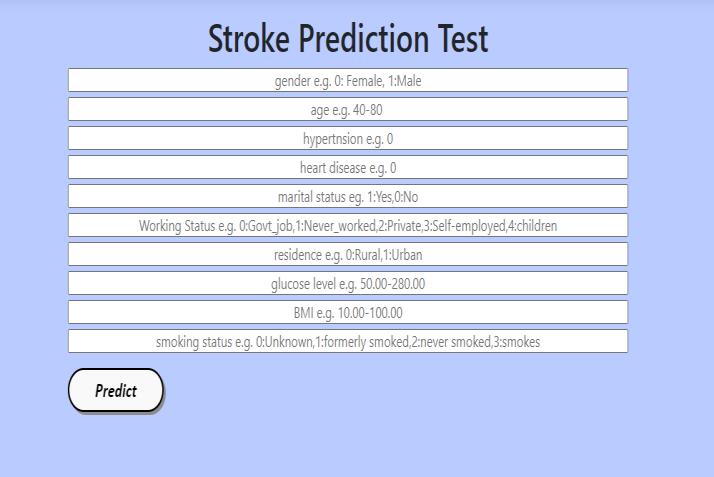
Fig No. 6.5: Breast Cancer prediction UI
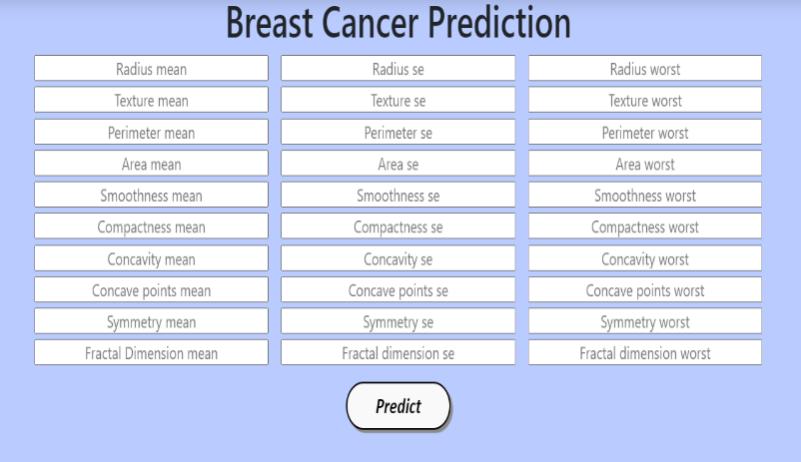
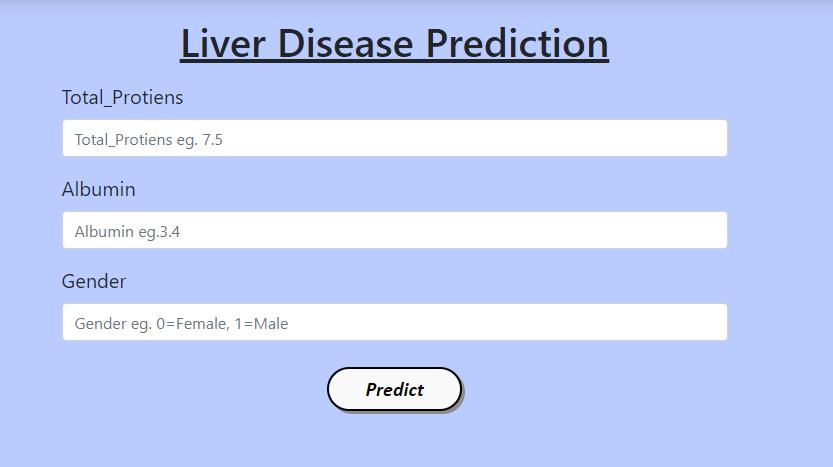
Fig No. 6.6: Liver disease prediction UI
© 2022, IRJET | Impact Factor value: 7.529 | ISO 9001:2008 Certified Journal | Page1335
International Research Journal of Engineering and Technology (IRJET) e-ISSN:2395-0056
The objective of multiple disease prediction is to identify individuals who are at high risk of developing multiple diseases. This information can help doctors to take a more proactive approach to treating and preventing disease, and can also help individuals to make lifestyle changes and take other preventative measures to reduce their risk of developing multiple diseases. By predicting multiple diseases, doctors can also develop more effective treatment plans for their patients,whichcanimproveoverallhealthoutcomes.
In the future we can add more diseases in theexistingAPI.
[4] Multi Disease Prediction System:- By- Divya Mandem, 1PG Scholar, Dept. of computer science and System Engineering(A), Andhra University College of EngineeringVishakhapatnam,AndhraPradeshB.Prajna ,Professor, Dept. of computer science and System Engineering(A), Andhra University College of EngineeringVishakhapatnam,AndhraPradesh.
We can try to improve the accuracy of predictioninordertodecreasethemortality rate.
Try to make the system user-friendly and provideachatbotfornormalqueries.
We sincere thank to our college Maharaja Agrasen Institute of Technology for giving us a platform to prepareaprojectonthetopic"HealthAnalyzerSystem" and would like to thank our HOD Dr. Namita Gupta for giving us the opportunities and time to conduct and research on the subject. We are sincerely grateful for Prof. Kajol Dahiya (CSE Department), as our guide for providing help during our research, which would have seemed difficult without their motivation, constant support, and valuable suggestion. Moreover, the complication of this research paper would have been impossible without the co-operation, suggestion, and helpofourfriendsandfamily.
[1]Archana Singh ,Rakesh Kumar, “Heart Disease Prediction Using Machine Learning Algorithms”, 2020 IEEE, International Conference on Electrical and ElectronicsEngineering(ICE3)
[2] A.Sivasangari, Baddigam Jaya Krishna Reddy,Annamareddy Kiran, P.Ajitha,” Diagnosis of Liver Disease using Machine Learning Models” 2020 Fourth International Conference on I-SMAC (IoT in Social,Mobile,AnalyticsandCloud)(I-SMAC)
[3]Yang, G.; Pang, Z.; Deen, M.J.; Dong, M.; Zhang, Y.T.; Lovell, N.; Rahmani, A.M. Homecare robotic systems for healthcare 4.0: Visions and enabling technologies.
IEEE J.Biomed.HealthInform.2020,24,2535–2549
Volume: 09 Issue: 12 | Dec 2022 www.irjet.net p-ISSN:2395-0072 © 2022, IRJET | Impact Factor value: 7.529 | ISO 9001:2008 Certified Journal | Page1336