International Research Journal of Engineering and Technology (IRJET) e-ISSN:2395-0056

Volume: 09 Issue: 11 | Nov 2022 www.irjet.net p-ISSN:2395-0072
International Research Journal of Engineering and Technology (IRJET) e-ISSN:2395-0056
Volume: 09 Issue: 11 | Nov 2022 www.irjet.net p-ISSN:2395-0072
1 M.E. Student, Department of Transportation Engineering, Shri G. S. Institute of Technology and Science, Indore, India
2 Assistant Professor, Department of Transportation Engineering, Shri G. S. Institute of Technology and Science, Indore, India ***
Abstract - Vehicle headway distribution models are frequently employed in traffic engineering domains because they succinctly convey the stochastic nature of traffic flows while reflecting the inherent uncertainty in drivers' car following maneuvers. In this study, we examined traffic flow studies that have been conducted in earlier research. The objective of the paper is to give a broad understanding of distribution modelsforvariouspassenger car unit(PCU)that rangesinvariedtrafficconditionsofroadways.Itisbeneficial to learn more about how headway distribution develops in various traffic situations. Begin by highlighting the key concerns raised in this study regarding headway variability, traffic congestion on the road, transportation planning, operations, and level of service. Some critics claim that the data for road capacity are used to calculate time headway. Based on the research, we examine various methods for connecting macroscopic models of vehicle headway distribution with microscopic models of driver behavior. We have covered the factors that contribute to headway variability,effects,andalternativedistributionformeasuring headway. We also discuss proactive and reactive methods for reducing headway variability in theory and practice.
Key Words: Headway, Traffic headway, Distribution model, capacityHeadwaydatacanbeusedtodeterminetrafficflowstability. Trafficflowstudyisoneofthefundamentalkeysthathelp trafficengineerstounderstandtrafficconditionsanddesign abetterwaytoregulateflow [1]. Butitisdifficulttoanalyse trafficcongestionwithdifferentlanesinwidthanddissimilar characteristics because traffic volume fluctuates at each location [2]. Theroadway'strafficstateismixedbecauseit contains vehicles of varied physical dimensions and other dynamic characteristics, such as two-wheelers, threewheelers,andsoon.Becauseofthesequalities,thevehicle doesnotmaintainlanedisciplineandoccupiesanylateral positionthroughouttheentirewidthoftheroute,resulting inmixedtrafficconditions [3]. Itisnecessarytoconducta headwaydistributionmodeltomakeabetterunderstanding oftrafficoperations.
Thedriver'sbehaviourisdescribedbyheadway.Thetime differencebetweentwosucceedingvehicleswiththesame
reference point is referred to as headway. It is usually calculated using the common attributes of the cars. As a result, it is critical in traffic engineering applications [4]. Thatvariesaccordingtotrafficconditions; thegreaterthe flowoftraffic,thelesstheheadway.Intrafficflowanalysis, definingtheheadwaydistributionfunctioniscritical.Itcan be utilized in traffic flow modelling and analysis [5]. It is necessarytodefineaheadwaydistributionpattern,which translates to density and flow, the two main traffic flow metrics [6]. The definition and measurement of these parametersundermixedtrafficconditionswithalackoflane disciplineisachallengingtask.Headwaycanbeanalysedas timeheadwayorspaceheadway [5].
Timeheadwayisthetimeintervalbetweensucceedingcars in a traffic flow, commonly measured in seconds [7]. The driver'sprojectionoftimeheadwayistypicallybasedonthe unanticipateddelayofthevehicledrivingaheadinthesame direction, which influences safety, level of service, driver behaviour,andthecapacityofaTransportationsystem [8]. Timeheadwayisanimportantstatisticintrafficflowtheory because it contains a lot of information about driver behaviour and acts as a bridge that connects drivers' vehicular activity to traffic flow [9]. Traffic managers can smooth the traffic flow and alleviate traffic congestion by analysingtimeheadwayfromtrafficrate [10]. Forexample, usingtimeheadwaydistribution,thetrafficflowratecanbe anticipatedbasedonthetrafficratebetweencars.According to probability theory, the advent of headway distribution modelshassimplifiedthedescriptionofuncertaintyintraffic flow and influences the opportunity for passing, merging, andcrossing,aswellasgoverningthesystem'scapacity [9].
Thesamepointsoftwoconsecutivevehiclesfollowingeach other are characterized as space headway [11]. Its values are critical for identifying traffic engineering issues and forecastingcongestion [10]. Itisoftenmeasuredasthetime lapsebetweenthefirstvehicle'sfrontbumpercrossingthe designatedlocationandthesecondvehicle'sfrontbumper crossing the same point [12]. Specifically, the physical distancebetweentheleadingvehicle'sfrontbumperandthe following vehicle's front bumper. it indicates the level of service, congestion, and the relationship to traffic density [3]. Theseareessentialmicroscopictrafficflowparameters thatinfluencecongestionandserveas adirectmeasureof density [9].
International Research Journal of Engineering and Technology (IRJET) e-ISSN:2395-0056
Volume: 09 Issue: 11 | Nov 2022 www.irjet.net p-ISSN:2395-0072
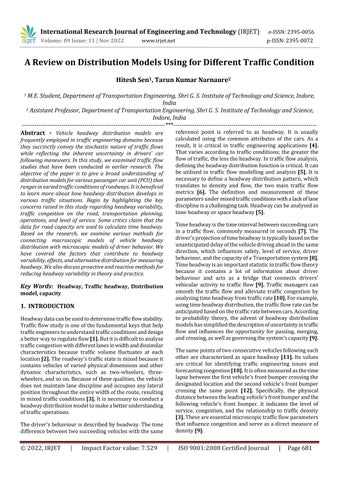
The main types of traffic models are microscopic, and macroscopic models consider the aggregate behaviour of trafficflow,andmicroscopicmodelsconsidertheinteraction ofindividualvehicles [11]. Infig.1,thetime-spacediagram highlighting each vehicle's route in both time and space, there are two vehicles, dx denotes the short length of the route.Thespeedsandheadwaysareeasilyvisible.
driver'sbehaviourandexplainstheproblematicpropertyof traffic flow which cannot be noticed by microscopic parameters [14]. Time headway is a bridge that links to macroscopictrafficflowandmicroscopictrafficflowsince thefundamentaldiagramun-expresslydependsonthetime headwayithasalsobeenproventhatthetimeheadwayis speed-dependentwhentrafficflowiscongested [9].
Theabilityofaroadtopassvehiclesperunitoftimeunder typical road and traffic conditions is referred to as its capacity. Statistics numbers can be used to calculate road capacity [10]. Lanewidth,lateralflexibility,roadalignment, surfacecondition,androad shoulderareall elementsthat influence road capacity [3]. The capacity of the road determinestrafficflow.Inordertocalculatethepassenger car unit (pcu) can be defined by the formula (Highway CapacityManual,2010).
MacroscopicIndicatorscharacterizetheflowoftrafficasa unit(system),toobtainanoperationalpictureofthewhole system.Example:Volume,speed,density.Volume,velocity, anddensityaremacroscopicmeasuresinwhichtrafficina giventimeintervalisrepresentedbyasinglevalueofeach thatformstheflowoftrafficasa whole [13]. Macroscopic modellingcollectstheentiretrafficstreamonaroadsection, intermsofthetrafficflowcharacteristicslikeflow,density, andmeanspeedsindicators [6]. Thefundamentalsoftraffic congestionsasaminimumheadwaybetweenthefollowing vehicleandthevehicletravelingaheadtodefineFreeFlow allthelargervaluesarepreferrediftrafficconditionspermit [13] as a single variable traffic rate is insufficient to determine traffic state since a certain value of flow to distinctdensityandspeedvalueintwocompletelydifferent flow States congested and un-congested [9]. Headway translatesto densityandflowwhichare twomacroscopic trafficflowparametersthatcanbeusedintheModellingand analysis of traffic flow studies [5]. However, it has been demonstrated that density may not properly indicate congestion because congestion is not likely to increase proportionallytotheincreaseindensity [6], [9]. Modelling ofheadwayisimportantduetothefactthatheadwayandits distributioncanaffectdifferentflowparametersincluding capacity,levelofservice,andsafety [6].
Microscopic Indicators characterize the behavior of each vehicle in the traffic flow that affects each other. Example headway,spacing,occupancy,gap,andclearance [13] Time headwayisoneofthemostimportantparametersintraffic flowtheorybecauseitindicatestheunpredictabilityofthe
C=Co.FCW.FCSP.FCSF.FCCS……………...(1.1) Where:
C=Roadcapacity(pcu/hour)
Co=Basiccapacity(pcu/hour)
FCW=Adjustmentfactorforroadwidth
FCSP=Adjustmentfactorfortrafficseparation
FCSF=Adjustmentfactorforsidefriction
FCCS=Adjustmentfactorforcitysize
Usingheadwaydata,trafficvolumesandroadcapacityare estimatedtoassessthenumberofvehicles.Trafficvolumes and road capacity are evaluated using headway data to examine the number of vehicles. Traffic volume includes elements such as traffic composition, traffic interruption, andlanedistribution.Trafficvolumeandtimeheadwayare two types of traffic statistics needed to determine road capacity [6]. Additionally,somedatasuchastrafficdensity andaveragetrafficspeed,forexample,trafficspeeddatacan be used to analyse traffic situations. The average speed dropsastrafficdensityincreases.Inthiscase,timeheadway canbeusedtodetermineamoredependablecapacity [15].
hm:hp/n……….…………..………………..…....(1.2)
Q:n/T=1/hm…..….………..………………..….(1.3) where:
hp = Time Headway of a vehicle (p) to a vehicle in front(second/vehicle)
hm=AverageTimeHeadway(second/veh)
Q=RoadCapacity(vehicle/second)
n=TotalNumberofVehiclesPassingaCertainPoint ofObservationduringtheperiodofT.
International Research Journal of Engineering and Technology (IRJET) e-ISSN:2395-0056
Volume: 09 Issue: 11 | Nov 2022 www.irjet.net p-ISSN:2395-0072
Inequation1.1,roadcapacityisexpressedasafunctionof basic capacity. The passenger car equivalent is utilizedto calculate this basic road capacity value. When the vehicle equivalent is used to calculate the fundamental road capacity, this result will undoubtedly differ. by Applying equations 1.2, and 1.3 the road capacity can be calculated usingtimeheadwayvalues [15]
Therehavebeenseveralresearcherswhosuggestedseveral theoretical models for describing headways some experiences in urban traffic indicate that hyper-Lang distributionisbesttodescribetheheadwaycharacteristics under mixed traffic Conditions [16] whereas negative exponentialdistributionexhibitsitscompatibilityoverawide range of traffic flow levels if the traffic consists of a substantialpercentageofsmallervehiclessuchasmotorized two-wheelers [1]. differentheadwaydistributionmodelsin thepassingandmiddlelanesinurbanhighwaysunderheavy trafficconditionsandconcludedthatlognormalandgamma modelsaresuitableinpassingandmiddlelanesrespectively [10] calibrate and examine the performance of various headwaymixedmodels.Thegoodness-of-fitwascheckedby the K-S test and the test result showed that the double displacednegativeexponentialdistributionmodelprovided thebestfittotheurbanfreewayheadwaydataandshifted lognormal distribution fits the general intention lane headways very well. Besides, several other mixed models havebeendevelopedandtestedovertheyearsinpredicting headway distributions; they are respectively combined normal distribution and shifted negative exponential distribution,combinednegativeexponentialdistribution,and shifted negative exponential distribution [17] the distributionofheadwayusinganonparametricmethodalong withtheGaussiankerneloveraparametricforthefreeway. ThenonparametricmethodwithGaussiankernelexhibited more suitability than the parametric method having a lognormal distribution to analyze the individual vehicle headway distribution for freeways [18] the log-normal distributionmodelisabetterchoicewhenfittingheadway data when the traffic is in free flow status; while the loglogisticdistributionmodelismoresuitableinfittingheadway datawhenthetrafficisincongestionstatus [19].Researchers havefoundthatthedischargeheadwayforvehiclesstanding in subsequent positions in a queue follows a lognormal distribution even if the headway of the first vehicle in a particular queue follows a normal distribution [14] There have been several reports concerning the development of headwaymodelsincludingLog-logisticdistribution,Gamma distribution,Betadistribution,Gaussiankernelsdistribution, person5,andperson6distribution,etc [19],[14],[18],[20].
Several researchers focused on obtaining more accurate distributionmodelsbycombiningbothmacroscopictraffic flow information and microscopic traffic flow information. Wangconsideredthatitisbettertousebothmacroscopicand microscopictrafficflowtheoryinpractice [9].
In an attempt to analyze time headway distribution at the microscopiclevelofthesixdifferentcontinuousdistribution models namely: Lognormal, beta, gamma, Weibull, exponential, and Log-logistic were selected to find an accuratemodelfortimeheadwaydistributionthegoodness offitwascheckedbyK-StestalsovisualizedbyPDFandCDF plot. The test result showed that the gamma and beta distributionwerefittedwithallthepositionsoftraffic [14].
Panichpapiboon investigated and characterized the timeheadway distributions of vehicles traveling on an urban expresswayinBangkok,Thailand,andconcludedthatGEV distribution is most effective in modeling time headway. whereas the exponential distribution was found to be the leasteffectivedistribution [1]. Thebetadistributionisgiving thebestfitinmostofthecaseswhereasBurrappearstobe suitableforrepresentingtimeheadwaydistributionforall densityrangesontwo-lanebi-directionalroadsundermixed traffic conditions. further, they found Log-person, Type 3, Inverse Gaussian, and Log-logistic to represent the speed and time headway distribution on a two-lane two-way highway(NH-31)atdifferentdensityranges [3]. However, analyzed the time headway and vehicle speed on urban roadsandinvestigatedtherelationshipbetweenthem.Based onthestudies,asaconclusionachievedthehighcorrelation between time headway and vehicle speed shows that the modelscanbeusedtodescribethedesiredtimeheadwaysat variousvehiclespeedsonTanke-Unilorin,andotherurban roads [21]. There have been several single distribution models of the time headway have been proposed for free flow,suchasPerson5,Weibull,Gamma-GQM,Johanson-SU, etc [7], [22]–[24].
Baseduponthereviewedliterature,anumberoftheexisting literaturehasfocusedonfindingoutthebest-fitdistribution ofspaceheadwayundervarioustrafficflowconditions [11] Thelog-normaldistributionandlog-logisticdistributionare suitable for high-flow traffic rates. Based on their observationsthecapacityspaceheadwayfollowsanormal distribution,whiletheobservedspaceheadwayfollowsalognormal distribution [24] However, zhang determined that the log-normal distribution is fit to observe the space headway [18]. the space headway data should be positive andtheLognormaldistributionfoundthebestfitofavailable data for evaluating the space headway that provides a reasonable approach to understanding the operational benefitsforsafetyandtrafficconcerns [4].
Appropriate for describing the relationship between time headway and traffic volume. That is well-fitted in heavy trafficflowanddeviatesforheadwaydistributionforeach vehiclepositionincongestion.Thevehiclerangeis800-1200 veh/hr. Asthenormaldistribution,theappropriateheadway distributionsignificantlyobservedheadwayvalueforeach vehicleposition [15].
International Research Journal of Engineering and Technology (IRJET) e-ISSN:2395-0056
Volume: 09 Issue: 11 | Nov 2022 www.irjet.net p-ISSN:2395-0072
Appropriatefordescribingtimeintervalsbetweenrandom events. Inter-arrival time of vehicles in low volume conditions. Whereas inappropriate condition when traffic becomescongested.Thevehiclerangeislessthan400veh/hr [8].
Appropriatetodescribehightrafficflowstate.Whereasless suitableintheconditionwhentrafficflowislowormedium. Well reflects traffic conditions when the congested state startsat1200up [7]
Appropriate in describing low and medium traffic flow conditions.Aswellasinappropriateinahigh-trafficstateand reflectsa decentfitfora rangeofflowonarterialsaround 600-1200veh/hr [10].
Appropriatefordescribinglowertrafficflowcircumstances. Whichisnotsuitableinpeakhourstraffic,thevehiclerangeis lessthan400-600veh/hr [20].
Appropriatefordescribingmixedtrafficconditions.Maintain higher time headway at low flow conditions. The vehicle rangeislessthan400-600veh/hr [1], [14].
GEV distribution is more flexible than the log-normal distribution and inappropriate in high-traffic flow. Appropriatewith800-1000veh/hr [1].
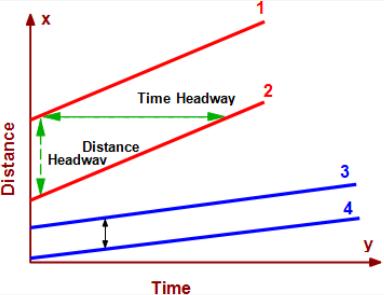
Asperthepreviousstudy Fig.2,thefitteddistributionmodel isasfollows:Thelognormaldistribution(3.670,3.206)with K-Sstaticis0.0840,theinverseGaussiandistribution(3.881, 5.975) with K-S static is 0.0846, the gamma distribution (1.501, 2.322) with K-S static is 0.1136, the exponential distribution (3.462) with K-S static is 0.1628, the normal distribution(3.692,3.557)withK-Sstaticis0.2065,andthe Erlang distribution ( The lognormal pattern is the best fit sincetheK-Sstaticof0.0840isthesmallestofthemalland smaller than the critical value (0.0876) with a level of significancea=0.05 [25].
Generally,boundariesoftrafficflowcanbedividedintothree states; namely low, medium, and high flow conditions. Accordingtopreviousstudies,themajorfeaturesofeachof theflowstatesareimpartedbelowthedistribution.
Headwayfollowsarandomprocessasthereisnointeraction betweenthearrivaloftwovehicles.Thearrivalofonevehicle is independent of the arrival of another vehicle. The minimum headway is controlled by safety measures with rangeoflowvolumeislessthan400veh/hr Inthiscondition of flow the exponential distribution can be used to model such flow. The exponential distribution has the worst performance it can fit fewer than 30% of the empirical distributions. The exponential distribution only performs well duringperiodswhenthetraffic isextremelylight [8], [20].
Some vehicles travel independently and some vehicles interact with other vehicles. Intermediate flow is more difficulttoanalyze,however,hasmoreapplicationinthefield withavolumebetween400-800veh/hr ThePearsonTypeIII distribution and Gaussian distribution as well as the lognormaldistributionarealsoabletomodelthistypeofflow sincethelognormaldistributioncanfitaround80%ofthe empiricaldistributions [18], [10]
Theflowisveryhighandisnearthecapacity.Thereisvery high interaction between the vehicle which were characterizedbynear-constantheadwayandthemeanand variance of the headway were very low with a volume between 800-1200 vec/hr The normal distribution and Erlangdistributionmodelcanbeusedinhigh-volumetraffic aswellasGEVdistributionisfoundappropriatemodelasthe GEVdistributioncancoverthebroadestrangeoftraffic,and more than 90% of the empirical distribution can be describedbytheGEVdistribution [1], [7].
International Research Journal of Engineering and Technology (IRJET) e-ISSN:2395-0056
Volume: 09 Issue: 11 | Nov 2022 www.irjet.net p-ISSN:2395-0072
distributionsareobservedinreviewstudiessuchastheK-S value for lognormal distribution is 0.1083, for Normal distribution value is 0.1398, for Gamma distribution, the valueofK-Sis0.1175,ForErlangdistribution,theK-Svalue is0.3419 andforInverseGaussianthek-svalueis0.4042, Forexponentialdistribution,theK-Svalueis3.462,Andfor GEV distribution the value of the K-S test is 0.1076.0[3], [26].
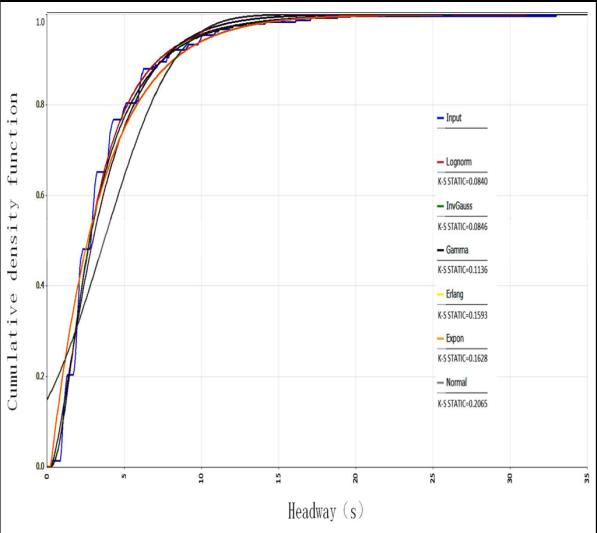
Fig.3Illustratesthepercentageoftheflowthateachtypeof distribution can fit for each class of traffic volume. This graphic shows the outcomes of Section A and Section B. SectionA.findingsarerepresentedwithsolidlines,whereas SectionB.resultsareplottedwithdottedlines.Fig.3clearly shows that the exponential distribution can only simulate low-volumeflows.Thelognormaldistribution,ontheother hand,performstheexponentialdistribution.Itcansimulate low-andmedium-volumeflows.TheGEVdistribution,onthe otherhand,canmodelflowoverawiderangeofvolumes.In reality,thepercentagesofflowsthatcanbepredictedbythe GEVdistributioninpracticallyalltrafficclassesarecloseto 100% in Section B. Furthermore, in the case of very highvolume traffic, the GEV distribution can model a large number of flows, whereas the other two types of distributionscannot [1]
Thestudyattempted to providea broadunderstanding of distribution models for various passenger car unit (PCU) that ranges in various traffic conditions of roadways, in order to learn more about how headway distribution developsinvarioustrafficsituations,thatoccurconsistingof varioustypesofvehicle movements thatare based on the correction factor of a Passenger Car Unit (PCU) vehicle. Headway is an essential traffic metric that can be used to predict traffic congestion. Because it is difficult to gather headwaydataduetoalackoflanediscipline,eachtypeof distribution is examined to determine how well it can predicttrafficflowatvariouslevelsoftrafficvolume.Some ofthedistributionsusedtomodel thestaticaldistribution that can effectively model headway include the Normal distribution, exponential distribution, Erlang distribution, Gamma distribution, and Log-normal distribution. The goodnessoffitofthesemodelsisdeterminedusingtheK-S test.TheK-Sstatisticreportedisalpha,wherealphaisthe reject level for the hypothesis. K-S should be a high value (Max=1.0)whenthefitisgoodandalowvalue(Min=0.0) whenthefitisnotgood.WhentheK-Svaluegoesbelow0.05, you will be informed that the Lack of fit is significant, the best-fitted distribution as per k-s values for different
Inthispaper,wepresentaliteraturereviewwithintendedto describeasimple,realisticdistributionmodeltocharacterize thetrafficflow.
1. Trafficflowishighlyflexibleinuniformconditions, dependingonthecapacityoftheroadways,different types of vehicles,driver behavior, and pedestrian characteristics, as well. The proportion of freely movingvehiclesislowinheavytraffic.
2. Some analysts have segregated data related to vehicleheadwayintoseveraltrafficflowcategories, whichisregardedasanappropriatedistributionfor analyzingtrafficconditions.
3. Headway models were developed based on the findingsofbackgroundreading.whereasignificant proportion of researchers have determined that improvingdistributionisthemostvaluablestrategy toimprovetrafficvariability.Thiswillbebeneficial in the future to headway controlstrategies and to increaseheadwayregularityforfurtheruse.
4. Thedistributionheadwayhasasignificantimpacton flow and capacity. A more exact estimationof distribution headways could reduce intersection delays.
5. A deviation from the conventional model and accordingly, the lognormal distribution fits for headway under lower traffic pressure circumstances, while the log-logistic distribution model is better for fitting headway data of peak hour,inhighertrafficpressure [19].
6. It was discovered that the limitation of flow level ratioconditions is shorter headway, which can be considered as mixed traffic. In mixed traffic situationswithvaryingflowscopesuptoalowlevel of volume-to-capacity ratio of 0.3, Erlang and exponential models were found adequate, while exponential and gamma models were found appropriateinmoderateandheavyflow [8].
7. Thesemodelscanalsobeemployedforautomatic controloftrafficflowtoreducetraveltime.
8. Thiswillleadtobettercontroloftrafficbehaviorto mitigatecongestionandimprovepublicsafety.
9. Thispaper,bysystematicallyandcomprehensively reviewing presents the headway distribution models,aswellassomecloselyrelatedmicroscopic andmacroscopictrafficflowmodels.
Basedonpreviousstudiesallintendedtodescribeaheadway distribution to determine Road capacity for traffic and variables.Insummary,headwaydistributionmodelsfillthe gap between macroscopic and microscopic models and combinetheiradvantages.
[1]S.Panichpapiboon,“Time-HeadwayDistributionsonan Expressway: Case of Bangkok,” 2014, DOI: 10.1061/(ASCE)TE.
[2]C.Cong,M.D.Student,S.Matsumoto,andK.Sano,“THE SPEED,FLOWANDHEADWAYANALYSESOFMOTORCYCLE TRAFFIC.”
[3]A.K.Maurya,S.Das,S.Dey,andS.Nama,“StudyonSpeed andTime-headwayDistributionsonTwo-laneBidirectional RoadinHeterogeneousTrafficCondition,”inTransportation Research Procedia, 2016, vol. 17, pp. 428–437. DOI: 10.1016/j.trpro.2016.11.084.
[4]S.HoomanGhasemi,M.Jalayer,M.Pour-Rouholamin,A.S. Nowak, and H. Zhou, “State-of-the-Art Model to Evaluate Space Headway Based on Reliability Analysis,” 2016, DOI: 10.1061/(ASCE)TE.
[5]M.Badhrudeen,V.Ramesh,andL.Vanajakshi,“Headway AnalysisUsingAutomatedSensorDataunderIndianTraffic Conditions,”inTransportationResearchProcedia,2016,vol. 17,pp.331–339.DOI:10.1016/j.trpro.2016.11.103.
[6]R.RoyandP.Saha,“Headwaydistributionmodelsoftwolaneroadsundermixedtrafficconditions:acasestudyfrom India,”EuropeanTransportResearchReview,vol.10,no.1, Mar.2018,DOI:10.1007/s12544-017-0276-2.
[7]IEEECommunicationsSocietyandInstituteofElectrical andElectronicsEngineers,2020InternationalConferenceon CommunicationSystems&Networks(COMSNETS).
[8]P.Saha,R.Roy,A.K.Sarkar,andM.Pal,“Preferredtime headway of drivers on two-lane highways with heterogeneoustraffic,”TransportationLetters,vol.11,no.4, pp. 200–207, Jul. 2019, DOI: 10.1080/19427867.2017.1312859.
[9]H. Li, Y. Zhou, Y. Xing, C. Zhang, and X. Zhang, “An improved mixed distribution model of time headway for urban roads based on a new traffic state classification method,”IEEEAccess,vol.9,pp.12635–12647,2021,DOI: 10.1109/ACCESS.2021.3051245.
[10] S. M. Abtahi, M. Tamannaei, and H. Haghshenash, “Analysis and modeling time headway distributions under heavytrafficflowconditionsintheurbanhighways:Caseof
International Research Journal of Engineering and Technology (IRJET) e-ISSN:2395-0056 Volume: 09 Issue: 11 | Nov 2022 www.irjet.net p-ISSN:2395-0072 © 2022, IRJET | Impact Factor value: 7.529 | ISO 9001:2008 Certified Journal | Page686
Isfahan,”Transport,vol.26,no. 4,pp.375–382,Dec.2011, DOI:10.3846/16484142.2011.635694.
[11] L. Vanajakshi, S. Subramanian, A. Salim, L. Vanajakshi,andS.C.Subramanian,“EstimationOfAverage Space Headway Under Heterogeneous Traffic Conditions
Hybrid electric vehicle View project Bus Travel Time PredictionusingVehicleLocationforAPTSApplicationsView project Estimation of Average Space Headway under HeterogeneousTrafficConditions,”2010.[Online].Available: https://www.researchgate.net/publication/228751966
[12] C.Wang,Z.Ye,E.Chen,andJ.Feng,“Spaceheadway calculationandanalysisatturnmovementtrajectoriesusing hybrid model,” Scientia Iranica, vol. 27, no. 6 A, pp. 2669–2679,Nov.2020,DOI:10.24200/sci.2019.21308.
[13] I.H.Hashim,“Analysisofspeedcharacteristicsfor rural two-lane roads: A field study from Minoufiya Governorate,Egypt,”AinShamsEngineeringJournal,vol.2, no.1,pp.43–52,2011,DOI:10.1016/j.asej.2011.05.005.
[14] S. Mondal and A. Gupta, “Queue-Based Headway DistributionModelsatSignalControlledIntersectionunder Mixed Traffic,” TranspResRec,vol.2674, no. 11, pp. 768–778,Sep.2020,DOI:10.1177/0361198120949876.
[15] W. Suweda, “TIME HEADWAY ANALYSIS TO DETERMINETHEROADCAPACITY,”2016.
[16] P. P. Dey and S. Chandra, “Desired Time Gap and TimeHeadwayinSteady-StateCar-FollowingonTwo-Lane Roads”,DOI:10.1061/ASCE0733-947X2009135:10687.
[17] G.Zhang,Y.Wang,H.Wei,andY.Chen,“Examining headwaydistributionmodelswithurbanfreewayloopevent data,” Transp Res Rec, no. 1999, pp. 141–149, 2007, DOI: 10.3141/1999-15.
[18] G. Zhang and Y. Wang, “A Gaussian kernel-based approach for modeling Vehicle Headway distributions,” Transportation Science, vol. 48, no. 2, pp. 206–216, 2014, DOI:10.1287/trsc.1120.0451.
[19] Intelligent Vehicles Symposium, 2009 IEEE. IEEE, 2009.
[20] R. Riccardo and G. Massimiliano, “An Empirical AnalysisofVehicleTimeHeadwaysonRuralTwo-laneTwowayRoads,”ProcediaSocBehavSci,vol.54,pp.865–874,Oct. 2012,DOI:10.1016/j.sbspro.2012.09.802.
[21] T. Ako, I. T. Yusuf, T. Ako, and I. T. Yusuf, “Time Headway and Vehicle Speed Studies of a Road Section in Ilorin, Nigeria Determination of Macroscopic Traffic Flow Characteristics on an Urban Arterial Using the Moving Car ObserverMethodViewprojectHighwayandTransportation ViewprojectTimeHeadwayandVehicleSpeedStudiesofa Road Section in Ilorin, Nigeria,” 2016. [Online]. Available: https://www.researchgate.net/publication/318209248
International Research Journal of Engineering and Technology (IRJET) e-ISSN:2395-0056 Volume: 09 Issue: 11 | Nov 2022 www.irjet.net p-ISSN:2395-0072
[22] E.RamezaniKhansari,M.Tabibi,andF.Moghadas Nejad, “A Study on Following Behavior Based on the Time Headway,”JurnalKejuruteraan,vol.32,no.2,pp.187–195, DOI:10.17576/jkukm-2020-32(2)-02.
[23] F. Habtemichael, L. de Picado Santos, and N. E. el Faouzi, “Parameters of time headway distribution as performance indicators of motorway traffic and driver behavior,”TranspResRec,no.2272,pp.152–160,2012,DOI: 10.3141/2272-18.
[24] J. Jang, “Analysis of time headway distribution on suburbanarterial,”KSCEJournalofCivilEngineering,vol.16, no. 4, pp. 644–649, May 2012, DOI: 10.1007/s12205-0121214-4.
[25] D. Kong and X. Guo, “Analysis of vehicle headway distribution on multi-lane freeway considering car-truck interaction,”AdvancesinMechanicalEngineering,vol.8,no. 4,pp.1–12,Apr.2016,
[26]DOI:10.1177/1687814016646673.D.KongandX.Guo, “Analysis of vehicle headway distribution on multi-lane freeway considering car-truck interaction,” Advances in MechanicalEngineering,vol.8,no.4,pp.1–12,Apr.2016,doi: 10.1177/1687814016646673.
2022, IRJET | Impact Factor value: 7.529 | ISO 9001:2008 Certified Journal