International Research Journal of Engineering and Technology (IRJET) e-ISSN:2395-0056

Volume: 09 Issue: 10 | Oct 2022 www.irjet.net p-ISSN:2395-0072
International Research Journal of Engineering and Technology (IRJET) e-ISSN:2395-0056
Volume: 09 Issue: 10 | Oct 2022 www.irjet.net p-ISSN:2395-0072
Navyashree. A. N1 , Dr B Santhaveerana Goud2 , Anusha.G3
1PG Student, Department of Civil Engineering, University Visvesvaraya College of Engineering, Karnataka, India. 2Professor of Civil Engineering, Department of Civil Engineering, UVCE, Bangalore University, Bengaluru, Karnataka, India.
3Research Scholars, Department of Civil Engineering, UVCE, Bangalore University, Bengaluru, Karnataka, India. ***
Abstract - Bangalorecityoriginallymetitswaterdemand from the lakes and rivers. The lakes and rivers that were once a source of water for irrigation, drinking, fishing is now usedasdumpingsites fordomesticsewage, domestic solidwaste.(AnkeshS.Betal.,2018).Thelakesofthecity are facing extinction due to pollution. Groundwater contamination is nearly always the result of human activity. Human activities like indiscriminate disposal of untreatedindustrialeffluentsandsewagewastes,dumping of solid waste, dumping of construction and demolition wastes into water bodies leads to groundwater contamination.Oneofsuchlakewhichisaffectedbythese humanactivitiesisBellandurlake.
Key Words: statusofwaterquality,Bangalore,Bellandur lake
Groundwater is a critical resource for people, economies, and the environment. The increase in population increases the demand and thus the exploitation (Smith et al. 2016). Globally 70 percentage of surface and sub-surface water is used for irrigation India is the largest user of groundwater in the world followed by China and USA. Many regions in India experiencing declining water tables due to over exploitationandill-managementoftheresources.According to the recent studies shows that 26% of the area of Karnataka State is under over exploited category. Due to this there is need to understand the processes by which uncontaminatedgroundwaterismadeavailable.
Theobjectiveofthisdissertationworkisasfollows:
A. To assess the impact of total dissolved solids (TDS) concentration on the groundwater system of Bellandur lakewiththehelpofVisualMODFLOWFlexSoftware.
B. To predict the future groundwater TDS concentration in the study area from the year 2019 to2030usingMT3DMSforthefollowingscenarios:
1. Ifthe present scenario oflakepollution without proper control measures continues for next 10 years, what will be the impact on the groundwaterqualitybytheendof2030
2. If industries meet TDS discharge of 2100 mg/l (IS-10500,2012) and no sewage discharge into the lake for next 10 years, what will be the impactonthegroundwaterqualitybytheendof 2030.
3. If the remedial measures such as STP with Integrated constructed wastelands and algae ponds to remove the nutrients meet TDS discharge of 500 mg/l (IS-10500,2012) for the next 10 years, what will be impact in the groundwaterqualitybytheendof2030.
Tosuggestremedialmeasurestoimprovethefuture groundwaterqualityofthestudyarea.
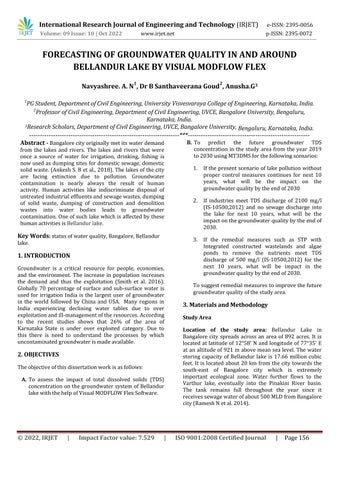
Location of the study area: Bellandur Lake in Bangalore city spreads across an area of 892 acres. It is locatedatlatitudeof 12°58ʹN andlongitudeof77°35ʹ E atanaltitude of 921m abovemeansea level.The water storing capacity of Bellandur lake is 17.66 million cubic feet. It is located about 20 km from the city towards the south-east of Bangalore city which is extremely important ecological zone. Water further flows to the Varthur lake, eventually into the Pinakini River basin. The tank remains full throughout the year since it receivessewagewaterofabout500MLDfromBangalore city(RameshNetal.2014).
1) Improper sewage system due to which untreated sewage overflows and joins storm water drains, mixes with rain water, which in turn flows to Bellandurlake. 2) Lack of effluent treatment plants to treat industrial wastes from small factories which also get into the storm water drains (https://bengaluru.citizenmatters.in/all-you-needto-know-about-bellandur-lake-and-its-problems)
Figure2:Locationofthestudyarea.
Bellandur lake is highly polluted with sewage and in May 2015 the foam covering the water surface caught fire and burned for hours making international headlines.The lake has since caught fire multiple times including in January 2018,andMarch2021butin1970speoplefromasmanyas 18villagesdependedonthewatersofBellandurtanktolead theirlives
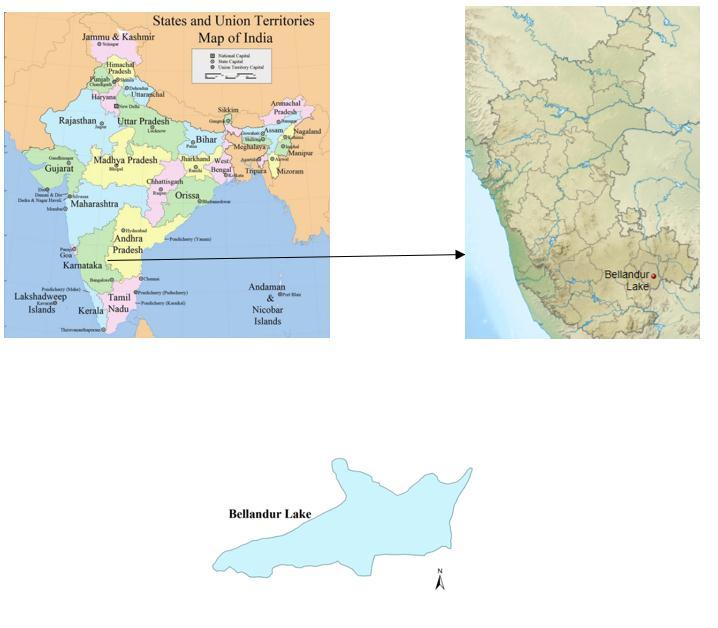
There are some issues regarding with Bellandur lake because of entry of untreated sewage into the lake through various inlets. Stormwater drains was designed for flow of clean rainwater from Koramangala and Challaghatta (K&C) Valley to Bellandur lake. However, the lake gets sewage inflowduetothesereasons.
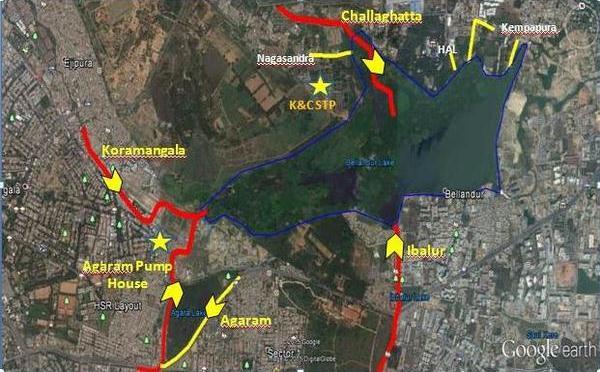
Figure3:Representationof fourmaininletsfromwhere sewageentersBellandurlake.(PicSource:BWSSB)
Preparation of Base Map Base map of the study area was taken from google earth pro. It was converted into .SHPformatwiththehelpofArcGIS.
International Research Journal of Engineering and Technology (IRJET) e-ISSN:2395-0056
Volume: 09 Issue: 10 | Oct 2022 www.irjet.net p-ISSN:2395-0072
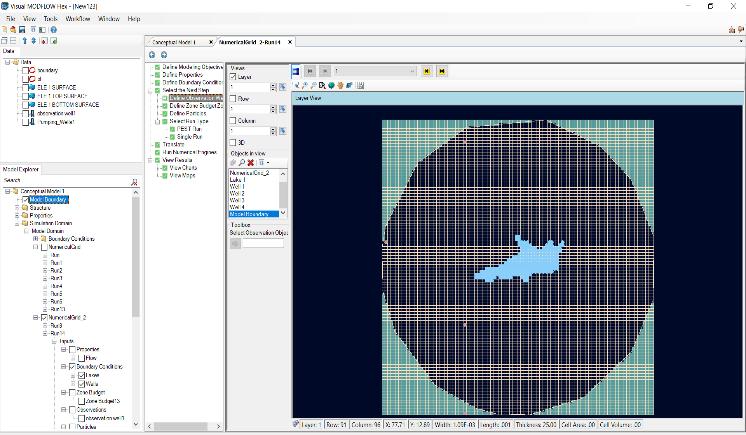
Figure 5: ModelScreenwithstudyboundary,lakeboundary andinactivecells
Assigning Layer Elevations (Above Mean SeaLevel): Here three layers were considered throughout the study area. Top erosional ground level (GD) layer, shallow weathering layeraslayer-1andthebottomlayerwasnamedaslayer-2. The top layer is shallow weathered zone of thickness 25 m and the bottom layer is deeper fractured rock with thickness of 225 meters. By using Google Earth Pro, the elevationdataforalllayerswereobtained.Itwasenteredto themodelusingthesurfergridfilein.GRDformat.
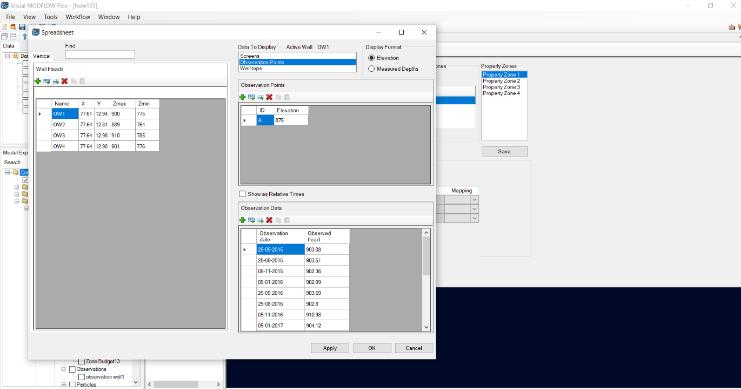
Visual MODFLOW allows to input field observations for head, concentration and relate these observations to model outputvalues.
MODEL RUN- After completing the input parameters, run model isselected from the screen. By selecting [Run] in the Main Menu, Select Run Type dialogue box appears, the modelwasrun
Modflow output provides graphs of calculated vs observed headsandvelocityvectors.
SHOWING
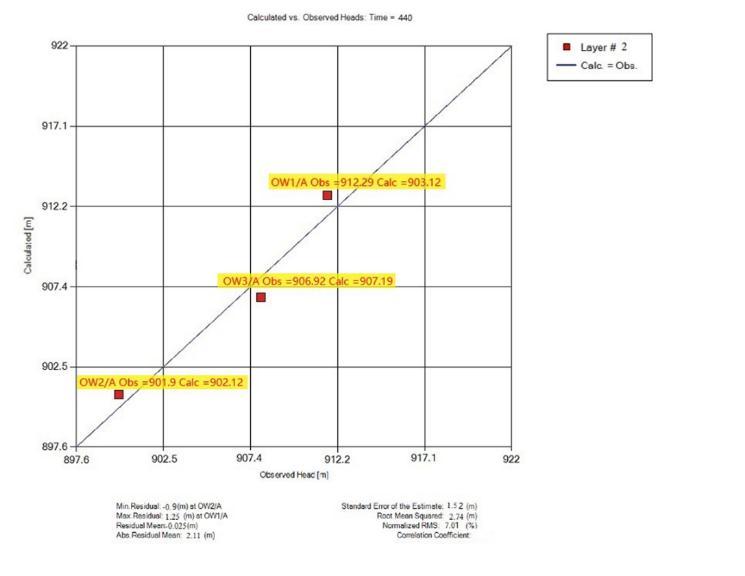
The calibrated chart for the 440th day showed good matchbetweentheobservedheadinthefieldversusthe model calculated head values. The standard error of estimationwas1.52mandtherootmeansquaredvalue was2.74mwhichimpliestheerroroflessthan5%.
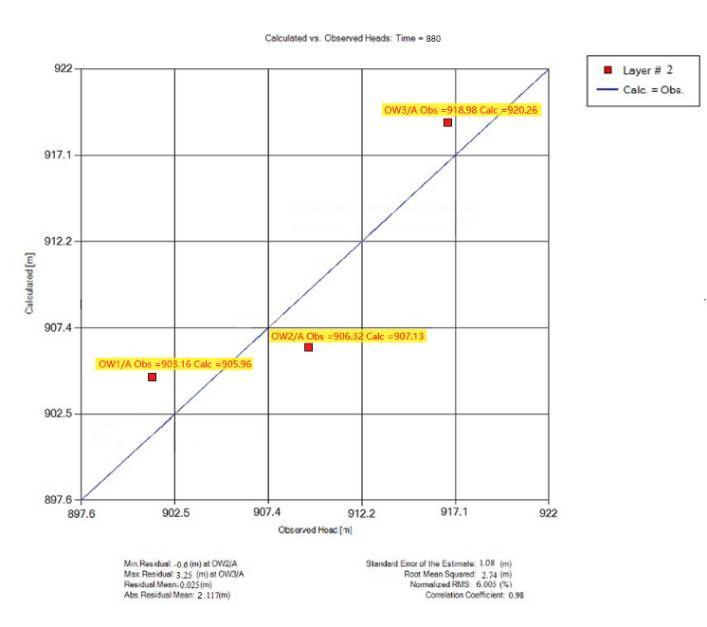
Figure7:CalculatedVsObservedgroundwaterlevel (aboveMSL)forthe440days CHART SHOWING CALCULATED VS OBSERVED HEADSFOR880DAYS
The calibrated chart for the 880th day showed good matchbetweentheobservedheadinthefieldversus the model calculated head values. The standard error of estimationwas1.08mandtherootmeansquaredvalue was2.74mwhichimpliestheerroroflessthan5%.
Figure-8:CalculatedVsObservedgroundwaterlevel (aboveMSL)forday880th day
International Research Journal of Engineering and Technology (IRJET) e-ISSN:2395-0056
Volume: 09 Issue: 10 | Oct 2022 www.irjet.net p-ISSN:2395-0072
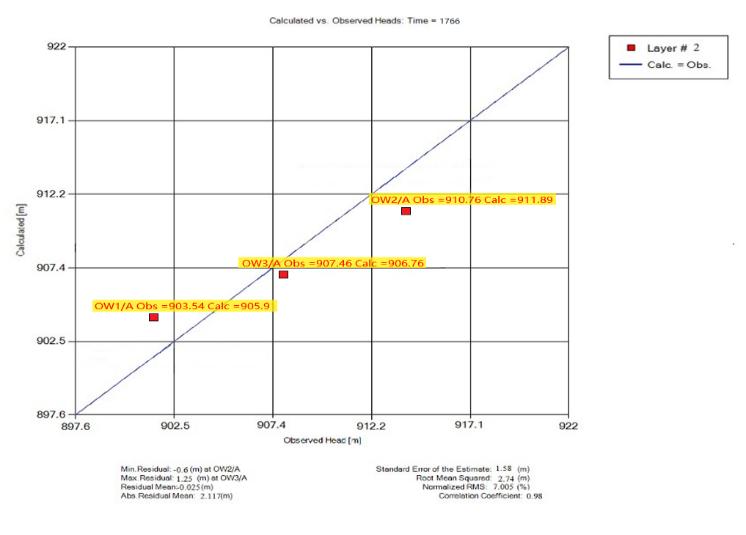
CHART
Thecalibratedchartforthe1766thdayshowedgoodmatch between the observed head in the field versus the model calculated head values. The standard error of estimation was 1.58 m and the root mean squared value was 2.74 m whichimpliestheerroroflessthan5%
Figure9:CalculatedVsObservedgroundwaterlevel(above MSL)forthe1766days
Particles are assigned on the boundary of the study area coveringsourceofpollution
Modpath Output
The output from the MODPATH includes the particle pathline direction of the groundwater which was towards the northeastdirectionofthestudyarea.
MT3DMS output provides calculated versus observed TDS concentrationgraph
The Calibration of the model is done by adjusting the dispersionvaluesbytrial-and-errormethod.
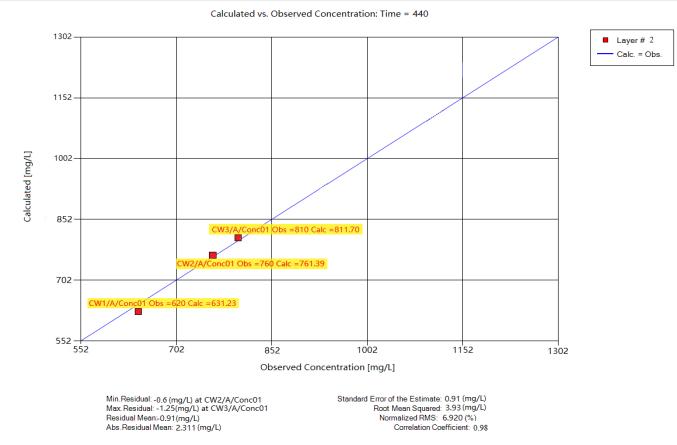
CHART SHOWING CALCULATED VS OBSERVED CONCENTRATIONSFOR440DAYS
The calibrated chart for the 440th day showed good match between the TDS concentration that was observed in the fieldversus the model calculatedTDSconcentrationvalues. The standard error of estimation was 0.91 mg/L and the root mean squared value was 3.93 mg/L which implies the erroroflessthan5%
Figure10:CalculatedVsObservedGroundwater Concentration(mg/L)forthe440days.
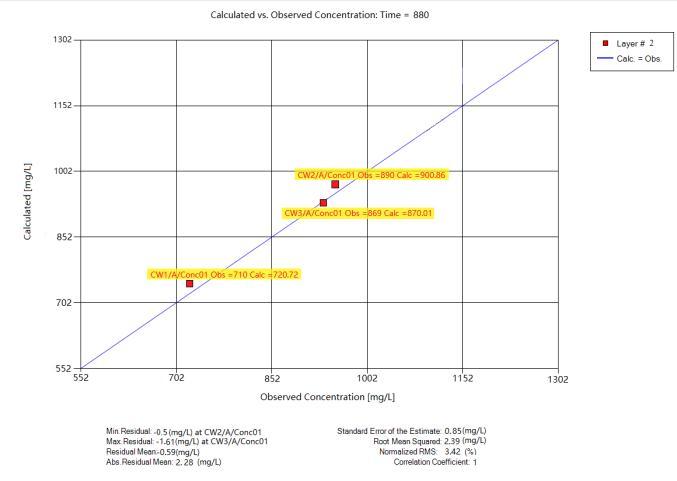
The calibrated chart for the 880th day showed good matchbetweentheTDSconcentrationthatwasobserved in the field versus the model calculated TDS concentration values. The standard error of estimation was 0.85 mg/L and the root mean squared value was 2.39mg/Lwhichimpliestheerroroflessthan5%.
Figure-11:CalculatedVsObservedGroundwater Concentration(mg/L)for880days.
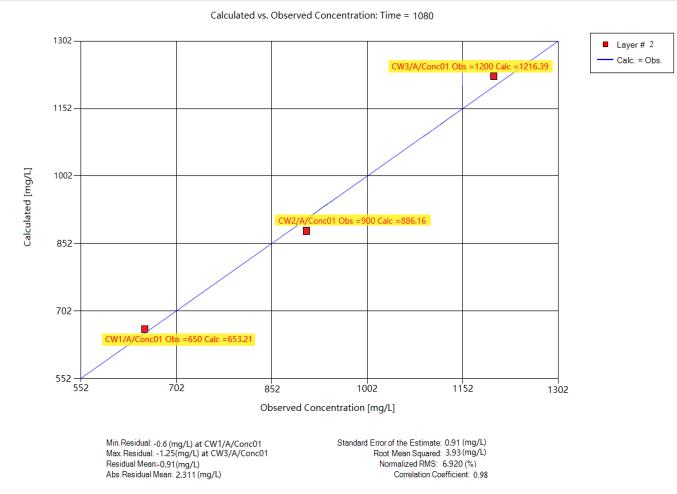
CHART SHOWING CALCULATED VS OBSERVED CONCENTRATIONSFOR1080DAYS
The calibrated chart for the 1080th day showed good matchbetweentheTDSconcentrationthatwasobserved in the field versus the model calculated TDS concentration values. The standard error of estimation was 0.91 mg/L and the root mean squared value was 3.93mg/Lwhichimpliestheerroroflessthan5%
International Research Journal of Engineering and Technology (IRJET) e-ISSN:2395-0056
Volume: 09 Issue: 10 | Oct 2022 www.irjet.net p-ISSN:2395-0072
TDS concentration in mg/L
Figure-12:CalculatedVsObservedGroundwater Concentration(mg/L)for1080days
The TDSconcentrationispredictedinthe studyarea under threedifferent Scenario.Predictionisdonefor10years i.e., fromtheyear2020to2030.threewellsaroundtothestudy areawereconsideredandtheirimpactonthegroundwater wasstudied.threewellsarelocatedatAdugodi,HSRLayout, Indiranagar.
ThethreeobservationwellslocatedatAdugodi,HSRLayout, Indiranagar for the above three scenarios the forecasting is beenpresentinbelowfigures12,13and14respectively.
TDS concentration in mg/L
1000
800
600
400
200
1200 2010 2015 2020 2025 2030 2035
Time in years
Scenario 1 Scenario 2 Scenario 3
1000
800
Figure12:ForecastedvaluesofTDSconcentrationin groundwateratADUGODI,till2030forallthethree differentscenarios
600
400
200
1200 2010 2020 2030 2040
0
Time in years
Figure13:ForecastedvaluesofTDSconcentrationin groundwateratHSRLAYOUT,till2030forallthethree differentscenarios
TDS concentration in mg/L
1000
800
600
400
200
0
1200 2010 2015 2020 2025 2030 2035
Time in years
Scenario 1 Scenario 2 Scenario 3
Figure14:ForecastedvaluesofTDSconcentrationin groundwateratIndiranagara,till2030forallthethree differentscenarios.
Scenario 1 Scenario 2 Scenario 3 0
The following conclusions can be drawn from the study basedontheresultsobtainedaftersimulatingthemodel:
TheoutputfromtheMODFLOWshowsthatthehead (groundwaterlevel)usedforthecalibrationandthe validation step has a good match between observed values and model calculated values for all the three observationwells.
ThedirectionofgroundwaterflowisfromtheSouthWest to the East direction, following the gravitational flow from the higher elevation in the Southwestdirectiontowardsthelowerelevationon Eastdirectionofstudyarea.
International Research Journal of Engineering and Technology (IRJET) e-ISSN:2395-0056
Volume: 09 Issue: 10 | Oct 2022 www.irjet.net p-ISSN:2395-0072
The output from the MT3DMS model shows the TDS concentration of groundwater at all the three concentration wells considered to have a good match with the observed and model calculated TDS values for bothcalibrationandvalidationsteps.
The prediction of the model for the three scenarios are asfollows:
1. The well COBS1 is located in ADUGODI. The borewell is 5.86 kms away from the lake. By the year 2030, if the present scenario continues the TDS concentration will increase up to 800 mg/L. For scenarios 2, the TDS concentration will reach up to 1150 mg/L and for scenario 3 the TDS concentrationwilldecreaseupto400mg/l.
2. The COBS2 borewell is located at HSR layout. It is 2.92 km away from the lake. By the year 2030, if the present scenario continues the TDS concentration will increase up to 890 mg/L. For scenarios2,theTDSconcentrationwillreachupto 1180 mg/L and for scenario 3 the TDS concentrationwilldecreaseupto410mg/l.
3. TheCOBS2borewellislocatedatIndiranagara.Itis 5.36 km away from the lake. By the year 2030, if the present scenario continues the TDS concentration will increase up to 900 mg/L. For scenarios2,theTDSconcentrationwillreachupto 1170 mg/L and for scenario 3 the TDS concentrationwilldecreaseupto390mg/l.
Predictions for scenario 2, showed that the TDS concentration in groundwater will increase from which it can be concluded that STP are not functioning properly and also improper discharge industrial effluents and sewage water into the lake concludeseffectonthegroundwatersystem.
4. Forfrothingandfireissuebanphosphorususe in detergents or regulate detergents with phosphorous in the market which can reduce eutrophicationandminimizesthefrothing
Akshatha M(2015) All you need to know about Bellandur Lake and its problems | Citizen Matters, Bengaluru. https://bengaluru.citizenmatters.in/allyou-need-to-know-about-bellandur-lake-and-itsproblems
Arun Kumar G.P, Dr. M C Sampath Kumar (2021), Basic Studies on Reclamation of Bellandur Lake, Ijariie-Issn(O)-2395-4396Vol-7Issue-32021.
CGWB(2018),AquiferssystemofKarnataka.
CPCB(2017),statusofgroundwaterqualityinIndiaPart1,groundwaterqualityseries,GWQS.
https://bangaloremirror.indiatimes.com/bangalore /others/bellandur-a-warning-bell-forbengaluru/articleshowprint/57238208.cms?prtpage =1
Jambhava Samavedamuni Chandrashekar R.K. Somashekar (2013), Impact of urbanization on Bellandur Lake, Bangalore - A case study. August 2003JournalofEnvironmentalBiology24(3):223-7.
Parvathi K S, Shivani P Kumar, Vikash Kumar Gupta (2018), Evaluation of Water Quality in BellandurLake.InternationalJournalofEngineering Technology Science and Research IJETSR www.ijetsr.comISSN2394–3386Volume5,Issue1 January2018.
By adopting the remedial measures (scenario 3), it was seen that the TDS concentration had been significantly reduced. Remedial measures that couldbeadoptedare
1. No more untreated sewage diversion to the lake
2. Enforcement of Polluter pays Principle which is to ensure zero discharge through effluent treatmentplants.
3. Decentralized treatment of sewage a model similar to Jakkur lake (STP with constructed wetlandsandalgalponds)
Ramachandra.T.V, Sudhira.H.S, Karthik.B, Avinash.K.G(2008), Environmental Impact of Developmental Activities in the Bellandur Lake catchment. Centre for Ecological Sciences, Indian InstituteofScience,Bengaluru.
Ramesh. N, Krishnaiah. S (2014) Water Quality Assessment of Bellandur Lake in Bangalore City, Karnataka, India. International Journal of Engineering Research & Technology (IJERT) ISSN: 2278-0181Vol.3Issue3,March–2014.
Sushant Kumar, M. K. Choudhary, T. R. Nayak (2017), GroundwaterModellinginBinaRiverBasin, India using Visual Modflow. IJSRD - International Journal for Scientific Research & Development| Vol. 5,Issue05,2017|ISSN(online):2321-0613
International Research Journal of Engineering and Technology (IRJET) e-ISSN:2395-0056
Volume: 09 Issue: 10 | Oct 2022 www.irjet.net p-ISSN:2395-0072
T V Ramachandra, Durga Madhab Mahapatra, Vinay Shivamurthy, Sudarshan Bhat(2017), Bellandur and Varthur Lakes Rejuvenation Blueprint. https://www.researchgate.net/publication/319https:/ /www.researchgate.net/publication/319103759
V Hariharan and M Uma Shankar (2017), Areviewof Visual MODFLOW applications in groundwater modelling.IOPPublishing14thICSET-2017.
Waterloo hydrogeologic Inc “Visual MODFLOW flex 6.1 User’s Manual” Waterloo hydrogeologic Inc, Canada, pages702