International Research Journal of Engineering and Technology (IRJET) e-ISSN: 2395-0056

Volume: 09 Issue: 10 | Oct 2022 www.irjet.net p-ISSN: 2395-0072

International Research Journal of Engineering and Technology (IRJET) e-ISSN: 2395-0056
Volume: 09 Issue: 10 | Oct 2022 www.irjet.net p-ISSN: 2395-0072
1Senior Scientist, KSCSTE-National Transportation Planning And Research Centre, Kerala, India
2 Assistant Professor, Dept. of Civil Engineering, Viswajyothi College of Engineering and Technology, Kerala, India 3,4,5,6B.Tech Scholar, Dept. of Civil Engineering, Viswajyothi College of Engineering and Technology, Kerala, India ***
Abstract - Signalized intersections are the most complex locations in urban networks. A good road system is essential to the well-being of the surface transportation of goods and passengers in cities, where social, economic, recreational, and other activities rely on them. Managing and improving urban traffic systems involves evaluating the status and performance of road intersections. Signalized intersections must be evaluated based on the level of service as well as their capacity. The current study is aimed at estimating the current traffic capacity prevailing at Pattom and Palayam Junctions in Kerala, facilitated through means of surveys which shall be conducted. The performance of the junction shall be checked following the results of the survey. The study mainly focuses on finding the level of service of these intersections by analyzing the Degree of saturation, Control Delay Estimation and incorporating these results for adopting improvement measures to ensure a smoother flow of traffic along the junction.
Key Words : Signalized Intersection, Level of Service, DegreeofSaturationHighways' visible characteristics, such as their horizontal andverticalalignments,sightdistances,andintersections, are scaled and laid out according to a geometric design. Highway geometry involves aspects such as vertical alignment details, intersection elements, cross-section elements, horizontal alignment details, and sight distance considerations. The concerns for pavement width, formation, and land, as well as its surface qualities and cross slope, are included under cross-sectional elements. The safe movement of cars is governed by the sight distance, or clear distance, visible ahead of a driver at horizontal and vertical bends and crossings. By incorporating horizontal curves, it is possible to alter the direction of the road. In order to partially offset the centrifugal force created on a vehicle travelling a horizontal curve, the super elevation is provided by raising the outer edge of the pavement relative to the inner edge. Extra pavement width is also provided on horizontal curves. Transition curves are added between the straight and circular curves in order to progressively
introduce the centrifugal force and superelevation. On a highway's vertical alignment, slopes and vertical curves arefirstintroduced.Thetopographyoftheterrainthrough which the highway is being aligned, the locale, traffic patterns, and design speed requirements all have a significant impactonhighwaygeometry.Speed, roaduser and vehicle characteristics, design traffic, traffic capacity, and benefit-cost considerations are the variables that influencegeometricdesignrequirements.
Themainaimofourstudyare:
Toestimatesaturationflowofagivensignalized intersection
Tofindthedegreeofsaturation
Tofindthecontroldelay
To predict the level of service of the given signalizedintersections
To find out capacities of the given signalized intersections by considering effects of various parameters: (a) GeometricCharacteristics (b) TrafficCharacteristics
Thiruvananthapuram in Kerala State, India, contains a spot called Pattom Junction. It is around 4 kilometres to the north of Thampanoor's core. One of Thiruvananthapuram's busiest junctions, it connects four routes, including NH 66 to North Kerala and a road to Kowdiar Palace. Thiruvananthapuram Central Railway Station is 4 km distant, while Trivandrum International AirportatShanghumughamis7kmaway.
In India's Kerala state, in the Thiruvananthapuram District, lies Palayam Junction. Palayam is locally known, oneofthebusiestlocalitiesinThiruvananthapuram. Itisa
International Research Journal of Engineering and Technology (IRJET) e-ISSN: 2395-0056
Volume: 09 Issue: 10 | Oct 2022 www.irjet.net p-ISSN: 2395-0072
part of Kerala's South Division. Due to its location in the city's core. A religious confluence at Palayam, which includes a Palayam Juma Masjid, a Palayam Ganapathy Temple,andSt.JosephChurchisanotherofthecity'swellknownattractions.
The first stage in the Data Collection process is the Reconnaissance alsoknown asthePreliminarySurvey. As part of Reconnaissance, the site at Pattom and Palayam Junctionswerevisitedbytheteamon11November2021. Initial visual observations pertaining to the situation prevailingatthejunctionsintermsofthetraffic,signalling andthegeometrywerestudied.
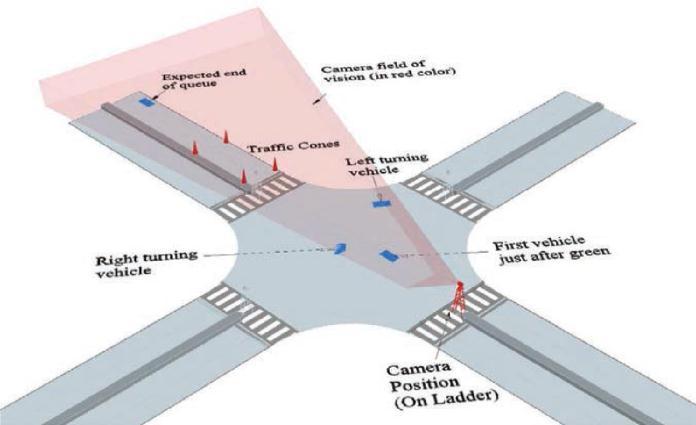
Saturation flow was measured using video data. The stop linewaschosenastheobservationpoint.Byrepeatingthe footagerepeatedly,thedatawasextractedindividuallyfor thestraight-on,left- andright-turningtrafficstreams.The saturation flow was then determined by classifying and tallying every vehicle that crossed the stop line simultaneously during a signal phase. For each cycle with a recorded duration, the same process was performed. At the completion of each period during the green phase, a tablelistingthecategorisedtrafficdataisprepared.
Theobservedtrafficflowmetricsareusedtocalculatethe flowinPCU/houras Where, S=Vehicleflow(PCUperhour)passingthestopline ni= No. of vehicles passing the stop line of type ‘i’ throughouttheCountInterval Pi =PCUofvehicletype‘i’ CI=CountInterval(sec)
To conduct the study, it is necessary to convert each type ofvehicle'svolumeinto an equal volume ofpassenger car units (PCUs). The PCUs have been determined for all vehicle types using saturation flow as the baseline. In order to get the steady rate of saturation flow, It is suggested that these PCUs be used to convert multiple vehicle volume combinations into similar passenger car volumes.
Table -1: FieldsaturationflowofPattomIntersection Approach Vehicle from Field saturation flow (PCU/Hr)
Northbound Thampanoor 6780 Eastbound MedicalCollege 5690 Westbound Kowdiar 5092 Southbound Kesawadasapuram 5230 Southbound Kesawadasapuram 6202
Table -2: FieldsaturationflowofPalayamIntersection Approach Vehicle from Field saturation flow (PCU/Hr)
Northbound Thampanoor 5040 Eastbound GeneralHospital 2066 Westbound BakeryJunction 5232 Southbound LMSJunction 5005
The highest vehicle count (measured in PCUs) that can flow through a signalised intersection in one unit of time under the current traffic, geometric, and control conditions is known as the approach capacity. This capacityistypicallyrepresentedinpassengercarunitsper hour(PCU/hr).
A moving group's ability to approach a signalised intersectioncanbestatedas ( ⁄ )
Where,
Ci =Movementgroup‘i’capacity(PCUperhr)
Fig-1:CameraPositionArrangementforDataCollection, (IndoHCM)
SFi = Current movement group saturation flow (PCU per hour)
International Research Journal of Engineering and Technology (IRJET) e-ISSN: 2395-0056
Volume: 09 Issue: 10 | Oct 2022 www.irjet.net p-ISSN: 2395-0072
gi =Movementgroup‘i’effectivegreentime(sec)
C=OverallCycletime(sec)
Table -3: CapacityforPattomIntersection
Approach Vehicle from Effective green time (s)
Equations provide the values of the parameters "t" and "u".
Capacity (PCU/Hr)
Northbound Thampanoor 30 1695
Eastbound MedicalCollege 15 711 Westbound Kowdiar 33 1400 Southbound Kesawadasapuram 62 2688 Southbound Kesawadasapuram 30 1550
Table -4: CapacityforPalayamIntersection
Approach Vehicle from Effective green time (s)
Capacity (PCU/Hr)
Northbound Thampanoor 70 2940 Eastbound GeneralHospital 27 465 Westbound BakeryJunction 27 1177 Southbound LMSJunction 70 2920
The control delay is made up of three parts: the uniform delay (d1), which is the time when vehicles arrive at a predictable uniform rate, the incremental delay (d2), which partially takes into account the randomness of arrivals, and the initial queue (d3), which is the time beforetheanalysisperiodbegins.
Where, =controldelay,(inseconds/PCU) √
Where,
( ( )) ( )
=Effectivegreenperiod(sec)
CY_Time=Overallcycletime(sec)
T=Analysisperiod(hrs)
X=Degreeofsaturation
= At the beginning of the time period "T," the initialqueue(PCU).
t=Timeforwhichtherequirementwassatisfied throughouttheanalysisperiod"T"(hrs)
u=Demandparameter
= Capacity of the signalized intersection (PCU per hour)
Table -5: ControlDelayofPattomIntersection
Vehicle from d1 d2 d3 Control delay(d) (sec/PCU)
Thampanoor 40.95 2.47 0 43.42 MedicalCollege 51.91 19.05 0 70.95 Kowadiar 40.34 4.69 0 45.02 Kesawadasapuram 24.36 2.98 0 27.35 Kesawadasapuram 42.67 5.52 0 48.19
Table -6: LOSofPattomIntersection
Vehicle from Control Delay (sec/PCU)
LOS
Thampanoor 43.42 C
MedicalCollege 70.95 D Kowadiar 45.02 C Kesawadasapuram 27.35 B Kesawadasapuram 48.19 C
International Research Journal of Engineering and Technology (IRJET) e-ISSN: 2395-0056
Volume: 09 Issue: 10 | Oct 2022 www.irjet.net p-ISSN: 2395-0072
Table -7: ControlDelayofPalayamIntersection
Vehicle from d1 d2 d3 Control delay (d) (sec/PCU)
Thampanoor 23.48 0.17 0 21.31 GeneralHospital 37.70 0.95 0 34.78
BakeryJunction 40.40 1.40 0 37.77 LMSJunction 14.49 0.57 0 13.62
Table -8: LOSofPalayamIntersection
Vehicle from Control Delay (sec/PCU)
LOS
Thampanoor 21.31 A GeneralHospital 34.78 A BakeryJunction 37.77 B LMSJunction 13.62 A
A movement group's degree of saturation (X) can be calculatedas, Where,
=Movementgroup‘i’degreeofsaturation
=Movementgroup’i’capacity (PCUperhour)
=Movementgroup‘i’volume
= Current movement group saturation flow (PCUperhour)
=Movementgroup‘i’effectivegreentime(sec)
CY_Time=Overallcycletime(sec)
Table -9: VolumetoCapacityRatioofPattomIntersection
Approach Vehicle from Degree of Saturation
Northbound Thampanoor 0.7032
Eastbound MedicalCollege 0.9201
Westbound Kowdiar 0.7930
Southbound Kesawadasapuram 0.8220 Southbound Kesawadasapuram 0.8363
Table -10: LOSofPattomIntersection
Vehicle from Degree of Saturation LOS
Thampanoor 0.7032 B MedicalCollege 0.9201 C Kowdiar 0.7930 C Kesawadasapuram 0.8220 C Kesawadasapuram 0.8363 C
Table-11: VolumetoCapacityRatioofPalayam Intersection
Approach
Vehicle from Degree of Saturation
Northbound Thampanoor 0.2209 Eastbound MedicalCollege 0.1965 Westbound Kowdiar 0.4804 Southbound Kesawadasapuram 0.4820
Table -12: LOSofPalayamIntersection
Vehicle from Degree of Saturation LOS
Thampanoor 0.2209 A GeneralHospital 0.1965 A BakeryJunction 0.4804 B LMSJunction 0.4820 B
Thecontroldelaymodelandv/cratioareusedtoestimate the degree of service offered by the various techniques. Theresultsaredisplayedinthetablebelow.
International Research Journal of Engineering and Technology (IRJET) e-ISSN: 2395-0056
Volume: 09 Issue: 10 | Oct 2022 www.irjet.net p-ISSN: 2395-0072
Table -13: PattomIntersection
Approach Vehicle from LOS Based on Control Delay
LOS Based on v/c ratio
Northbound Thampanoor C B
Eastbound MedicalCollege D C
Westbound Kowdiar C C
Southbound Kesawadasapuram B C Southbound Kesawadasapuram C C
Table -14: PalayamIntersection
Approach Vehicle from LOS Based on Contro l Delay
Northbound Thampanoor A A
Eastbound GeneralHospital A A
Westbound BakeryJunction B B Southbound LMSJunction A B
LOS Based on v/c ratio
Table -16: EstimateoftheServiceLevelatthePalayam Intersection
Phase 1 2 3 4
Access SB WB NB EB g/Cratio 0.58 0.23 0.58 0.23 Degreeof Saturation 0.48 0.48 0.22 0.196
Approach Delayin sec/PCU 13.61 37.70 21.31 34.78
Approach LOS A A B A Intersectio nDelayin sec/PCU,D 21.159 Intersectio nLOS basedon Delay B
Table -15: EstimateoftheServiceLevelatthePattom Intersection
Phase 1 2 3 4
Access WB EB NB SB SB g/Cratio 0.28 0.125 0.25 0.52 0.25 Degreeof Saturation 0.79 0.92 0.70 0.82 0.84
Approach Delayin sec/PCU 45.02 70.95 43.42 27.35 48.19 Approach LOS C D C B C
Intersectio nDelayin sec/PCU,D 41.92
Intersectio nLOS basedon Delay C
Aqualitativemetriccalledlevelofservice(LOS)isusedto assess how well motor vehicle traffic services are provided. By traffic flow classification and quality rating based on performance indicators like vehicle speed, density, congestion, etc., LOS is used to study roads and crossings. LOS aids in determining traffic quality levels basedonperformanceindicatorslikespeed,density,etc.
Fromtheanalysis,itisconcludedthat,
Table -17: LOSofPattomIntersection Movement Groups LOS LOS OF PATTOM INTERSECTION: C
1 C 2 D 3 C 4 C 5 C
International Research Journal of Engineering and Technology (IRJET) e-ISSN: 2395-0056
Volume: 09 Issue: 10 | Oct 2022 www.irjet.net p-ISSN: 2395-0072
Table -18: LOSofPalayamIntersection Movement Groups LOS
LOS OF PALAYAM INTERSECTION: B 1 A 2 A 3 B 4 B
From the above results, Pattom Intersection has more congested condition than the intersection of Palayam. So alltheapproacharmsofPattomrequirefurthertreatment to alleviate the congested movements and ensure better operationalefficiencyandlevelofperformance.
The LOS analysis of Pattom concludes that the approach arms of Pattom are having overcrowded conditions than thePalayamintersectionbecausePattomhasLOSCandD. Comparatively, the Palayam intersection has better operational efficiency with estimated LOS A and B for differentmovementgroups.
[1] Council of Scientific and Research Institute, ‘Indian HighwayCapacityManual’,2018
[2] LIANG Xiao, LIU Zhili,QIANKun,‘Capacity Analysis of Signalized Intersections under Mixed Traffic Conditions’,2011
[3] Nikunj Patel, Mr. Sanjay G. Patel,‘Capacity Analysis of Signalized Intersections by Use of Saturation Flow RateunderMixedTrafficConditions’,2012
[4] MizanurRahman,TanweerHasan&FumihikoNakamura, ‘Development of Professional Driver Adjustment Factors for the Capacity Analysis of Signalized Intersections’,2008
[5] ZhiliTian, ‘Capacity Analysis of Traffic-Actuated Intersections’,2002
[6] MohsinShahzadChaudhry, PrakashRanjitkar,‘Capacity Analysis of Signalised Intersection using Microsimulation’,2019
[7] BorigarlaBarhmaiah, Sandeep Singh & S. Moses Santhakumar,‘Performance Analysis Of Signalised Intersections Onarterial Roads Under Mixed Traffic Conditions’,2020