International Research Journal of Engineering and Technology (IRJET)
e-ISSN: 2395-0056
Volume: 08 Issue: 02 | Feb 2021
p-ISSN: 2395-0072
www.irjet.net
AN ASSESSMENT OF SOCIAL INFRASTRUCTURE IN EAST ZONE OF SURAT CITY Ankit N. Chaudhari1, Shivang N. Dabhi2 1B.E.
Civil, Gujarat Technological University, professor, Shree Swami Atmanand Saraswati Institute of Technology ----------------------------------------------------------------------***--------------------------------------------------------------------2Assistant
Abstract - The social Infrastructure refers to the fundamental facilities and systems serving a country, city, or area including the services and facilities necessary for its economy to function. The quality, efficiency, and productivity of the infrastructure affect the quality of life; health, and livability of the society. The present levels of urban infrastructure are quite inadequate to meet the demand of the existing urban population. The project is intended towards the development of basic social amenities to people in the terms of social infrastructure such as fire stations, hospitals, and educational institutes. Existing social infrastructure has compared with the necessity concerning standard guidelines for infrastructure. Planning proposal may also prepare based on gap analysis of infrastructure. Quality upgradation of life of people may improve directly and people may satisfy with upgradation of infrastructure from the future point of view. Keywords: Accessibility, Quality of Infrastructure, Urban area, Surat City
life,
Social
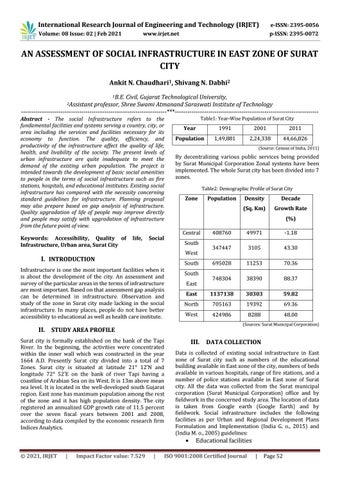
Table1: Year-Wise Population of Surat City
Year
1991
2001
2011
Population
1,49,881
2,24,338
44,66,826
(Source: Census of India, 2011)
By decentralizing various public services being provided by Surat Municipal Corporation Zonal systems have been implemented. The whole Surat city has been divided into 7 zones. Table2: Demographic Profile of Surat City
Zone
Infrastructure is one the most important facilities when it is about the development of the city. An assessment and survey of the particular areas in the terms of infrastructure are most important. Based on that assessment gap analysis can be determined in infrastructure. Observation and study of the zone in Surat city made lacking in the social infrastructure. In many places, people do not have better accessibility to educational as well as health care institute.
Central
Growth Rate
49971
-1.18
347447
3105
43.30
695028
11253
70.36
748304
38390
88.37
East
1137138
30303
59.82
North
705163
19392
69.36
West
424986
8288
48.00
South South South East
III. DATA COLLECTION Data is collected of existing social infrastructure in East zone of Surat city such as numbers of the educational building available in East zone of the city, numbers of beds available in various hospitals, range of fire stations, and a number of police stations available in East zone of Surat city. All the data was collected from the Surat municipal corporation (Surat Municipal Corporation) office and by fieldwork in the concerned study area. The location of data is taken from Google earth (Google Earth) and by fieldwork. Social infrastructure includes the following facilities as per Urban and Regional Development Plans Formulation and Implementation (India G. o., 2015) and (India M. o., 2005) guidelines:
Impact Factor value: 7.529
(Sq. Km)
(Sources: Surat Municipal Corporation)
Surat city is formally established on the bank of the Tapi River. In the beginning, the activities were concentrated within the inner wall which was constructed in the year 1664 A.D. Presently Surat city divided into a total of 7 Zones. Surat city is situated at latitude 21° 12’N and longitude 72° 52’E on the bank of river Tapi having a coastline of Arabian Sea on its West. It is 13m above mean sea level. It is located in the well-developed south Gujarat region. East zone has maximum population among the rest of the zone and it has high population density. The city registered an annualized GDP growth rate of 11.5 percent over the seven fiscal years between 2001 and 2008, according to data compiled by the economic research firm Indices Analytics.
|
Decade
408760
II. STUDY AREA PROFILE
© 2021, IRJET
Density
(%)
West
I. INTRODUCTION
Population
|
Educational facilities
ISO 9001:2008 Certified Journal
|
Page 52