International Research Journal of Engineering and Technology (IRJET)
e-ISSN: 2395-0056
Volume: 07 Issue: 09 | Sep 2020
p-ISSN: 2395-0072
www.irjet.net
This figure shows the different satellite views from which we can identify how many satellites are available to us. This graph is obtained using MATLAB. There are certain factors to be taken care of while selecting the satellite like the angle should be less than 30 degree.
[5]Arikan, F., et al.” Space weather activities of IONOLAB group: IONOLAB-TEC.” EGU General Assembly Conference Abstracts. Vol. 11. 2009. [6]Scherrer, Philip, Deborah Scherrer, and Stanford Solar Center. ” Solstice and Equinox (“Sun track”) Season Model.” (2014): 1-17.
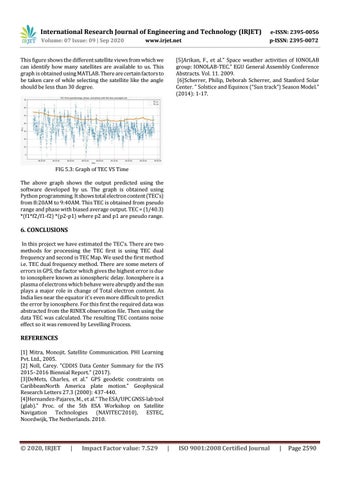
FIG 5.3: Graph of TEC VS Time The above graph shows the output predicted using the software developed by us. The graph is obtained using Python programming. It shows total electron content (TEC’s) from 8:20AM to 9:40AM. This TEC is obtained from pseudo range and phase with biased average output. TEC = (1/40.3) *(f1*f2/f1-f2) *(p2-p1) where p2 and p1 are pseudo range.
6. CONCLUSIONS In this project we have estimated the TEC’s. There are two methods for processing the TEC first is using TEC dual frequency and second is TEC Map. We used the first method i.e. TEC dual frequency method. There are some meters of errors in GPS, the factor which gives the highest error is due to ionosphere known as ionospheric delay. Ionosphere is a plasma of electrons which behave were abruptly and the sun plays a major role in change of Total electron content. As India lies near the equator it’s even more difficult to predict the error by ionosphere. For this first the required data was abstracted from the RINEX observation file. Then using the data TEC was calculated. The resulting TEC contains noise effect so it was removed by Levelling Process.
REFERENCES [1] Mitra, Monojit. Satellite Communication. PHI Learning Pvt. Ltd., 2005. [2] Noll, Carey. ”CDDIS Data Center Summary for the IVS 2015–2016 Biennial Report.” (2017). [3]DeMets, Charles, et al.” GPS geodetic constraints on CaribbeanNorth America plate motion.” Geophysical Research Letters 27.3 (2000): 437-440. [4]Hernandez-Pajares, M., et al.” The ESA/UPC GNSS-lab tool (glab).” Proc. of the 5th ESA Workshop on Satellite Navigation Technologies (NAVITEC’2010), ESTEC, Noordwijk, The Netherlands. 2010.
© 2020, IRJET
|
Impact Factor value: 7.529
|
ISO 9001:2008 Certified Journal
|
Page 2590