International Research Journal of Engineering and Technology (IRJET)
e-ISSN: 2395-0056
Volume: 07 Issue: 09 | Sep 2020
p-ISSN: 2395-0072
www.irjet.net
functions that distinguish fake events and topics. Finally, we describe the mathematical formulation used for quantifying the reliability of news articles[5].
Times, WSJ, Bloomberg, NPR, and The Guardian) which were published around 2015–2016. REQUIREMENTS: Python NumPy pandas Matplotlib Sklearn
6. DATASETS A dataset that consists of a headline and a body of the text. Maybe this body of the text is from another post. Allowing the body of text from different articles allows this system to take into account what the other organizations are saying about the same headline. The performance of the method will be the title-related body of text location.
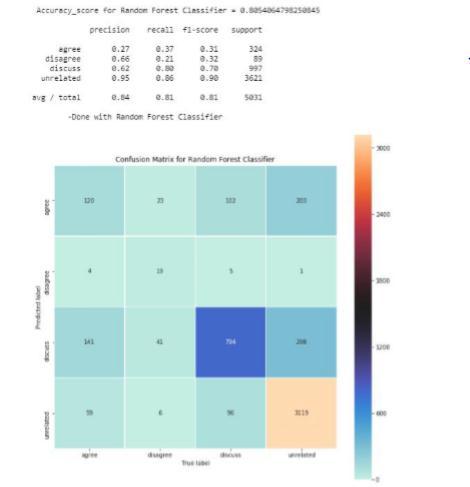
8. CLASSIFICATION MODELS Most classification models have been simple Naive Bayes approaches, which have worked great well. .We implement the following models:
There are following stance types which system supports:
Agrees Disagrees Discuss Unrelated
With this system, for a set of news headlines, statistics can be gathered concerning the stances. With these statistics, a user can come to their conclusion of whether a new organization has reputable news sources. This data will provide the location along with the headline and body to allow the system to learn which word combinations lead to which location. This framework will train on the data generated by the fake news challenge to achieve these stances. For testing, data will be provided without the stances. The body of text may be from a different article. The device output will be the location of the text body relating to the title.
LogisticsRegression(LF) RandomForests(RF) Multinomial NaiveBayes XGBoost
The code relies upon the implementation of these various methods in SciKit-Learn. After generating the news feature vector, now we classify the vector to whether it is fake or real.
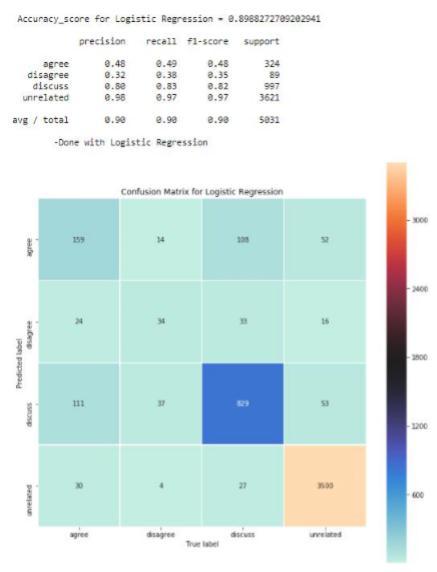
8.1 Logistic Regression : In order to analyse results, logistic regression is used to explain the relationship between a binary dependent variable and one or more nominal , ordinal, interval, or ratio-level variables.
Two CSVs that we have used to implement the system are: Train_bodies.cs:ContainsBodyIDandBodyTextnoofrecords:25 Train_stances.csv:ContainsHeadline,BodyIDandStancenoofrecords:49972
7. DATA COLLECTION There must be two parts to the data-acquisition process: “fake news” and “real news”. It was easy to compile the fake news as Kaggle released a fake news dataset containing 13,000 articles written during the 2016 election cycle. Now the later part has difficulty in it. That is to get the real news for the fake news dataset. It requires a huge workaround for many Sites because it was the only way to do web scraping thousands of articles from many websites. A real news dataset was created with the aid of web scraping a total of 5279 posts, mostly from media organizations (New York
© 2020, IRJET
|
Impact Factor value: 7.529
. Chart1: Logistic Regression-Accuracy-90%
|
ISO 9001:2008 Certified Journal
|
Page 1411