International Research Journal of Engineering and Technology (IRJET)
e-ISSN: 2395-0056
Volume: 07 Issue: 07 | July 2020
p-ISSN: 2395-0072
www.irjet.net
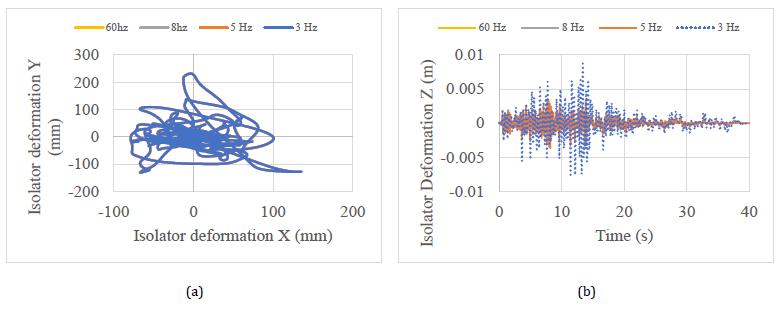
Figure 10: Response deformation comparison of the center isolator among the different cases (a) Horizontal deformation for Case 1-4. (b) Vertical deformation for Case 1-4, corresponding to wave 186 Imperial Valler-06 acceleration in X direction. The horizontal frequency for the research has been kept at constant of 0.492 Hz. It can be seen from Figure 8, that horizontal spectra are amplified when they are met with their corresponding frequencies. The peak of CIS can be seen accelerate at frequency near 11 Hz which is similar to range of vertical peak acceleration, for the case of 60 Hz, this can be caused due to coupling effect.
3. The comparison of maximum acceleration of the ASB, SCV and CIS showed the similar acceleration value in frequency 3 Hz whilst a difference of significance can be seen when the model was kept at isolation frequency represented by frequency 60 Hz, in a way such that 60Hz>8Hz>5Hz>3Hz. 4. A significant increase in isolation of vertical direction was seen when the vertical frequency of the isolation device was reduced from 60 Hz to 3 Hz, hence shifting the resulting peak response of the structure. The effect of the change in the vertical direction parameters could be seen in the horizontal direction but could be noted as insignificant as compared to the changes observed in the vertical response of the structure.
From Table 3, the maximum observed acceleration on top of model is 13.790m/s2. It can be noted how the behavior acceleration at the top of the structure varies, from the variation in acceleration values, in case of 60 Hz vertical frequency. This variation is slowly changes as the discrepancy within the variation of maximum acceleration value reduces when the vertical frequency is reducing, in case of 3 Hz. It was noted that during this process the displacement value increased in slight of 0.9-1.0% when decreasing the value of the vertical frequency from 60 Hz to 3 Hz.
From earlier studies on the isolator with similar frequency, as presented in one of the papers by Zhou. Et al., it can be seen that the vertical response spectrum of the superstructure with the frequency of isolator of 3 Hz can efficiently reduce the vertical in-structure responses for AP1000 model, studied here.
3. CONCLUSIONS 1. Compared with each stick among these three with or without isolation, CIS has the minimum value of acceleration response, whereas ASB has the maximum value of acceleration response.
The study did not participate vertical isolator frequency below 3 Hz as in previous experimentation by various researchers it was found that below the stated frequency a rocking motion was noticed which is an undesirable component for this study, hence requirement of possible rocking suppression devices was noted to continue with the experiment.
2. The increase in deformation of isolator can be seen when vertical frequency of the isolator is reduced, but this change can be noted as positive one as the Isolation system which complies with both vertical and horizontal isolation can be a significant improvement over the current generation of isolation techniques. Effectiveness of vertical frequency with the response to horizontal and vertical isolation can be seen when the frequency of isolation was kept at 3 Hz.
Š 2020, IRJET
|
Impact Factor value: 7.529
The study concludes with result of performance effectiveness of 3D isolation when the frequency is 3 Hz with 20% damping in vertical direction and 0.492 Hz with 5% damping in horizontal direction, compared to the other frequencies discussed, in this paper.
|
ISO 9001:2008 Certified Journal
|
Page 4610