International Research Journal of Engineering and Technology (IRJET)
e-ISSN: 2395-0056
Volume: 07 Issue: 07 | July 2020
p-ISSN: 2395-0072
www.irjet.net
Proportions of different size fractions to obtain zone-II sand Sieve sizes (mm) 4.75 2.36 1.18 600μ 300μ 150μ 75μ Pan
Weight Retained (gm)
% Weight Retained
25 52 161 355 364 36 5 2
2.5 5.2 16.1 35.5 36.4 3.6 0.5 0.2
Cumulati ve Weight retained 2.5 7.7 23.8 59.3 95.7 99.3 99.8 100
% of passin g 97.5 92.3 76.2 40.7 4.3 0.7 0.2 0
Table 3: Proportions of different size fractions to obtain zone –II sand Reporting of Results The results should be calculated and reported as: i) The cumulative percentage by weight of the total sample. ii) The percentage by weight of the total sample passing through one sieves and retained on the next smaller sieve, to the nearest 0.1 percent. The results of the sieve analysis may be recorded graphically on a semi-log graph with particle size as abscissa (log scale) and the percentage smaller than the specified diameter as ordinate.
5.3 SHAPE TEST The Flakiness Index is defined as the percentage by weight of Aggregate particles whose least dimension is less than 0.6 times their mean size. The Elongation Index of an Aggregate is defined as the percentage by weight of particles whose greatest dimension (length) is 1.8 times their mean dimension. This test is applicable to Aggregates larger than 6.3 mm.
5.4 INITIAL & FINAL SETTING TIME OF CEMENT Initial setting time is that time period between the time water is added to cement and time at which 1 mm square section needle fails to penetrate the cement paste, placed in the Vicat’s mould 5 mm to 7 mm from the bottom of the mould. Final setting time is that time period between the time water is added to cement and the time at which 1 mm needle makes an impression on the paste in the mould but 5 mm attachment does not make any impression.
6. SELECTION OF NANO MATERIAL TiO2 IN% SELECTION OF 0.25% OF NANO TiO2:The amount of nano TiO2 with respective to cement in concrete mix for 1 cube = 3.333gm 3 cubes = 10 gm SELECTION OF 0.5% OF NANO TiO2:The amount of nano TiO2 with respective to cement in concrete mix for 1 cube = 6.65gm 3 cubes = 20gm SELECTION OF 1.0% OF NANO TiO2:The amount of nano TiO2 with respective to cement in concrete mix for 1 cube = 13.33gm 3 cubes = 40gm SELECTION OF 1.25% OF NANO TiO2:The amount of nano TiO2 with respective to cement in concrete mix for 1 cube = 16.62gm 3 cubes = 50gm
7. TEST RESULTS
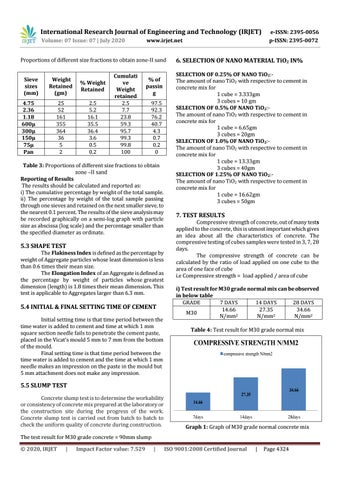
Compressive strength of concrete, out of many tests applied to the concrete, this is utmost important which gives an idea about all the characteristics of concrete. The compressive testing of cubes samples were tested in 3, 7, 28 days. The compressive strength of concrete can be calculated by the ratio of load applied on one cube to the area of one face of cube i.e Compressive strength = load applied / area of cube i) Test result for M30 grade normal mix can be observed in below table GRADE 7 DAYS 14 DAYS 28 DAYS 14.66 27.35 34.66 M30 N/mm2 N/mm2 N/mm2 Table 4: Test result for M30 grade normal mix
COMPRESSIVE STRENGTH N/MM2 compressive strength N/mm2
5.5 SLUMP TEST
34.66
Concrete slump test is to determine the workability or consistency of concrete mix prepared at the laboratory or the construction site during the progress of the work. Concrete slump test is carried out from batch to batch to check the uniform quality of concrete during construction.
27.35 14.66 7days
14days
28days
Graph 1: Graph of M30 grade normal concrete mix
The test result for M30 grade concrete = 90mm slump © 2020, IRJET
|
Impact Factor value: 7.529
|
ISO 9001:2008 Certified Journal
|
Page 4324