International Research Journal of Engineering and Technology (IRJET)
e-ISSN: 2395-0056
Volume: 07 Issue: 06 | June 2020
p-ISSN: 2395-0072
www.irjet.net
different dates with a period of five years using satellite image. The figure 3 shows the flowchart of calculating the water spread area.
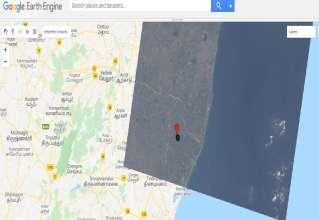
3.1 FILTERING IMAGE COLLECTION The Filtering image is used as an Earth Engine collection ID available in the fusion table. To, construct a particular image from a set of ID’s and merge the existing collections. By, creating a random constant image obtaining a list to the constructor, merges the two image collections and attains a feature collection. Thus, maps a function by returning an image over a feature collection. In a simple way, the geometry points are marked for selecting a boundary of particular region. The coordinates of a region along with its zoom level is the syntax to select particular boundary region called feature collection. The watershed data are taken from the fusion table and computes its geometry area to add on to properties. The property list contains the measurement units and maps the function over features.
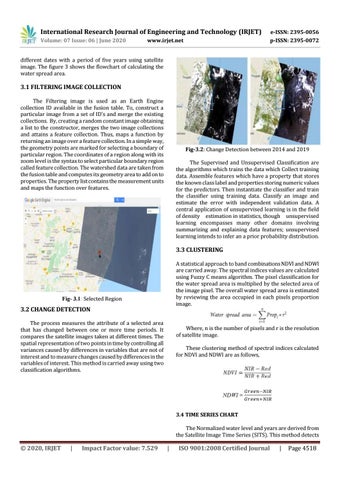
Fig-3.2: Change Detection between 2014 and 2019 The Supervised and Unsupervised Classification are the algorithms which trains the data which Collect training data. Assemble features which have a property that stores the known class label and properties storing numeric values for the predictors. Then instantiate the classifier and train the classifier using training data. Classify an image and estimate the error with independent validation data. A central application of unsupervised learning is in the field of density estimation in statistics, though unsupervised learning encompasses many other domains involving summarizing and explaining data features; unsupervised learning intends to infer an a prior probability distribution.
3.3 CLUSTERING A statistical approach to band combinations NDVI and NDWI are carried away. The spectral indices values are calculated using Fuzzy C means algorithm. The pixel classification for the water spread area is multiplied by the selected area of the image pixel. The overall water spread area is estimated by reviewing the area occupied in each pixels proportion image.
Fig- 3.1: Selected Region
3.2 CHANGE DETECTION The process measures the attribute of a selected area that has changed between one or more time periods. It compares the satellite images taken at different times. The spatial representation of two points in time by controlling all variances caused by differences in variables that are not of interest and to measure changes caused by differences in the variables of interest. This method is carried away using two classification algorithms.
Where, n is the number of pixels and r is the resolution of satellite image. These clustering method of spectral indices calculated for NDVI and NDWI are as follows,
3.4 TIME SERIES CHART The Normalized water level and years are derived from the Satellite Image Time Series (SITS). This method detects
Š 2020, IRJET
|
Impact Factor value: 7.529
|
ISO 9001:2008 Certified Journal
|
Page 4518