International Research Journal of Engineering and Technology (IRJET)
e-ISSN: 2395-0056
Volume: 07 Issue: 06 | June 2020
p-ISSN: 2395-0072
www.irjet.net
ANALYSIS OF NORMALIZED DIFFERENCE IN WATER AND VEGETATION INDICES FROM SATELLITE IMAGERY Miss. K. Sherin1, Dr. G. Murugesan2 1Student,
Computer Science and Engineering, St.Joseph’s College of Engineering, Tamilnadu, Chennai Computer Science and Engineering, St.Joseph’s College of Engineering, Tamilnadu, Chennai ---------------------------------------------------------------------***--------------------------------------------------------------------2Professor,
Abstract - Water being a prime natural resource and a
values are recovered by Geographic Information System. GIS handles the spatial data, contains unavoidable inputs from remote sensing. Satellite images provide useful information, which could be stored as record for future purpose. This technology offers a possibility to develop a compatible database at spatial, spectral and temporal resolution. The population increases day by day coercion on the natural resources. It is important to manage the available natural resources. Since, remote sensing technique provides information on Earth’s surface uses unlimited applications. Collecting information on different application areas like agriculture, forestry, geography, geology, archaeology, weather and climate, marine environment, water resources management etc.
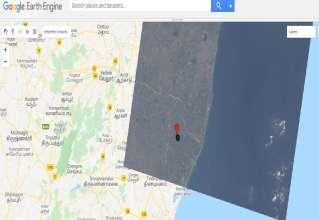
basic human need. According to the recent survey, demand on water already exceeds supply to many parts of the world as the population grows. The main reason for the water crisis is low rainfall count all over the state. Scarcity of water has seen many reservoirs run dry. Global data documents the surface water and vegetation produces statistical information and satellite imagery. The Landsat images quantify the changes in surface water area at 30m resolution. The study in Madurantakam Lake analyzed the change in water area during a period of 2014 to 2019 using Sentinel 2 and Landsat 8 OLI images. Different indices like Normalized Difference Water and Vegetation index NDWI & NDVI were tested to extract the surface water area. The study shows that about 17.81 percent of drought level has increased during 2014 to 2016 and 23.82 percent of high water level has increased during 2017 to 2019.
GIS is an essential supporting structure for gathering, managing and analysing data. Normally contemplate to involve spatial referenced computer database suitable application software. GIS needs spatial data making it unique. It describes the digital geographic data systematize as geographic database scales the data represented in different kinds of variables such as- Nominal, Ordinal, Interval and Ratio. GIS input data features both the spatial data and attribute data. The non-digital data (spatial data) are converted into digital form. This lake spreads over 2400 acres in Chengalpattu district, Tamil Nadu. The Chennai Metropolitan Area has nearly 4100 water bodies with a storage capacity of 150000 million cubic feet.
Key Words: Satellite image, Water spread area, Occurrence, NDWI, NDVI
1.INTRODUCTION Modern Satellite technologies are used to collect huge volumes of Earth Observation data explained by Aseefa (2007) [1]. Nowadays, Water crisis has become a major problem all over the world. In a worldwide only about 14% of water use in domestic needs. Each day an individual requires a 2000-4000 litres of water will become a big challenge in future due to the rise of population. Rainfall in India is contingent on south-west monsoon and north-east monsoon. It is observed that 17 countries are water stressed in a recent survey. Water crisis in India has challenged an extent beyond Chennai which has surveyed recently the highest scarcity of water supply.
Stefan Voigt et al (2007), paper describes successful rapid satellite mapping campaigns supporting disaster relief and demonstrates how this technology can be used for civilian crisis-management purposes. This paper reflects on several of these international activities, such as the International Charter Space and Major Disasters, describes mapping procedures, and reports on rapid-mapping experiences gained during various disaster-response applications. Multiple satellite image processing and analysis techniques may successfully be applied individually or in a combined manor to serve rapid-mapping tasks in the domain of disaster and crisis-management support. During the analysis, response, and recovery phase, only very fast delivery of up-to-date, accurate, and comprehensive image analysis products can significantly help in the assessment of large disaster situations, in particular in remote areas, where other means of assessment or mapping either fail or are of insufficient quality.
Remote Sensing is a technique that obtains information about an object or area by analysing the data acquired by the device. It defines the measurements of radio waves reflected from or emitted by a target from a point of view which is distant from the target. It is displayed as a necessary part of a huge information system. It acts as a key component for decision making in many applications. The multi-concept of remote sensing information consist of- Multi-station images, Multi-band images, Multi-date images, Multi-stage images, Multi-polarization images etc. The analysed data of spatial
© 2020, IRJET
|
Impact Factor value: 7.529
|
ISO 9001:2008 Certified Journal
|
Page 4515