International Research Journal of Engineering and Technology (IRJET)
e-ISSN: 2395-0056
Volume: 07 Issue: 04 | Apr 2020
p-ISSN: 2395-0072
www.irjet.net
Heart Rate Variability(HRV) Analysis: A Comprehensive Review Mrs Sharada Suresh Dambal 1, Dr Sudarshan B.G2, Dr Mahesh kumar3 1*Research
Scholar, Instrumentation Technology, RV college of Engineering, Bengaluru, Karnataka, India, 560059 Professor, Instrumentation Technology, RV college of Engineering, Bengaluru, Karnataka, India, 560059 3*Associate Professor &HOD, Instrumentation Technology, JSSATE, Bengaluru, Karnataka. India, 560060 -------------------------------------------------------------------------***-----------------------------------------------------------------------2*Associate
Abstract -
Heart Rate Variability (HRV) analysis a comprehensive review Abstract HRV is an indirect indicator of functioning of Autonomic nervous system(ANS). Many diseases can be identified at an early stage and their prognosis can be monitored by analysing HRV. The common diseases correlated with HRV are Myocardial-Infarction, Hypertension, Arrhythmias and Diabetes. HRV contains voluminous data and require much time to analyse. If it is interpreted into numerical values, which is easy to understand. The literature review goes in detail about the different techniques and various bio- signals used to analyse HRV. The signals used are Electrocardiogram(ECG), Photoplethysmography(PPG) and Ballistocardiogram(BCG) signals. Among ECG signals analysis, common technique used for QRS detection is Pan and Thompkins. How-ever much more accuracy and removal of ripples was achieved by Hamilton technique by using search back threshold values. The Phasor transform algorithm is the latest technique which converts HRV data into complex numbers. The advantage of this technique is easy to compute, require less data storage and its robustness. BCG is another non-invasive technique, produces graphical representation of vibrations produced by pumping action of heart, by placing sensors at bed or chairs it can be recorded. But it has difficulty in detecting individual heart beats. Among ECG, PPG and BCG signals, ECG is the standard technique. PPG analysis gives 98.8% accuracy by adopting different motion artefact removal techniques and algorithms. PPG signals analysis has attracted the researchers as it can be recorded easily at the fingertip. Most of the soft wares are available for HRV analysis. Among them KUBIOS software is found to be best and reliable. The latest version is 3.2.The review gives an insight of the usefulness, applications of various techniques used to extract HRV parameters by different soft wares and algorithms. It also suggests the physiological signals to extract HRV.
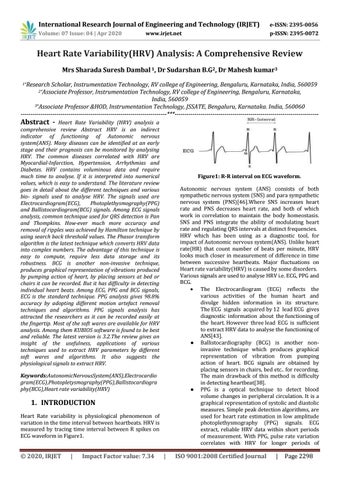
Figure1: R-R interval on ECG waveform. Autonomic nervous system (ANS) consists of both sympathetic nervous system (SNS) and para sympathetic nervous system (PNS)[46].Where SNS increases heart rate and PNS decreases heart rate, and both of which work in correlation to maintain the body homeostasis. SNS and PNS integrate the ability of modulating heart rate and regulating QRS intervals at distinct frequencies. HRV which has been using as a diagnostic tool, for impact of Autonomic nervous system(ANS). Unlike heart rate(HR) that count number of beats per minute, HRV looks much closer in measurement of difference in time between successive heartbeats. Major fluctuations on Heart rate variability(HRV) is caused by some disorders. Various signals are used to analyse HRV i.e. ECG, PPG and BCG. The Electrocardiogram (ECG) reflects the various activities of the human heart and divulge hidden information in its structure. The ECG signals acquired by 12 lead ECG gives diagnostic information about the functioning of the heart. However three lead ECG is sufficient to extract HRV data to analyse the functioning of ANS[43]. ● Ballistocardiography (BCG) is another noninvasive technique which produces graphical representation of vibration from pumping action of heart. BCG signals are obtained by placing sensors in chairs, bed etc.. for recording. The main drawback of this method is difficulty in detecting heartbeat[38]. ● PPG is a optical technique to detect blood volume changes in peripheral circulation. It is a graphical representation of systolic and diastolic measures. Simple peak detection algorithms, are used for heart rate estimation in low amplitude photoplethysmography (PPG) signals. ECG extract, reliable HRV data within short periods of measurement. With PPG, pulse rate variation correlates with HRV for longer periods of
Keywords:AutonomicNervousSystem(ANS),Electrocardio gram(ECG),Photopletysmography(PPG),Ballistocardiogra phy(BCG),Heart rate variability(HRV)
1. INTRODUCTION Heart Rate variability is physiological phenomenon of variation in the time interval between heartbeats. HRV is measured by tracing time interval between R spikes on ECG waveform in Figure1.
© 2020, IRJET
|
Impact Factor value: 7.34
|
ISO 9001:2008 Certified Journal
|
Page 2298