International Research Journal of Engineering and Technology (IRJET)
e-ISSN: 2395-0056
Volume: 07 Issue: 02 | Feb 2020
p-ISSN: 2395-0072
www.irjet.net
DISENTANGLING BRAIN ACTIVITY FROM EEG DATA USING LOGISTIC REGRESSION, XGBOOST, RNN AND CLASSIFICATION TREES. Akshat Katiyar1 1UG
Scholar, Dept. of CSE, PSG College of Technology, Tamil Nadu, India ---------------------------------------------------------------------***----------------------------------------------------------------------
Abstract - EEG, is the method of choice to record the electrical activity generated by the brain via electrodes placed on the scalp surface. Electrodes are mounted in elastic caps similar to bathing caps, ensuring that the data can be collected from identical scalp positions across all respondents. This project aims at predicting a person’s learning capability using EEG signals. The curiosity to learn about the changes that happen inside our brain while doing certain tasks drives this research. This research motivated us in developing a monitoring system which uses Electroencephalogram (EEG) as a fundamental physiological signal, to analyze and predict the learning capability of a person. The primary focus of this study is to identify the correlation between different data values extracted from raw EEG signal and how they change while doing different activities. This project disentangles brain activity through EEG signal data of 10 college students and predicts if a given student is confused or not while learning new unknown topics. The project aims at predicting the learning capabilities of an individual using EEG data from his brain.
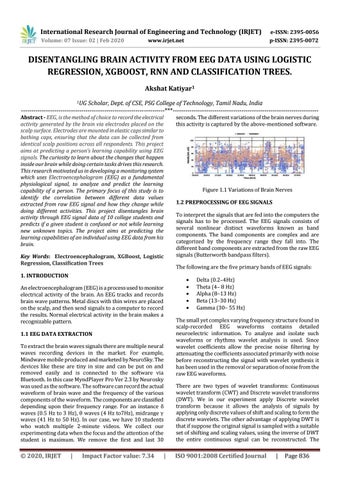
seconds. The different variations of the brain nerves during this activity is captured by the above-mentioned software.
Figure 1.1 Variations of Brain Nerves 1.2 PREPROCESSING OF EEG SIGNALS To interpret the signals that are fed into the computers the signals has to be processed. The EEG signals consists of several nonlinear distinct waveforms known as band components. The band components are complex and are categorized by the frequency range they fall into. The different band components are extracted from the raw EEG signals (Butterworth bandpass filters).
Key Words: Electroencephalogram, XGBoost, Logistic Regression, Classification Trees
The following are the five primary bands of EEG signals:
1. INTRODUCTION
An electroencephalogram (EEG) is a process used to monitor electrical activity of the brain. An EEG tracks and records brain wave patterns. Metal discs with thin wires are placed on the scalp, and then send signals to a computer to record the results. Normal electrical activity in the brain makes a recognizable pattern.
The small yet complex varying frequency structure found in scalp-recorded EEG waveforms contains detailed neuroelectric information. To analyze and isolate such waveforms or rhythms wavelet analysis is used. Since wavelet coefficients allow the precise noise filtering by attenuating the coefficients associated primarily with noise before reconstructing the signal with wavelet synthesis it has been used in the removal or separation of noise from the raw EEG waveforms.
1.1 EEG DATA EXTRACTION To extract the brain waves signals there are multiple neural waves recording devices in the market. For example, Mindwave mobile produced and marketed by NeuroSky. The devices like these are tiny in size and can be put on and removed easily and is connected to the software via Bluetooth. In this case MyndPlayer Pro Ver 2.3 by Neurosky was used as the software. The software can record the actual waveform of brain wave and the frequency of the various components of the waveform. The components are classified depending upon their frequency range. For an instance δ waves (0.5 Hz to 3 Hz), θ waves (4 Hz to7Hz), midrange γ waves (41 Hz to 50 Hz). In our case, we have 10 students who watch multiple 2-minute videos. We collect our experimenting data when the focus and the attention of the student is maximum. We remove the first and last 30
© 2020, IRJET
|
Impact Factor value: 7.34
Delta (0.2–4Hz) Theta (4– 8 Hz) Alpha (8–13 Hz) Beta (13–30 Hz) Gamma (30– 55 Hz)
There are two types of wavelet transforms: Continuous wavelet transform (CWT) and Discrete wavelet transforms (DWT). We in our experiment apply Discrete wavelet transform because it allows the analysis of signals by applying only discrete values of shift and scaling to form the discrete wavelets. The other advantage of applying DWT is that if suppose the original signal is sampled with a suitable set of shifting and scaling values, using the inverse of DWT the entire continuous signal can be reconstructed. The
|
ISO 9001:2008 Certified Journal
|
Page 836