International Research Journal of Engineering and Technology (IRJET)
e-ISSN: 2395-0056
Volume: 07 Issue: 01 | Jan 2020
p-ISSN: 2395-0072
www.irjet.net
Ad-Click Prediction using Prediction Algorithm: Machine Learning Approach Jitendra Mahindra Bagul1, Tushar B. Kute 2 1Student,
Dept. of Computer Engineering, KBT College of Engineering, Maharashtra, India 2Associate Director, MITU Skillologies, Pune ----------------------------------------------------------------------***--------------------------------------------------------------------Abstract - It is necessary to predict probably profitable users who can click target ads (i.e. activity Targeting), in advertising trade. The task selects the potential users that are possible to click the ads by analysing user's clicking/web browsing data and further more as displaying the foremost relevant ads to them. This paper presents associate empirical study of exploitation totally different web of things techniques to predict whether or not an advertisement are going to be clicked or not. We tend to perform click prediction on a binary scale one for click and zero for no click. We tend to use clicks information from advertizing.csv provided as a region of Kaggle competition as our information set. We tend to perform feature choice to get rid of options that don't facilitate improve classifier accuracy. We tend to examine information manually and conjointly use feature choice capability.
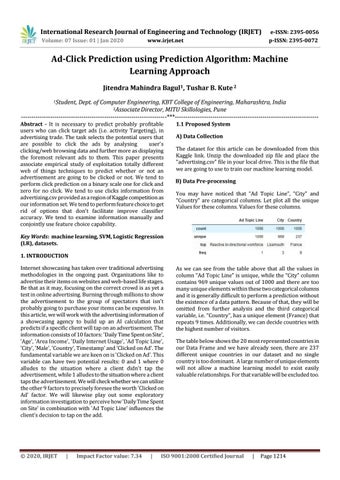
1.1 Proposed System A) Data Collection The dataset for this article can be downloaded from this Kaggle link. Unzip the downloaded zip file and place the “advertising.csv” file in your local drive. This is the file that we are going to use to train our machine learning model. B) Data Pre-processing You may have noticed that “Ad Topic Line”, “City” and “Country” are categorical columns. Let plot all the unique Values for these columns. Values for these columns.
Key Words: machine learning, SVM, Logistic Regression (LR), datasets. 1. INTRODUCTION Internet showcasing has taken over traditional advertising methodologies in the ongoing past. Organizations like to advertise their items on websites and web-based life stages. Be that as it may, focusing on the correct crowd is as yet a test in online advertising. Burning through millions to show the advertisement to the group of spectators that isn't probably going to purchase your items can be expensive. In this article, we will work with the advertising information of a showcasing agency to build up an AI calculation that predicts if a specific client will tap on an advertisement. The information consists of 10 factors: 'Daily Time Spent on Site', 'Age', 'Area Income', 'Daily Internet Usage', 'Ad Topic Line', 'City', 'Male', 'Country', Timestamp' and 'Clicked on Ad'. The fundamental variable we are keen on is 'Clicked on Ad'. This variable can have two potential results: 0 and 1 where 0 alludes to the situation where a client didn't tap the advertisement, while 1 alludes to the situation where a client taps the advertisement. We will check whether we can utilize the other 9 factors to precisely foresee the worth 'Clicked on Ad' factor. We will likewise play out some exploratory information investigation to perceive how 'Daily Time Spent on Site' in combination with 'Ad Topic Line' influences the client's decision to tap on the add.
© 2020, IRJET
|
Impact Factor value: 7.34
|
As we can see from the table above that all the values in column “Ad Topic Line” is unique, while the “City” column contains 969 unique values out of 1000 and there are too many unique elements within these two categorical columns and it is generally difficult to perform a prediction without the existence of a data pattern. Because of that, they will be omitted from further analysis and the third categorical variable, i.e. “Country”, has a unique element (France) that repeats 9 times. Additionally, we can decide countries with the highest number of visitors. The table below shows the 20 most represented countries in our Data Frame and we have already seen, there are 237 different unique countries in our dataset and no single country is too dominant. A large number of unique elements will not allow a machine learning model to exist easily valuable relationships. For that variable will be excluded too.
ISO 9001:2008 Certified Journal
|
Page 1214